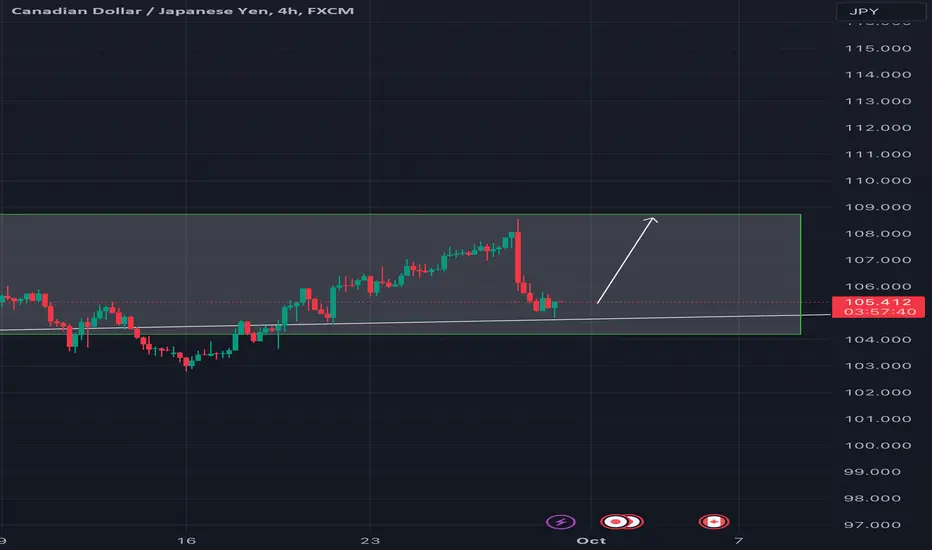
CAD/JPY Bullish Breakout: Potential Buy OpportunitiesThe CAD/JPY 4-hour chart shows a strong bullish movement after completing a Bullish Gartley harmonic pattern. The support zone around point D, acted as a significant reversal point. Now, the price has broken through a descending resistance line, indicating a potential continuation of the bullish trend in the short term. Positive momentum and a favorable technical setup are present, supported by the TDIGMA oscillator moving into overbought territory, confirming strong upward momentum.
1. Buy on Retest of the Broken Trendline
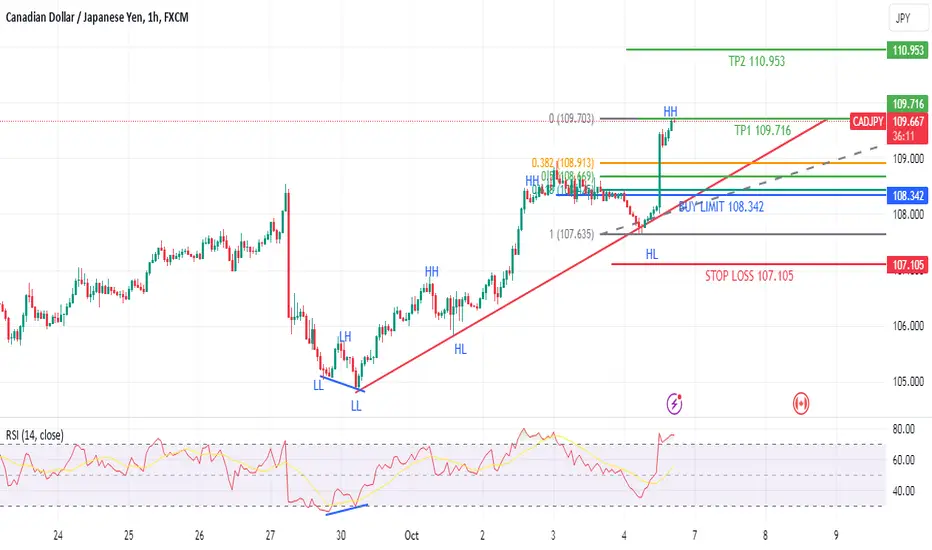
After breaking the descending trendline, the price may retest this line as support, presenting a buying opportunity on a pullback. This strategy targets the continuation of the bullish movement.
Entry: Buy between 108.20 - 108.40 on the retest of the broken trendline.
Stop Loss: 108.105 (below the recent consolidation zone).
Risk-Reward Ratio: 1:1
Rationale: The strong uptrend and breakout from resistance make this pullback buy strategy highly probable.
2. Buy on Continuation After Consolidation
If the price continues to rise without retesting the broken trendline, wait for a consolidation phase and look for a buying opportunity once the upward trend pauses, aiming for a continuation of the bullish move.
Entry: Buy around 109.505 after a consolidation phase.
Stop Loss: 108.105 (below the consolidation zone).
Risk-Reward Ratio: 1:1
Rationale: A continuation buy strategy can be effective, but it’s crucial to watch for clear signs of a pause in the movement before entering.
Final Notes
CAD/JPY is showing clear bullish signals after breaking a descending trendline. The strategy to buy on the retest of the broken line offers a high probability of success. Alternatively, buying after a consolidation phase provides another viable strategy with a solid risk-reward ratio. Monitoring price action and confirmation signals on lower timeframes is essential for adjusting entries in real-time.
JPYCAD trade ideas

CAD/JPY Buy Setup Pending Bullish TDI ConfirmationCAD/JPY is showing an OLHC structure for September on the daily timeframe, indicating a potential buy setup.
Buyers are expected to enter the market once a bullish TDI cross appears on the daily chart. My target after the bullish cross is 108.000 .
Trade with caution, and if you find this idea helpful, please support it with a like, comment, and share."

CADJPY LONGCADJPY is in up trend. its is making HH and HL. there is no divergence. place buy limit at fib level 68.1
CADJPY Will Go Down From Resistance! Short!
Here is our detailed technical review for CADJPY.
Time Frame: 15m
Current Trend: Bearish
Sentiment: Overbought (based on 7-period RSI)
Forecast: Bearish
The market is approaching a key horizontal level 108.351.
Considering the today's price action, probabilities will be high to see a movement to 108.001.
P.S
Overbought describes a period of time where there has been a significant and consistent upward move in price over a period of time without much pullback.
Like and subscribe and comment my ideas if you enjoy them!

CADJPY potential sell at resistance I'm currently taking a sell on CADJPY as price approaches a strong resistance level around 108.6. Despite the recent bullish momentum, this level has previously acted as a barrier, and combined with a rising wedge pattern, it suggests potential exhaustion of the uptrend. If price fails to break and hold above this resistance, a bearish reversal could follow, offering a good sell opportunity.

cadjpyeasy tokyo session shorts , nothing too \crazy easy work....
tokyo session cxadjpy will never miss also london but tokyo is amazing, had a boy w me seeing it b4 it played out

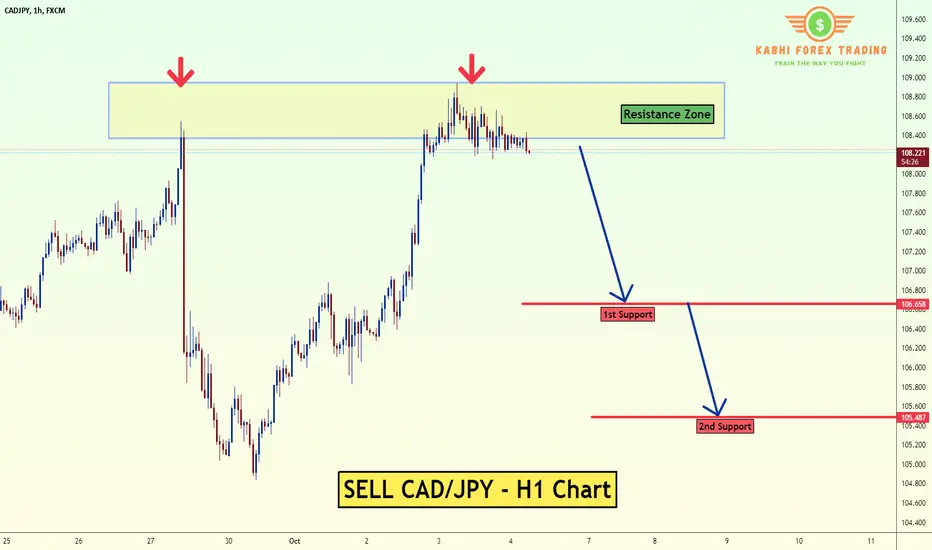
Sell CAD/JPY Resistance ZoneThe CAD/JPY pair on the H1 timeframe presents a potential selling opportunity @ Resistance Zone
Key Points:
Sell Entry: Consider entering a short position around the current price of 108.25.
Target Levels:
1st Support – 106.65
2nd Support – 105.48
Stop-Loss: To manage risk, place a stop-loss order above 109.02. This helps limit potential losses if the price unexpectedly reverses and breaks back upwards.
Your likes and comments are incredibly motivating and will encourage me to share more analysis with you.
Best Regards, KABHI FOREX TRADING
Thank you.
CADJPY - Bearish Pressure Soon!Hello TradingView Family / Fellow Traders. This is Richard, also known as theSignalyst.
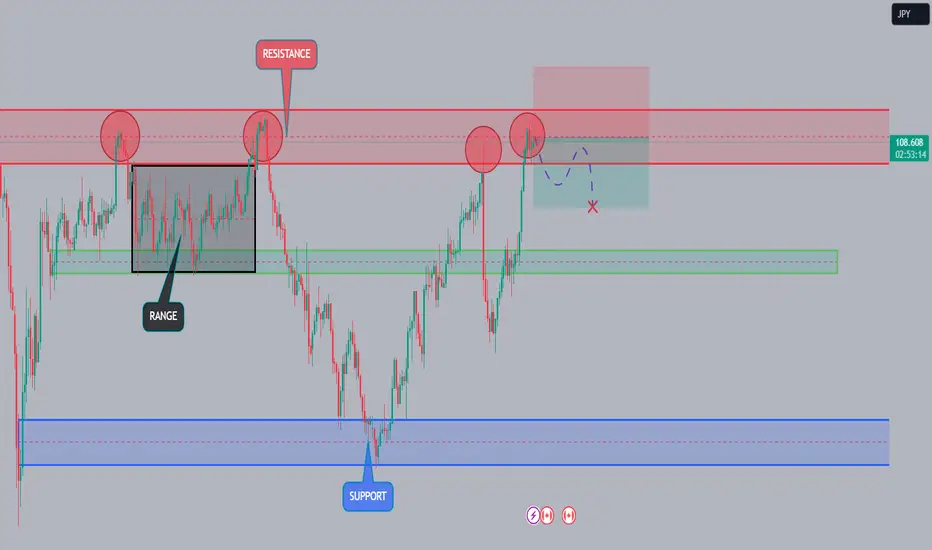
📈 CADJPY has been hovering within a big range marked in blue.
Currently, CADJPY is retesting the upper bound of the range.
Moreover, the upper green trendline acts as a non-horizontal resistance.
🏹 Thus, the highlighted red circle is a strong area to look for sell setups as it is the intersection of the major high and upper trendline.
📚 As per my trading style:
As #CADJPY is around the red circle zone, I will be looking for bearish reversal setups (like a double top pattern, trendline break , and so on...)
📚 Always follow your trading plan regarding entry, risk management, and trade management.
Good luck!
All Strategies Are Good; If Managed Properly!
~Rich

CADJPYEVERYTHING ON CHART
please check my pre idea so you can understand better
signals and analsys are free... and always will be
CADJPY is now at resistance. we can expect downside momentum nowCADJPY is now at resistance. we can expect downside momentum now
Support is between the price of 103.67 and 102.87
Resistance is between the price of 109.17 and 108.22
There is a point where the price is consolidating 106.67 and 106.27
Now the price is at resistance zone so now we can expect the price may come down, we can see the price touches the resistance multiple time.
according to my analysis it suggests the :-
Entry price :- 108.692
Take Profit :- 107.443
Stop loss :- 109.941
CAD-JPY Short From Resistance! Sell!
Hello,Traders!
CAD-JPY is going up now
But the pair will soon hit
A horizontal resistance
Level of 109.051 from
Where we will be expecting
A local bearish correction
Sell!
Like, comment and subscribe to help us grow!
Check out other forecasts below too!

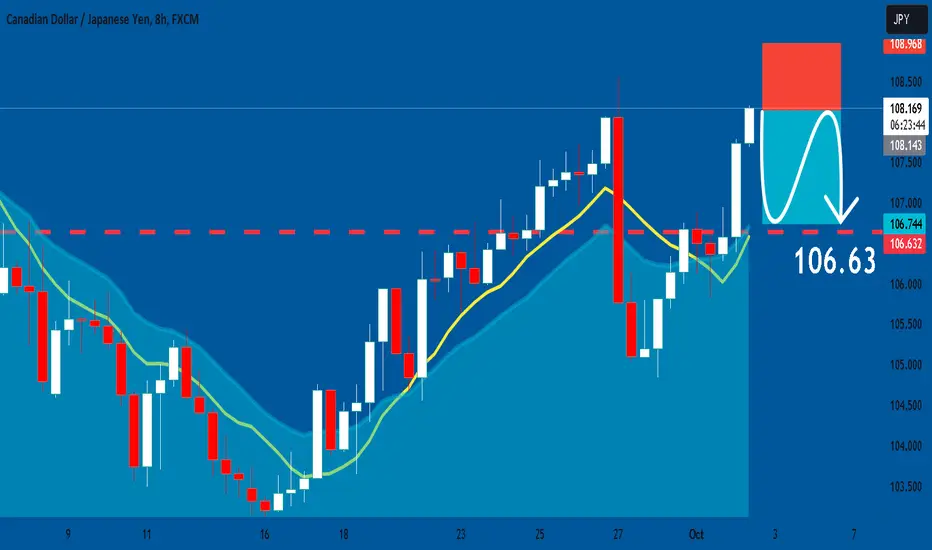
CADJPY: Short Trade with Entry/SL/TP
CADJPY
- Classic bearish formation
- Our team expects fall
SUGGESTED TRADE:
Swing Trade
Sell CADJPY
Entry Level - 108.18
Sl - 108.96
Tp - 106.63
Our Risk - 1%
Start protection of your profits from lower levels
❤️ Please, support our work with like & comment! ❤️
CAD/JPY Key Areas (October)CAD/JPY has continued momentum to the upside despite fear sentiment coming into markets last night.
Key levels persist amongst a tentative BOJ.
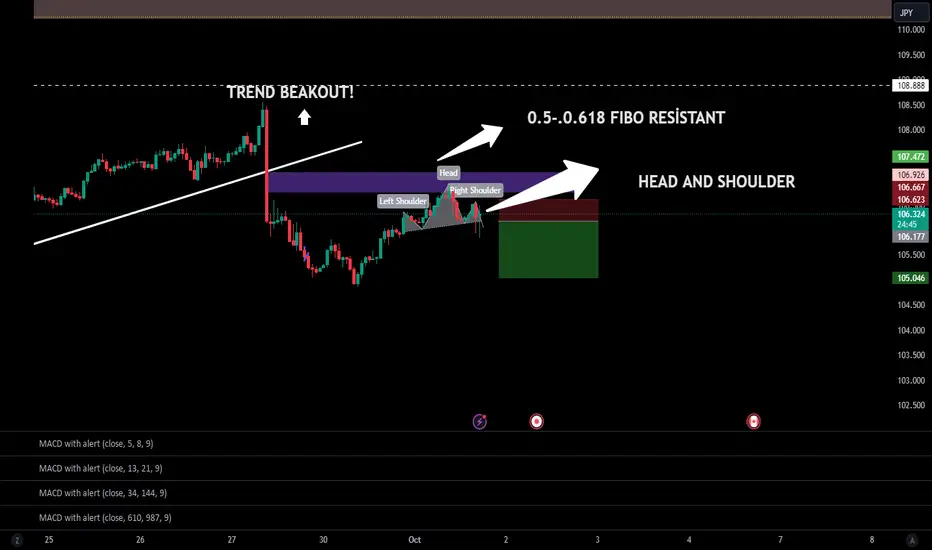
CADJPY 1H SHORT TREND BREAK-OUT R TEST HEAD AND SHOLDUR FIBO RESThere are strong signs of a downtrend in the Cadjpy pair. Trend break Retest head and sholders and strong Fibo resistance reversal
time t o buy asia markets. jpysright after a green day signal. perfect entry points at closing price.

#CADJPY 1HCAD/JPY 1-Hour Chart Forecast
The CAD/JPY pair is showing **bullish potential** on the 1-hour chart, suggesting an opportunity to enter a **buy trade**. The pair may have been experiencing upward momentum, with key technical indicators pointing toward continued strength.
The following key elements support the buy forecast:
Uptrend Formation: The pair is likely respecting an upward trendline or breaking above recent resistance, indicating strong buying pressure.
Momentum Indicators: Oscillators such as the RSI or MACD may confirm bullish momentum, signaling that there is room for further upside.
Support Levels: The pair could be bouncing off a key support zone, offering an attractive entry point for buyers looking to ride the trend higher.
Traders looking to enter a buy trade should consider setting stop-loss orders below recent swing lows to manage risk in case of a pullback. Targeting previous highs or key resistance levels is recommended as potential take-profit areas. Keeping an eye on any shifts in sentiment or market conditions is essential, but overall, the technical picture supports a **buy forecast** for CAD/JPY in the short term.

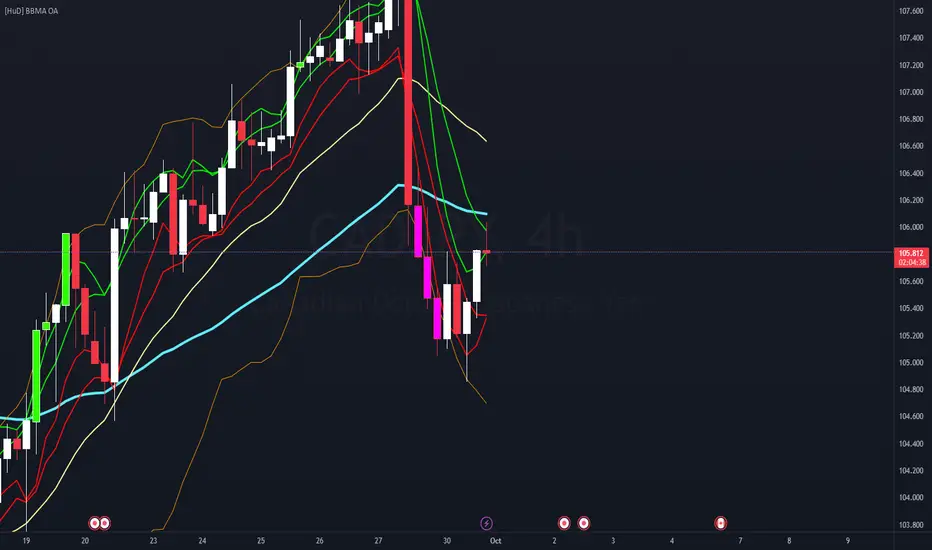
CADJPY Possible short Position BBMA OA ReEntry Zone Zero Loss4H - Re-Entry
1H - 50 EMA Rejection + Bollinger Band
Rejection
15m - Entry in MAHI
Note:
* Cancel trade or cut-loss when candle close Above MAHI (2 Green Color Lines) in 4H
* 1:3 RRR
* TAYOR
A combination of multiple moving averages and Bollinger Bands is the BBMA OMA Ally strategy. It provides an extensive and reliable examination of market trends and patterns by utilizing the strength of both indicators. It is a multi-time frame analysis
I am using the BBMA OA Reentry Zone Zero Loss Strategy as a basic reaction to recent market events, rather than attempting to forecast the market's future course
CADJPY moving in downtrendCADJPY has broken upward trend line on hourly time frame and know price is printing higher lows and lower lows which indicates downtrend .

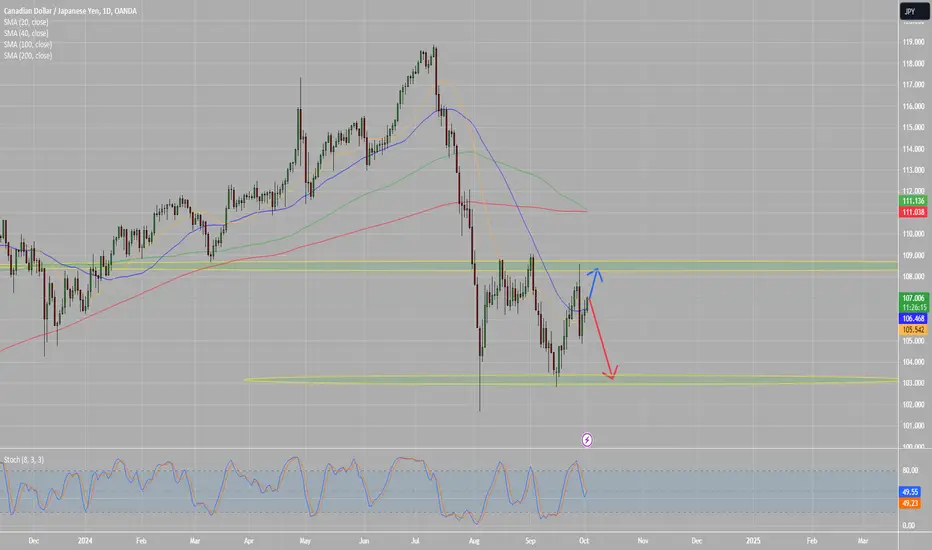
CadJpy Trade IdeaA pair that correlates with EJ is CJ. If both pairs can pullback to retest the structure flip after respecting the range then we can expect both pairs to crash to the downside to continue the range between 106.140 and 103.450.

Alert at JPYThis Week CADJPY will move in this range. On Monday CADJPY will be bullish but it will shift to bearish when H4 takes turn pass the Simple Moving Average 5.

CADJPY View!!In the long-running battle between stocks and bonds, the latter is usually right when it comes to the economy. Given that oil and the yen are also flagging trouble, the signs are hard to ignore.
In early August, when US yields fell, it looked like a reaction to a flight-to-safety as some air came out of the AI trade and megacap tech stocks but when those rebounded, yields didn't. Now they've fallen even further and signal a hasty Fed rate cutting cycle. Now Powell may front-load rate cuts in an effort to stick a soft landing but that path is perilous.

