EURJPY 4Hour TF - July 6th, 2025EURJPY 7/6/2025
EURJPY 4hour Bullish Idea
Monthly - Bullish
Weekly - Bullish
Daily - Bullish
4hour - Bullish
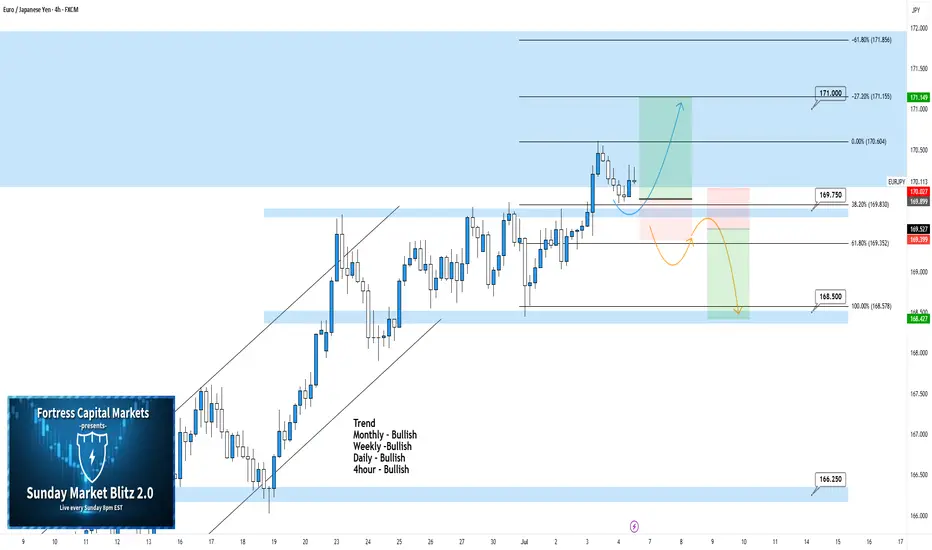
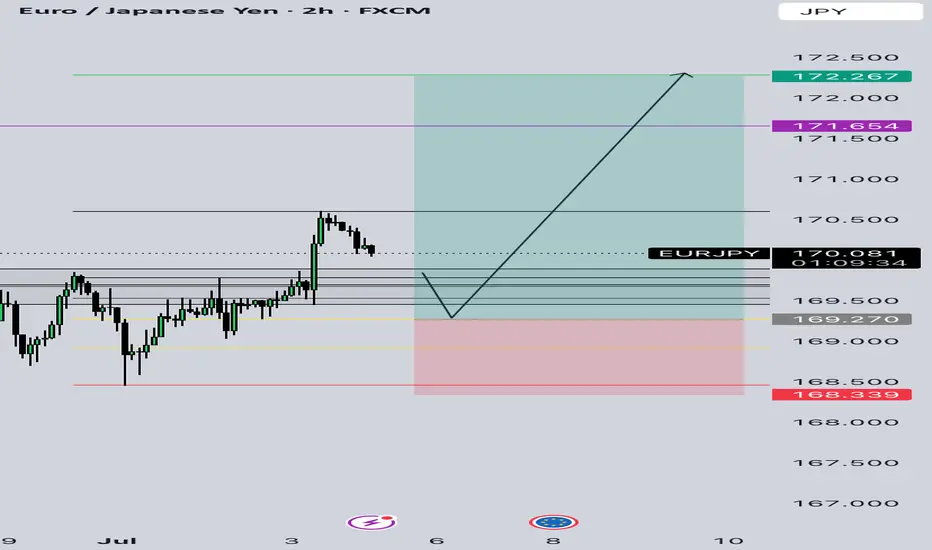
EJ is doing it’s thing and sticking with it’s bullish trend for now. The only conflicting signal is this major monthly zone around the 171.000 area so we will have to be careful.
Let’s keep a look out for two potential scenarios going into this week:
Bullish Continuation - We just saw a break above the 169.750 4hour zone which is fairly significant and it is signaling new support for this currently forming higher low, which is great. From here we’re looking for this bullish trend to continue, look for strong bullish conviction coming off this 169.750 zone and look to target higher.
Trend Reversal - This is a possibility with our 171.000 looming overhead. If we start to see bearish rejection look for a lower high below 169.750 and look to target lower toward key support levels.
JPYEUR trade ideas
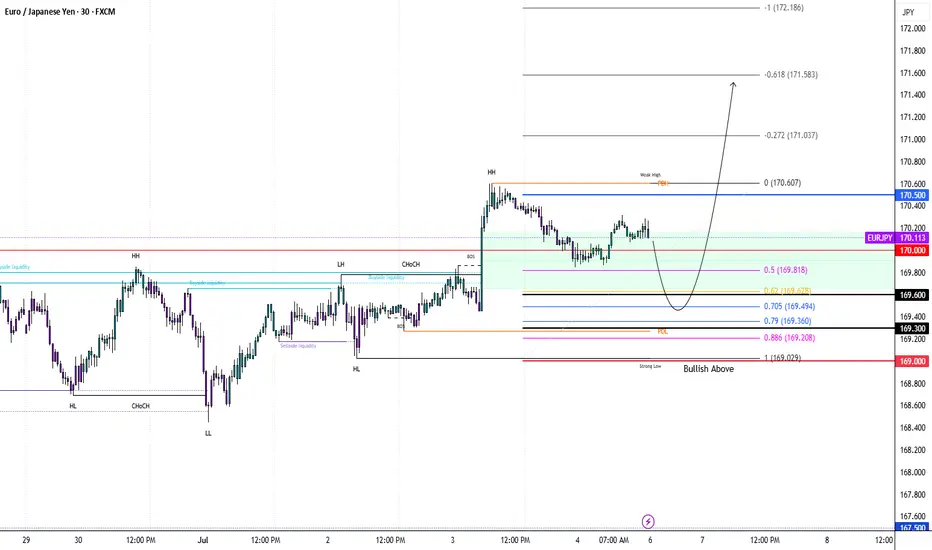
EURJPY: Trading Above Major QP 170. Strong Bullish Trend EJ broke above the key psychological level of 170.00, and has not found major resistance yet. Expecting a bullish trend continuation as long as price stays above 169.
* M30 Bullish Choch
* Creating new HHs and HLs
* M30/H1 Bearish Break Block
* M30/H1 Bullish FVG (50% filled)
🟢Entry: 168.40 – 168.60
Stop Loss: 168.00
TP1: 169.80
TP2: 170.50
TP3: 171.20
Breakout Option: If price pushes above 170.50 early in the week, consider breakout entry on retest.
Invalidation: Bias shifts to neutral if H4 closes below 169.00.
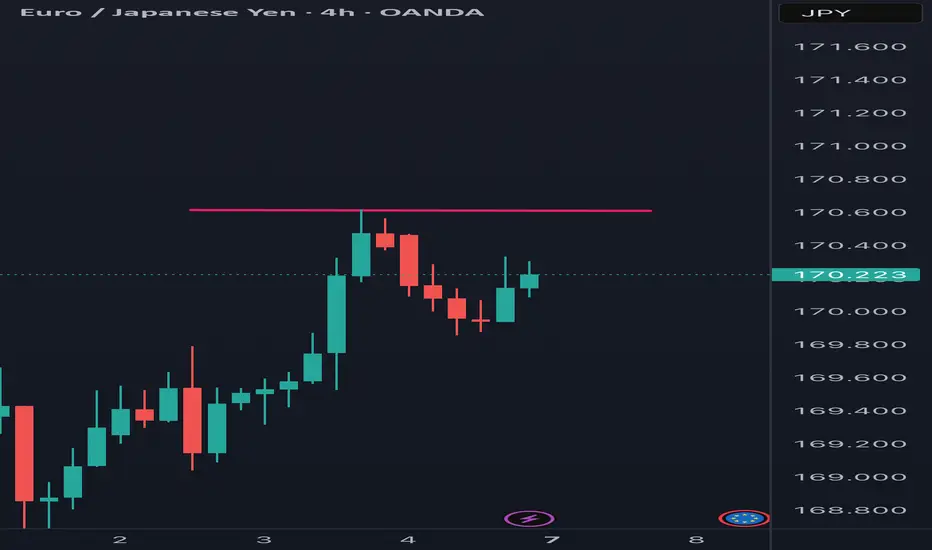
Downward move from resistance levelThe price of EURJPY is moving towards the resistance level on the H-4 timeframe and it is expected that the market will go downtrend after reaching the resistance level.
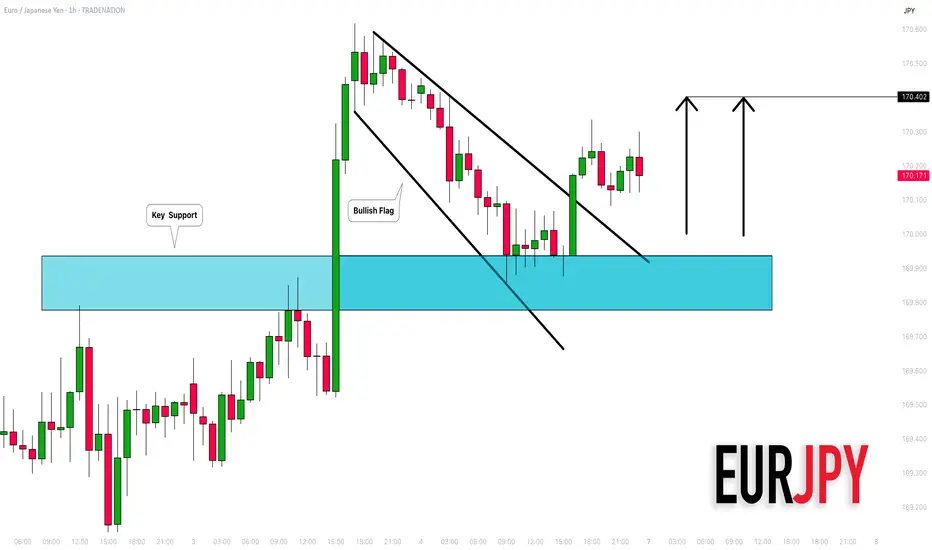
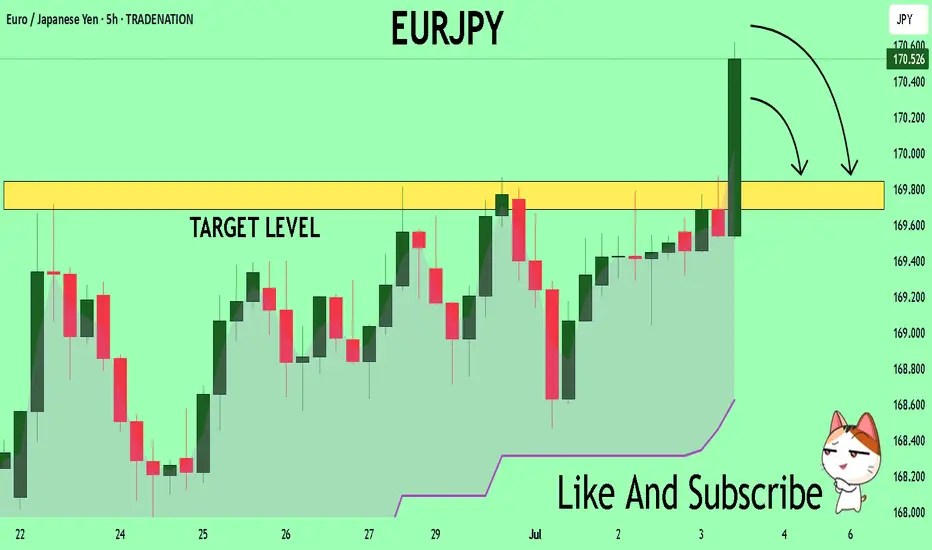
EURJPY: Bullish Outlook Explained 🇪🇺🇯🇵
There is a high chance that EURJPY will continue rising
from an underlined horizontal support.
I see 2 strong price action confirmations:
the price violated a resistance line of a bullish flag
and a neckline of a double bottom pattern.
Goal - 170.4
❤️Please, support my work with like, thank you!❤️
I am part of Trade Nation's Influencer program and receive a monthly fee for using their TradingView charts in my analysis.
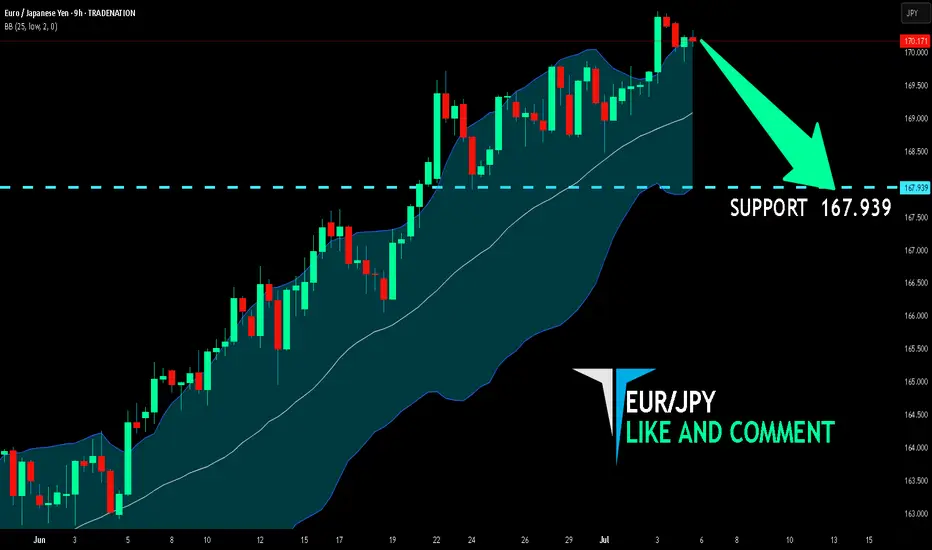
EUR/JPY BEARISH BIAS RIGHT NOW| SHORT
Hello, Friends!
We are now examining the EUR/JPY pair and we can see that the pair is going up locally while also being in a uptrend on the 1W TF. But there is also a powerful signal from the BB upper band being nearby, indicating that the pair is overbought so we can go short from the resistance line above and a target at 167.939 level.
Disclosure: I am part of Trade Nation's Influencer program and receive a monthly fee for using their TradingView charts in my analysis.
✅LIKE AND COMMENT MY IDEAS✅
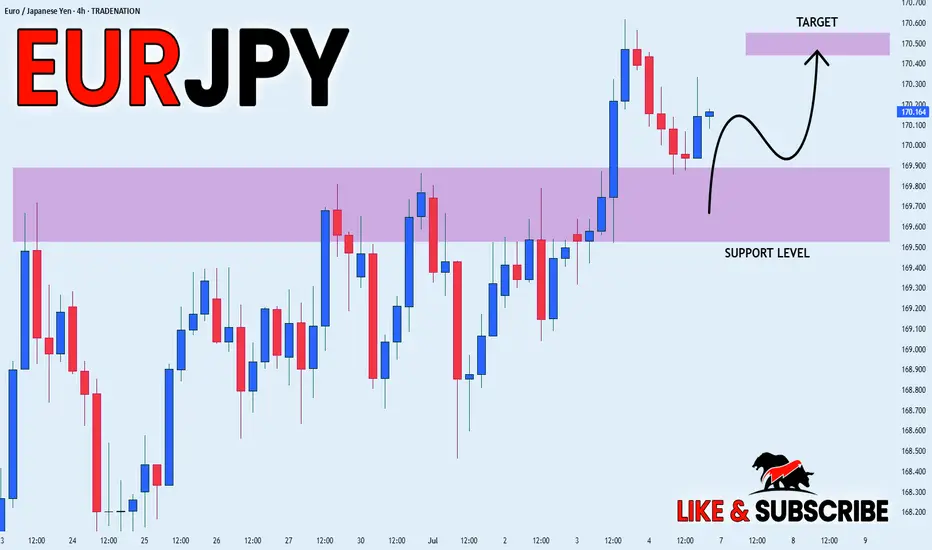
EUR_JPY WILL GO UP|LONG|
✅EUR_JPY is trading in an
Uptrend and the pair has already
Made a retest of the horizotnal
Support of 169.800 and we are
Already seeing a bullish rebound
So we are bullish biased and
We will be expecting a
Further bullish move up
LONG🚀
✅Like and subscribe to never miss a new idea!✅
Disclosure: I am part of Trade Nation's Influencer program and receive a monthly fee for using their TradingView charts in my analysis.
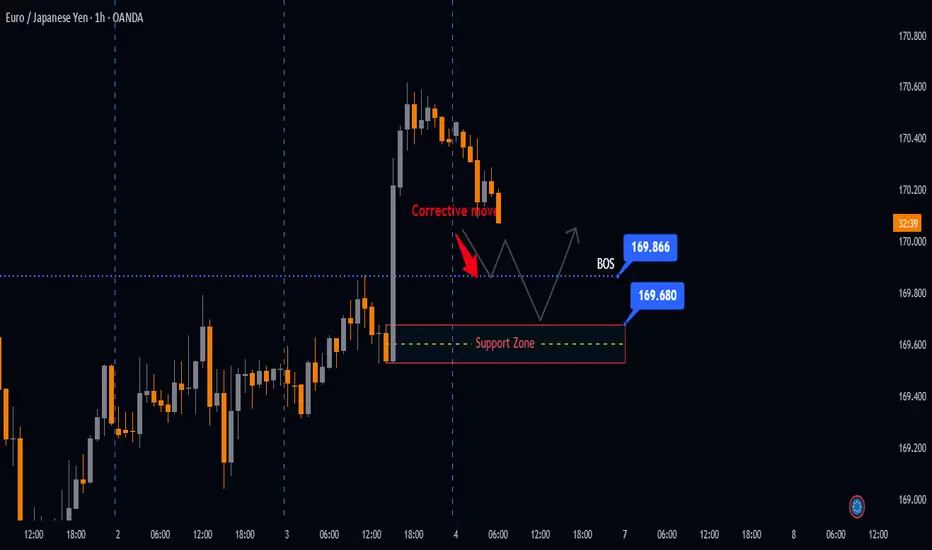
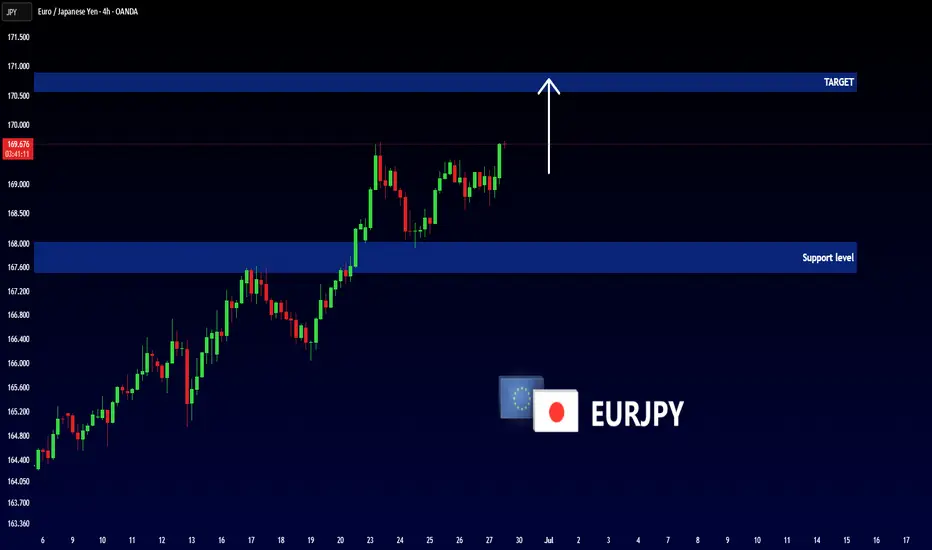
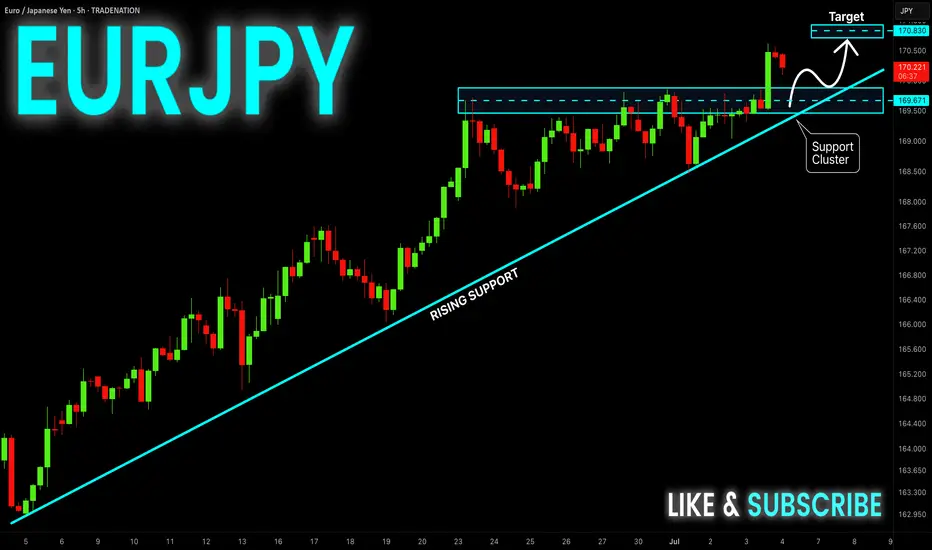
Potential Bullish setups on EURJPYRecapping price action from yesterday, EURJPY broke above 169.866, with momentum appearing to be bullish, a corrective move could be in play and perhaps a continuation towards the upside. If EURJPY remains above our support zone a BULLISH directional bias remains.
Buy zone: 169.866 - 169.680
Target Levels 170.469 - 170.617
LIKE or COMMENT if this idea sparks your interest, or share your thoughts below!
FOLLOW to keep up with fresh ideas.
Tidypips: "Keep It Clean, Trade Mean!"
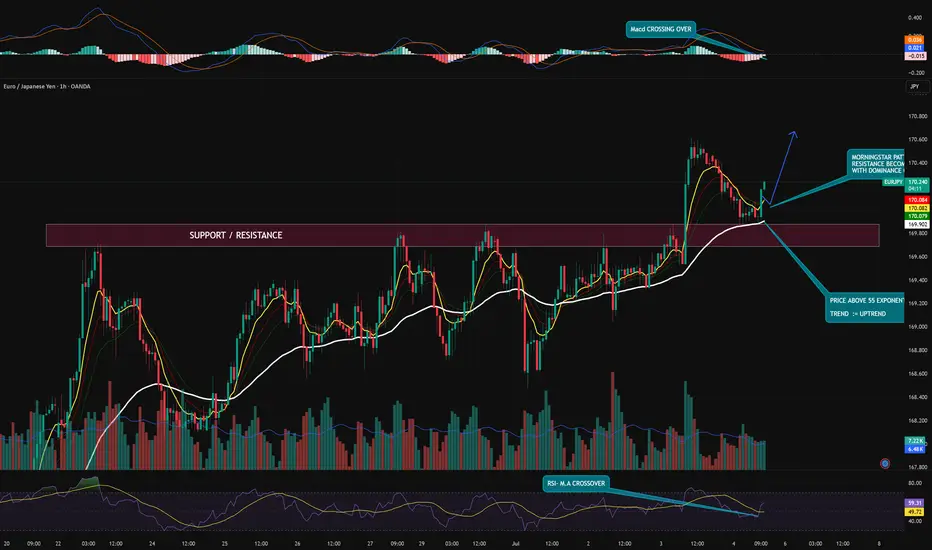
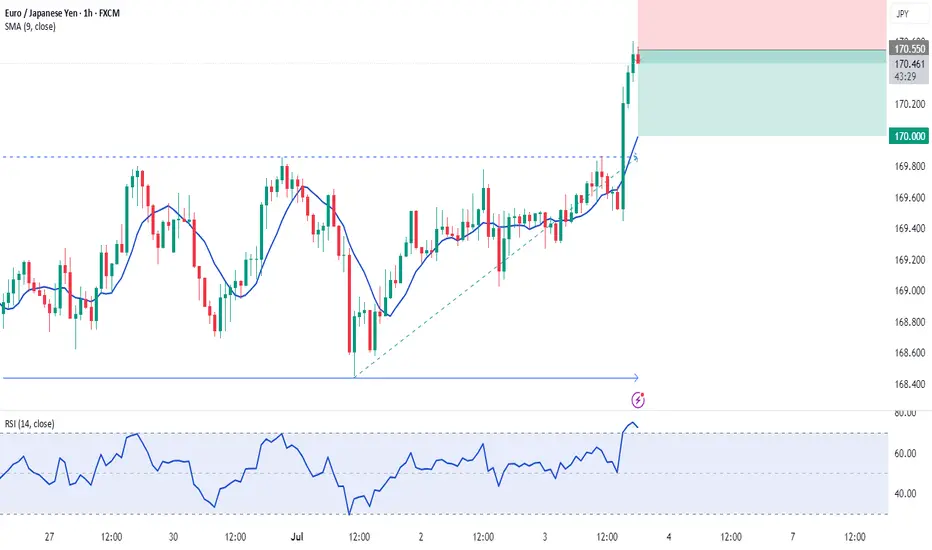
EUR/JPY – Morning Star Reversal with RSI/MA Bullish ConfirmationTechnical Snapshot (1H Timeframe):
✅ Morning Star pattern at key support/resistance zone (169.90–170.00), indicating potential bullish reversal.
📈 Price holds above 55 EMA, confirming structure support and sustained uptrend.
💥 MACD Bullish Crossover signaling renewed upward momentum.
🔄 RSI crossover above its MA from the 50 level – a classic sign of buyer strength resuming.
Bias: Bullish
As long as price sustains above the EMA cluster and doesn’t close below the 170.00 zone, bulls are in control. Watch for a retest + push scenario for low-risk entries.
This idea is for educational purposes only – not financial advice.
EURJPY What Next? SELL!
My dear friends,
My technical analysis for EURJPY is below:
The market is trading on 170.54 pivot level.
Bias - Bearish
Technical Indicators: Both Super Trend & Pivot HL indicate a highly probable Bearish continuation.
Target - 169.84
About Used Indicators:
A pivot point is a technical analysis indicator, or calculations, used to determine the overall trend of the market over different time frames.
Disclosure: I am part of Trade Nation's Influencer program and receive a monthly fee for using their TradingView charts in my analysis.
———————————
WISH YOU ALL LUCK
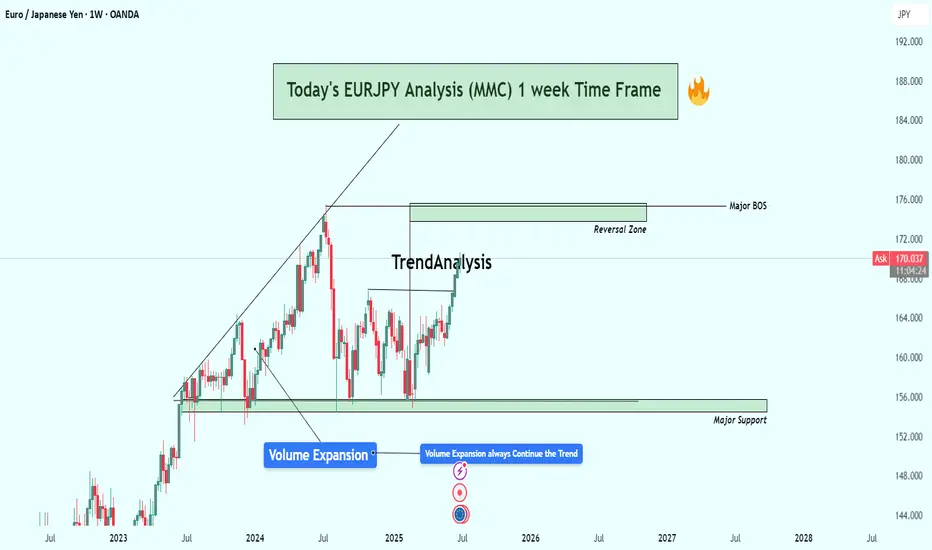
EURJPY Weekly Analysis (MMC + SMC) - Trend Expansion + Target🧠 Contextual Overview:
EURJPY has been on a strong long-term bullish rally, fueled by institutional demand and consistent volume expansion patterns. This pair is approaching a critical macro resistance/reversal zone around the 175–176 level, where historically large players have shown interest in redistributing or taking profit.
This analysis uses the MMC (Market Mechanics Concept) integrated with SMC (Smart Money Concepts) to provide a complete perspective on price structure, order flow, and volume behavior.
📊 Structural Breakdown:
🔹 1. Volume Expansion as a Leading Indicator
Volume precedes price — this is a foundational MMC principle.
The recent aggressive impulse to the upside is backed by clear volume expansion visible on higher time frames.
This type of movement indicates smart money accumulation and commitment, rather than retail-driven volatility.
A key insight: Volume Expansion typically signals trend continuation, not reversal—unless a liquidity grab or divergence shows up in reversal zones.
🔹 2. Break of Structure (BOS) Confirms Trend Continuation
A clear BOS occurred when price violated previous swing highs around the 165–167 range.
This BOS suggests a new bullish leg is forming, confirming the market has transitioned from consolidation (accumulation) to distribution (markup phase).
🔹 3. Current Price Path: Heading into a Key Reversal Zone (175–176)
This zone has been mapped based on previous supply imbalances and historical resistance.
Price may tap into this zone before we see either:
A clean continuation above (indicating absorption of supply), or
A rejection or smart money sell-off pattern (distribution, divergence, or exhaustion candles).
Institutions tend to execute significant moves in these areas — watch for liquidity sweep traps and break-of-structure (BOS) on lower timeframes for confirmation.
🧱 Support Zones & Safety Net:
🔸 Major Support: 155–157 Zone
This is a historically significant demand block, respected multiple times since 2023.
A drop into this region could offer a prime long-term swing entry, should price reject the reversal zone.
Also acts as invalidity for current bullish structure. A weekly close below this would signal a potential trend shift or deeper correction.
📉 Technical Patterns & Confluences:
Trendline Breakout + Retest occurred from 2024 into early 2025. This is a classic break-and-retest continuation pattern, confirming bullish interest from smart money.
Price consolidated (reaccumulation) and exploded upward with volume expansion, aligning with Wyckoff theory’s markup phase.
Strong candles with minimal upper wicks = clear sign of institutional commitment.
🎯 Trade Strategy & Scenarios:
🟢 Bullish Continuation Scenario:
If price breaks above 176.000 with volume and closes weekly bullish, expect continuation toward 180.00+ in coming months.
Watch for:
Clean BOS above the reversal zone
Volume expansion confirmation
Retest of breakout level (176–174) for safe re-entry
🔴 Bearish Rejection Scenario:
If price rejects the reversal zone with bearish engulfing or divergence, expect a retracement back toward 165–162 short-term, and possibly 157–155 long-term.
Lower time frame structure shift (BOS to the downside) will confirm early exit from bulls or reversal setups for bears.
🧠 Psychological Perspective:
Smart Money uses reversal zones to entice late buyers before triggering liquidity grabs.
Reversal zones serve as liquidity magnets, often leading to false breakouts before true direction is revealed.
Retail traders often buy into strength at these levels, providing liquidity for institutional exits.
📌 Summary:
✅ Trend: Strong bullish
✅ Structure: Clean BOS with volume confirmation
✅ Next Key Level: 175–176 (Reversal Zone)
✅ Strategy: Monitor for rejection/continuation; align with volume + structure
✅ Volume Behavior: Expansion supports trend continuation
🔖 Final Thoughts:
The EURJPY pair presents a highly educational and strategic opportunity. Whether you trade intraday or swing, this zone (175–176) will define the market direction for the next few months. Use volume, structure shifts, and institutional behavior to guide your trades, not just candlestick patterns.
EURJPY - Important Breakout !Hello Traders !
The EURJPY price broke the resistance level (167.520 - 168.018).
This key level becomes new support!
So, I expect a bullish move🚀
_______________
TARGET: 170.570
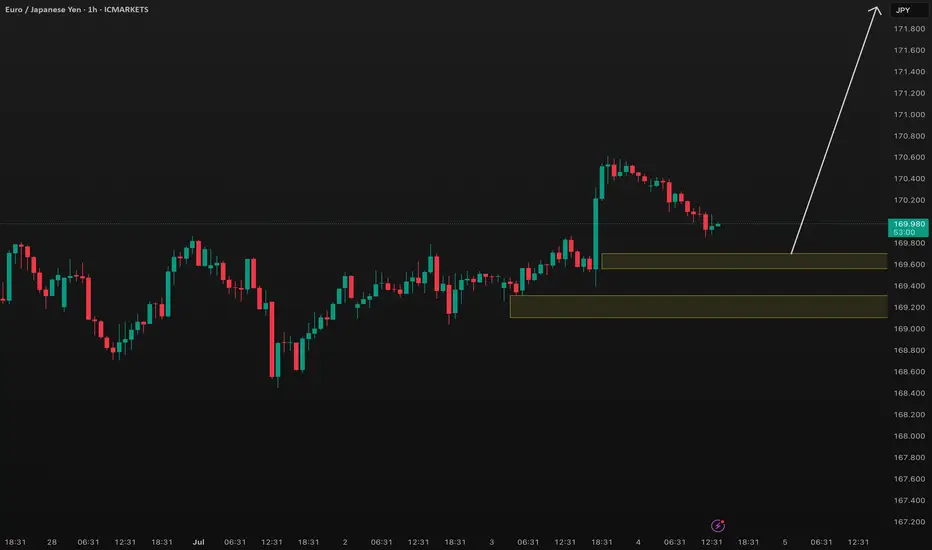
EURJPY BUY TRADE PLAN### 🔥 Pair + Date
**EURJPY – July 4, 2025**
---
### 📋 Plan Overview Table
| Type | Direction | Confidence | R\:R | Status |
| ---------------- | --------- | ---------- | ----- | ------------- |
| Momentum Retrace | Long | 78% | 2.8:1 | Active Watch |
| Value Limit Play | Long | 83% | 3.5:1 | Pending Setup |
---
### 📈 Market Bias & Type
* **Market Bias:** Bullish continuation on macro + structural trend (despite short-term pullback).
* **Type:** Continuation with retrace entry
---
### 🔰 Confidence Level
* **Overall Confidence:** 78% Momentum Retrace, 83% Deep Value
* **Breakdown:**
* Macro alignment: +7 sentiment
* Structure: Valid higher high / higher low formation
* Confirmation: Pending at retrace zone
---
### 📍 Entry Zones
* **Primary (Momentum Retrace):** 169.55 – 169.70 zone (structural retrace zone to broken high / support flip)
* **Secondary (Value Limit Play):** 169.10 – 169.30 (deep value at prior breakout cluster + H4 origin block)
---
### ❗ SL with Reasoning
* **Momentum Retrace SL:** 169.20 (below key low + liquidity sweep risk zone)
* **Value Limit SL:** 168.80 (below value zone + invalidation of bullish structure)
---
### 🎯 TP1/TP2/TP3 Targets
* **TP1:** 170.60 (recent swing high)
* **TP2:** 171.20 (expansion target)
* **TP3:** 172.00 (macro extension projection)
---
### 🧠 Management Strategy
* Scale out at TP1 (50%)
* Move to breakeven on rest after TP1 hit
* Trail above H1 swing lows post TP2
---
### ⚠️ Confirmation Checklist
✅ Bullish candle on H1 / M30 at entry
✅ Session: London / NY overlap preferred
✅ Volume spike or wick rejection on retrace
---
### ⏳ Validity
* **Momentum Retrace:** H1 plan valid 12-16 hours
* **Deep Value:** H4 plan valid 48 hours+
---
### ❌ Invalidation Conditions
* Clean break + close below 168.80 on H4
* Risk sentiment flips risk-off sharply (JPY safe haven flows surge)
---
### 🌐 Fundamental & Sentiment Snapshot
* Macro bias: Bullish EURJPY continuation (ECB hawkish tilt + BOJ still ultra-loose policy)
* Recent data: Post-NFP risk sentiment neutral-positive, no fresh JPY strength triggers
* Sentiment: +7 (supports trend continuation)
---
### 📋 Final Trade Summary
👉 EURJPY bullish continuation play. Primary focus on momentum retrace entry \~169.55–169.70 with deep value as secondary optional zone. SLs tailored per entry zone, R\:R targets healthy.
---
⚠ **Reminder:** This is *not* investment advice. Forex trading carries substantial risk. Use with licensed institutions only.
EUR/JPY: Bullish Setup on 170.00 Breakout & Dovish BoJWe've identified a compelling, high-conviction long trade setup on EUR/JPY, perfect for a limit order right now. This trade leverages a powerful combination of fundamental divergence and a confirmed technical breakout, setting the stage for quick execution and potential profit! 🎯💰
Fundamental Rationale: 🌍📊
Japanese Yen (JPY) Weakness: The JPY is under significant bearish pressure. 📉 The Bank of Japan's (BoJ) persistently dovish monetary policy, keeping interest rates at historic lows, creates a wide interest rate differential. This fuels "carry trades," where investors borrow low-yielding JPY to invest in higher-yielding currencies like the Euro, increasing JPY supply. Recent weak economic data, including a decline in Tokyo CPI, reinforces expectations that the BoJ will not hike rates in 2025. Additionally, a global "risk-on" sentiment diminishes the JPY's safe-haven appeal, leading to capital outflow and sustained Yen depreciation. 🐻📉
Euro (EUR) Stability: While the Euro isn't showing explosive bullish momentum, its relative stability provides a crucial counter-balance to the weakening Yen. 🇪🇺 The European Central Bank (ECB) is inclined to maintain its current policy, and recent Eurozone inflation data hasn't significantly altered expectations for further rate cuts in H2 2025. This steady footing, paired with the pronounced JPY weakness, creates a compelling bullish case for EUR/JPY. The Euro's role is to be a stable anchor against a fundamentally weak JPY, allowing the cross to climb. ⚖️
Technical Setup: 📊✨
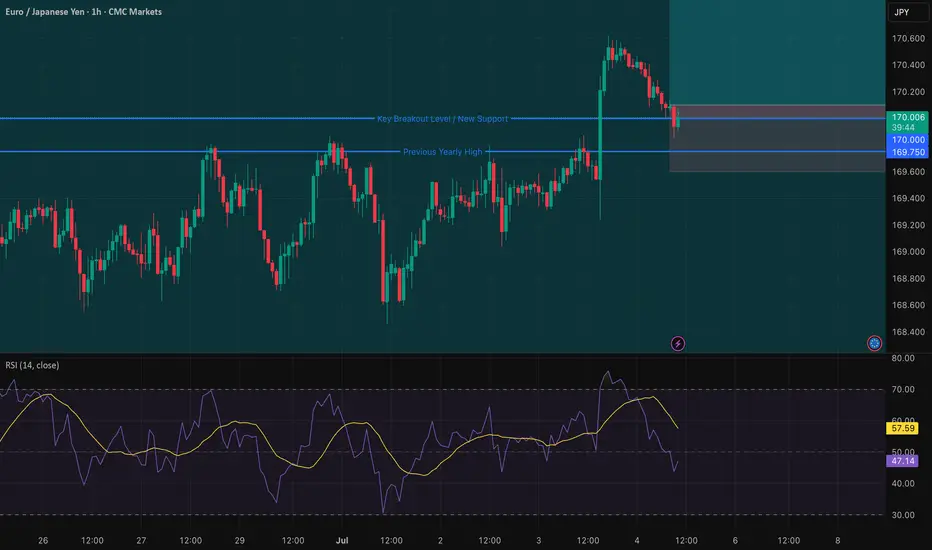
Decisive Breakout Confirmed: EUR/JPY has achieved a powerful and decisive breakout above the critical psychological resistance of 170.00 and its previous yearly high of 169.75. This is a monumental technical event! Such a sustained move above key long-term barriers signals strong underlying buying pressure and confirms a "new trigger for the bulls," indicating a high probability of continued uptrend. 🚀⬆️
High-Probability Entry Strategy: Our entry strategy is designed for a quick and successful fill. Following the confirmed breakout, we anticipate a classic "breakout and retest" phenomenon, where price pulls back to retest the former resistance (now new support). By placing a limit order slightly below the current market price, at 170.10, we aim to catch this anticipated pullback, securing an optimal entry with a tighter risk profile. 🔄🎯
Clear Resistance Target: Our single Take Profit target is strategically set at 170.90, just below the next significant resistance: the 78.6% Fibonacci retracement level at 170.93. This level, derived from a previous long-term decline, represents a key area where price might encounter resistance. Targeting slightly below it increases the probability of the TP being hit before any potential reversal. 🎯✅
Trade Parameters: 📋✨
Currency Pair: EUR/JPY 💶🇯🇵
Direction: Long (Buy) ⬆️
Entry (Limit Order): 170.10
Take Profit (TP): 170.90
Stop Loss (SL): 169.60
Risk-Reward Ratio: 1.6:1 (A favorable ratio for a high-probability setup!) ✅
EURJPY is rising to 173 for a bearish and larger pattern.EURJPY is rising to 173 for a bearish and larger pattern.
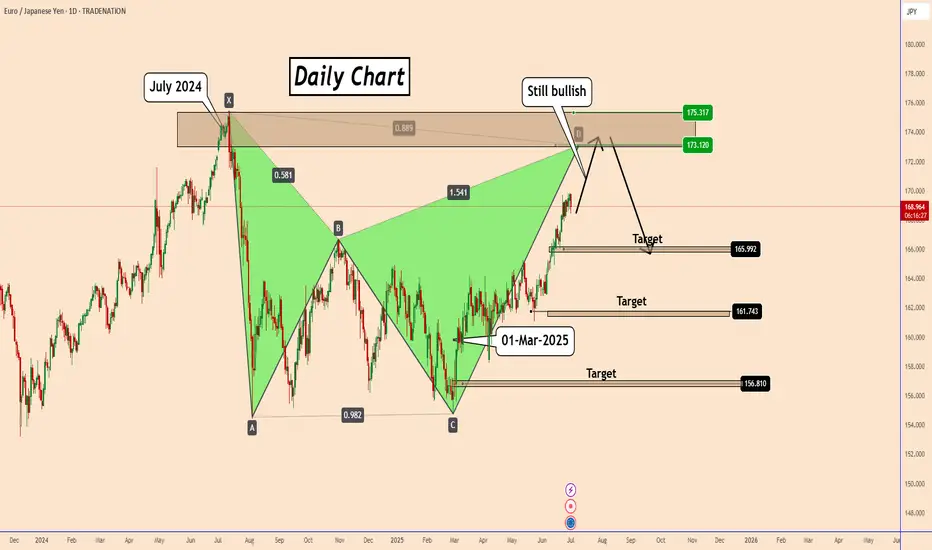
Since the beginning of March 2025, EURJPY started an uptrend and is still rising in a clear way with no signs of reversal.
As long as the BOJ has no plans to change its monetary policy statement or make any significant interventions in Forex, then EURJPY can continue to rise higher.
There is a high possibility that Eurjpy will complete a major daily harmonic pattern near 173.00.
Given that EURJPY may be close to the all-time high zone, the reversal could also occur within the zone, but I think EURJPY may start a reversal between 173.00 and the higher level. We can look for sell signals there.
At the moment, EURJPY is rising and may rise to 173.00, although not in a clear way.
You may find more details in the chart!
Thank you and Good Luck!
PS: Please support with a like or comment if you find this analysis useful for your trading day
Disclosure: I am part of Trade Nation's Influencer program and receive a monthly fee for using their TradingView charts in my analysis.
EUR-JPY Will Keep Growing!⭕Buy!
—
#EURJPY is trading in an
Uptrend and the pair broke
The key horizontal level
Of 169.814 and the breakout
Is confirmed so after a potential
Retest of the support cluster
Of the rising and horizontal
Support lines below we will
Be expecting a bullish continuation
Buy!

EURJPY SHORT DAILY FORECAST Q3 D4 W27 Y25EURJPY SHORT DAILY FORECAST Q3 D4 W27 Y25
Professional Risk Managers👋
Welcome back to another FRGNT chart update📈
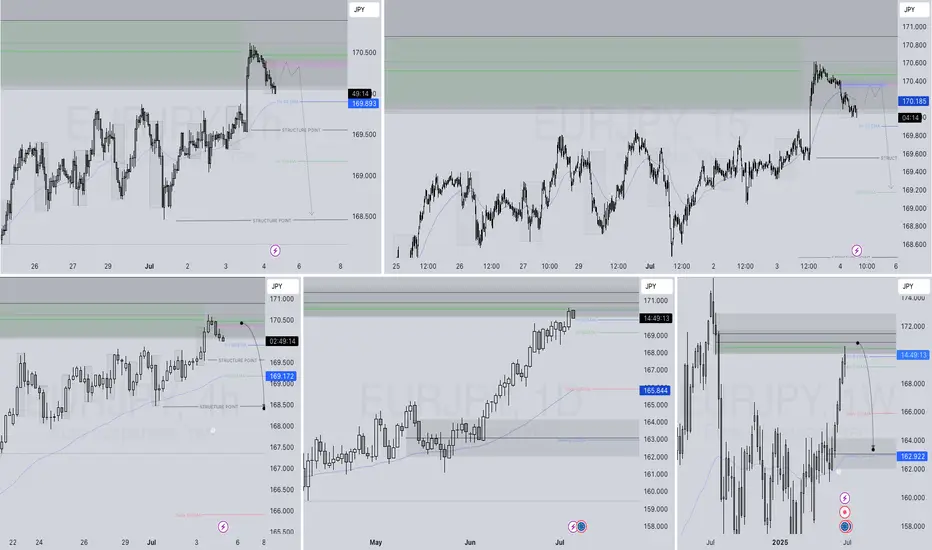
Diving into some Forex setups using predominantly higher time frame order blocks alongside confirmation breaks of structure.
Let’s see what price action is telling us today! 👀
💡Here are some trade confluences📝
✅Daily Order block identified
✅4H Order Block identified
✅1H Order Block identified
🔑 Remember, to participate in trading comes always with a degree of risk, therefore as professional risk managers it remains vital that we stick to our risk management plan as well as our trading strategies.
📈The rest, we leave to the balance of probabilities.
💡Fail to plan. Plan to fail.
🏆It has always been that simple.
❤️Good luck with your trading journey, I shall see you at the very top.
🎯Trade consistent, FRGNT X
EUR-JPY Will Keep Growing! Buy!
Hello,Traders!
EUR-JPY is trading in an
Uptrend and the pair broke
The key horizontal level
Of 169.814 and the breakout
Is confirmed so after a potential
Retest of the support cluster
Of the rising and horizontal
Support lines below we will
Be expecting a bullish continuation
Buy!
Comment and subscribe to help us grow!
Check out other forecasts below too!
Disclosure: I am part of Trade Nation's Influencer program and receive a monthly fee for using their TradingView charts in my analysis.
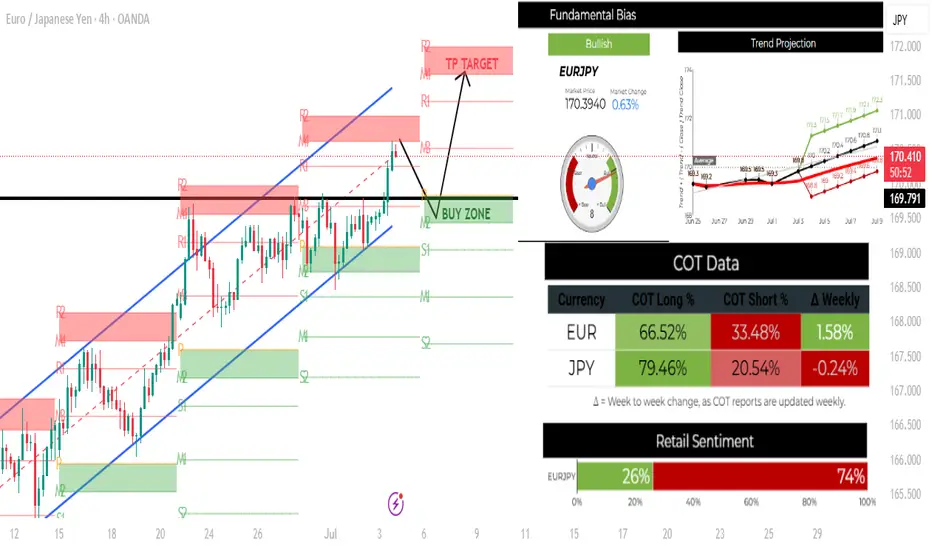
EURJPY H4 LONG SETUPTECHNICAL ANALYSIS
This pair is currently in a beautiful bullish trend, and price is currently at WM4/weekly tp@170.588. I am anticipating profit-taking from traders as the trading week comes to a close. This trade plan will probably play out next week.
Bulls will be looking for long setups at support @ 169.791/169.395, which is the buy zone and previous resistance.
A long trade at that level will give us a target @ 170.588 for next week.
FUNDAMENTAL ANALYSIS
The trend meter shows that the pair is bullish and projected to continue its bullish momentum.. Most institutional traders are long both currencies, but we can see a slight increase in longs for the Euro and short positions being added on JPY.
The retail sentiment indicator shows that most retail traders are short this pair, with 74% being short and only 26% being long, indicating they are on the wrong side of the trade.
The plan is to go long once price gets to the buy zone.
EURJPY Wave Analysis – 3 July 2025- EURJPY broke resistance level of 169.55
- Likely to rise to resistance level 72.00
EURJPY currency pair recently broke above the key resistance level 169.55 (which reversed the price multiple times at the end of June, as can be seen from the daily EURJPY chart below).
The breakout of the resistance level 169.55 accelerated the active short-term impulse wave 3 of the intermediate impulse wave (C) from February.
Given the clear daily uptrend, EURJPY currency pair can be expected to rise further to the next resistance level 172.00, target price for the completion of the active impulse wave (C) lying at the intersection of the 2 up channels from June and March.

EURJPY sellstrong resistance above and a lot of failed attempts
drop down expecting below 170.0 level

EURJPYLAST month i called eurjpy long ,and we still holding that buy based on the following context.
EU10Y= 2.602%
EUR INTEREST RATE after governing council decision 25basis point on deposit facility 2% main refinancing operation 2.15% and marginal lending facility 2.40%
JP10Y=1.438%
JPY INTEREST RATE =0.5%
BOND YIELD DIFFERENTAL= EUR-JPY= 1.164 % FAVOUR EUR CARRY TRADE.
INTEREST RATE DIFFERENTIAL= EUR-JPY=1.5 % FAVOUR EUR CARRY TRADE
CARRY TRADERS BORROWED FROM BOJ AND INVESTED IN ECB BOND MARKET.
STRUCTURE OF MARKET=the daily break of supply roof turn to demand floor and EURJPY WENT MOON
