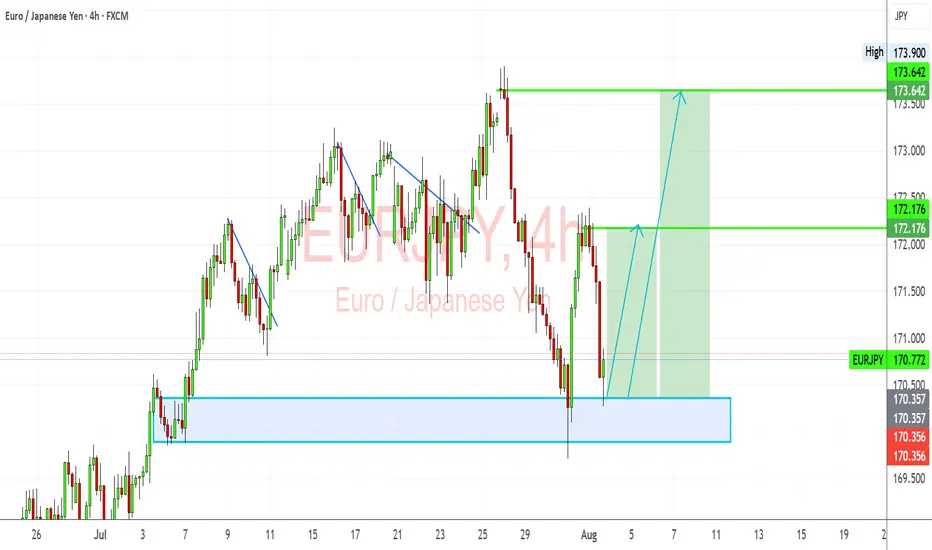
EURJPY: Bullish Rebound from Key Demand ZoneEURJPY has bounced off a critical demand zone and is showing signs of a bullish recovery. Despite the recent pullback, the pair’s structure remains fundamentally and technically bullish, driven by JPY weakness and EUR resilience.
Technical Analysis (4H Chart)
Pattern: Price tested a strong demand zone near 170.35–170.50 and rejected it aggressively.
Current Level: 170.77, starting a potential bullish leg toward higher resistance levels.
Key Support Levels:
170.35 – key demand zone and invalidation level for bulls.
169.90 – deeper support if demand zone breaks.
Resistance Levels:
172.17 – first bullish target and interim resistance.
173.64 – major target if bullish continuation sustains.
Projection: A successful rebound from 170.35 could drive price toward 172.17 initially, then 173.64 if momentum holds.
Fundamental Analysis
Bias: Bullish.
Key Fundamentals:
EUR: ECB’s slower path toward easing supports EUR stability relative to JPY.
JPY: Weakness persists as BoJ maintains dovish bias, though FX intervention risk limits JPY downside speed.
Global Sentiment: Mild risk-on mood supports EUR strength against JPY.
Risks:
BoJ verbal intervention or actual FX intervention could trigger temporary JPY strength.
Sharp reversal in global risk sentiment could weaken EUR/JPY.
Key Events:
ECB speeches and data (CPI, growth updates).
BoJ FX comments and broader market risk appetite.
Leader/Lagger Dynamics
EUR/JPY is a leader among JPY pairs, often moving in sync with GBP/JPY and CHF/JPY. Its movement also tends to precede confirmation in risk-sensitive JPY crosses.
Summary: Bias and Watchpoints
EUR/JPY is bullish from the 170.35 demand zone, with a potential move toward 172.17 and 173.64. Key watchpoints include ECB communication, BoJ stance, and market risk sentiment. As long as 170.35 holds, bulls remain in control.
JPYEUR trade ideas
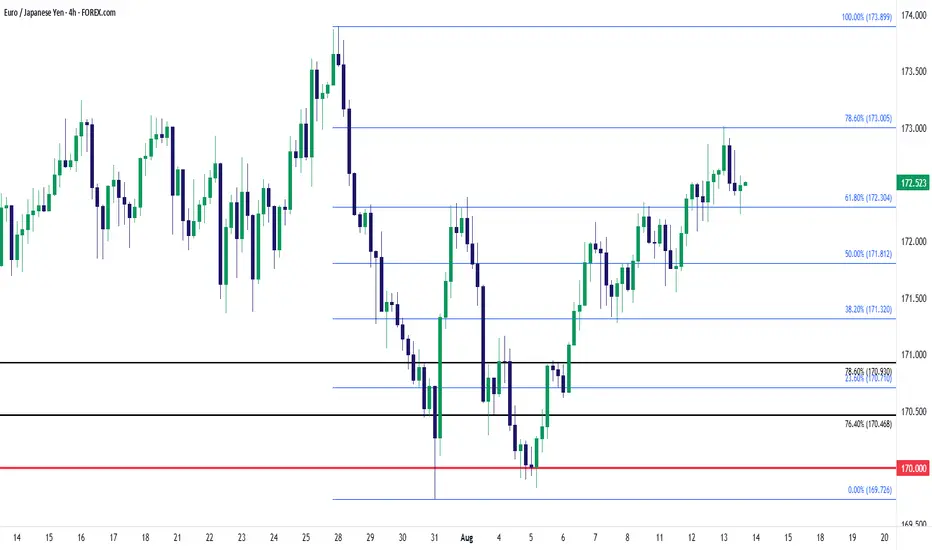
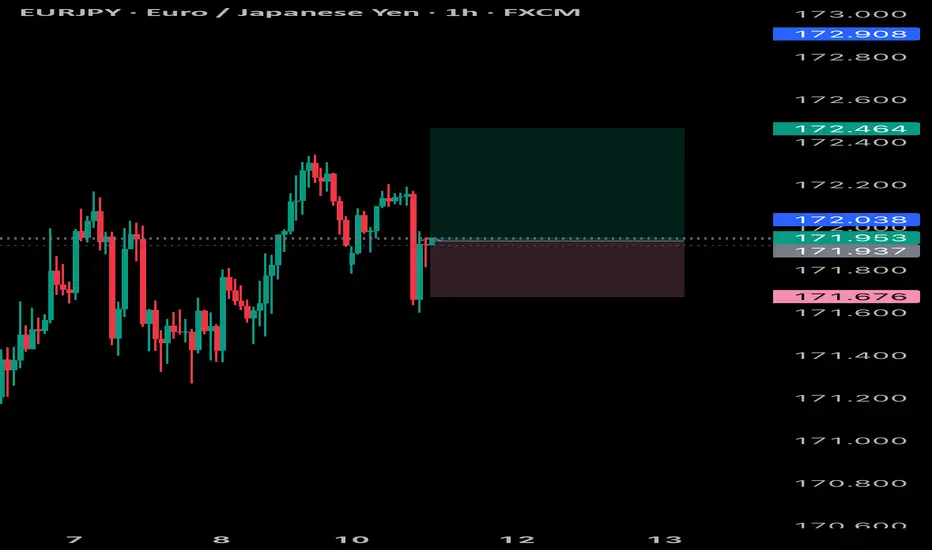
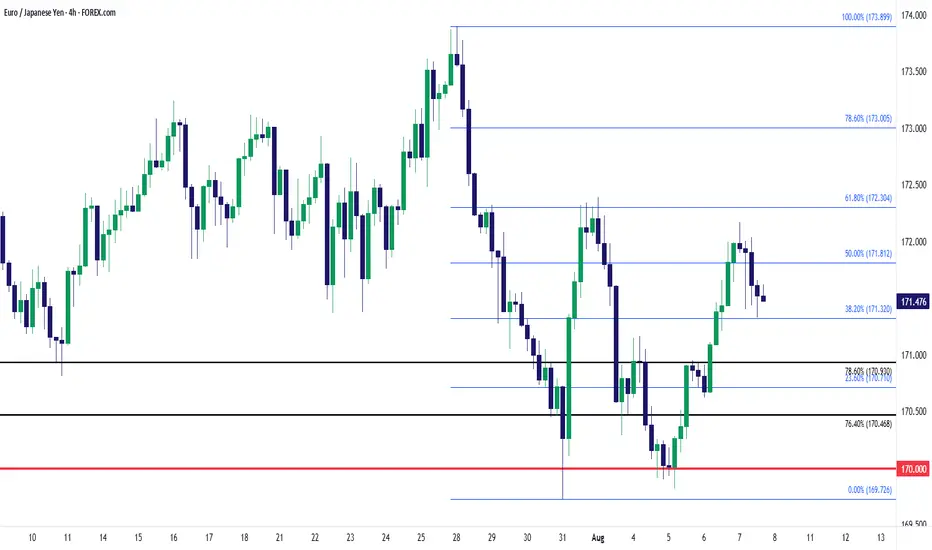
EUR/JPY Climbing the Fibonacci SequenceEUR/JPY continues to recover from the sell-off that was followed by a test and hold of the 170.00 level. So far, there's been very clean structure built along the Fibonacci retracement produced from that prior sell-off.
Most recently it was the 78.6% retracement holding the highs and the 61.8% marker back in as support, after it had previously held as resistance. Next support down plots at the 50% marker and this is what I'm looking at for invalidation of trend, and if that remains respected, the door is open for another run at the highs just inside of the 174.00 handle. - js
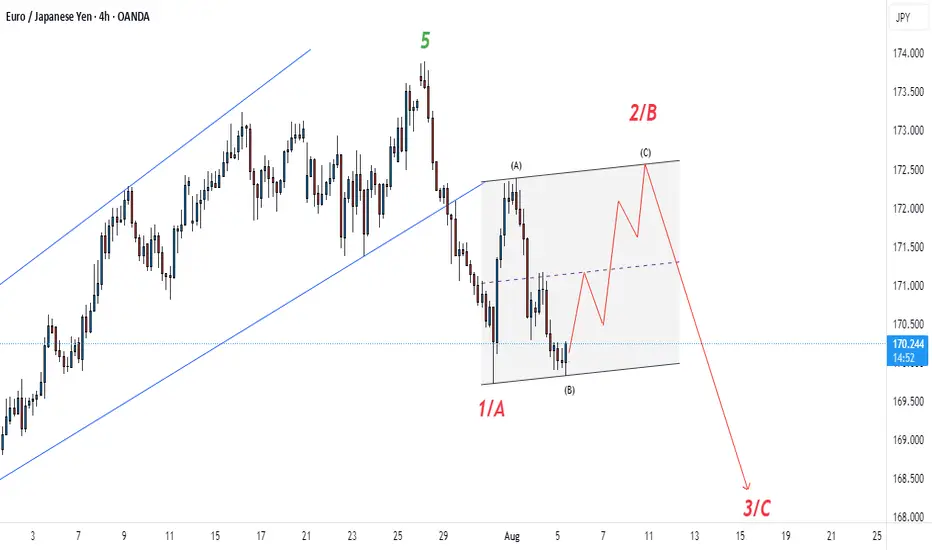
Bulls KnockigDespite the long term downstairs anticipation, we think that we're going for a little pullback, and we think a flat correction is cooking out before we proceed to the downside. Until then, kindly employ your trading strategies and this is strictly not investment advice.
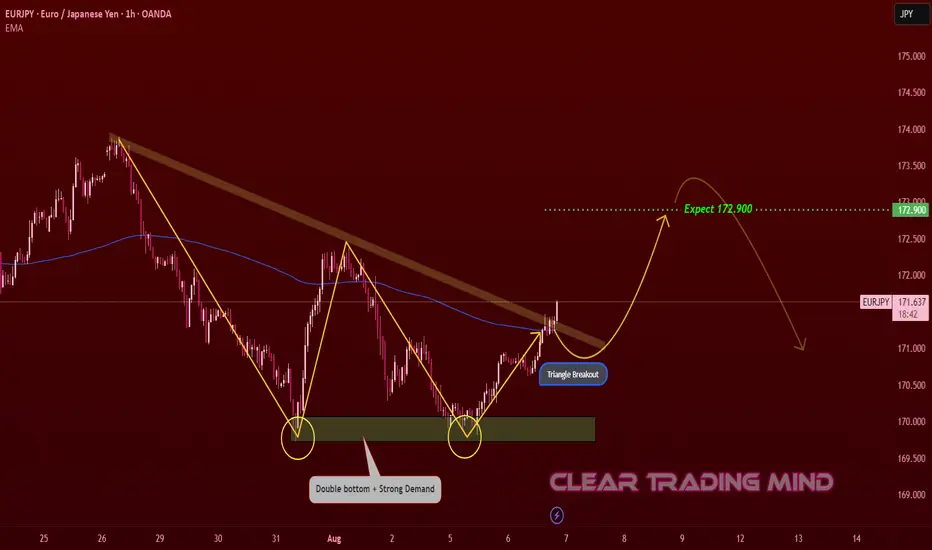
EURJPY Double Bottom + Triangle Breakout | Expecting 172.900 In this time I am going to look a long in this pair because I can see a strong double bottom formation with strong demand area. After touching this demand zone, price bounced back and now making a triangle breakout.
The breakout from the triangle gives more power to the upside move, and I am expecting price to continue bullish till 172.900 level. After reaching this zone, I will wait to see how price reacts for next move.
This is just my view based on pattern and breakout.
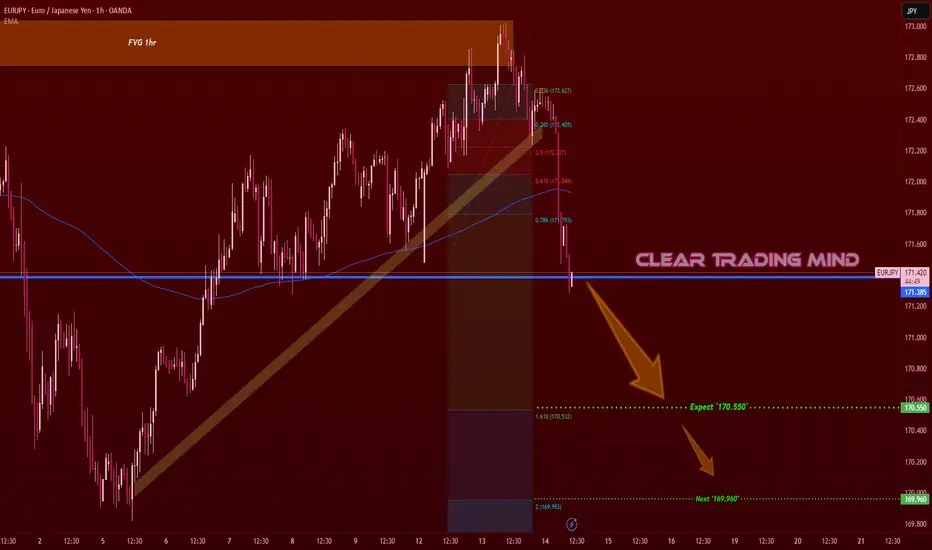
EURJPY – Bearish Break Targets 170.55 & 169.96On the 1H chart, EURJPY has broken below both the trendline support and the 200 EMA, signaling a clear shift in market sentiment toward the bears. The recent drop confirms sellers are in control after price failed to sustain near the FVG zone.
Fib extensions suggest the next downside targets are 170.55 (1.618 Fib) and 169.96 (Fib 2.0). A clean break below these could accelerate momentum toward deeper lows.
📉 Bias – Bearish
📍 Key Resistance – 200 EMA & 172.62 zone
🎯 Target Levels – 170.55 → 169.96
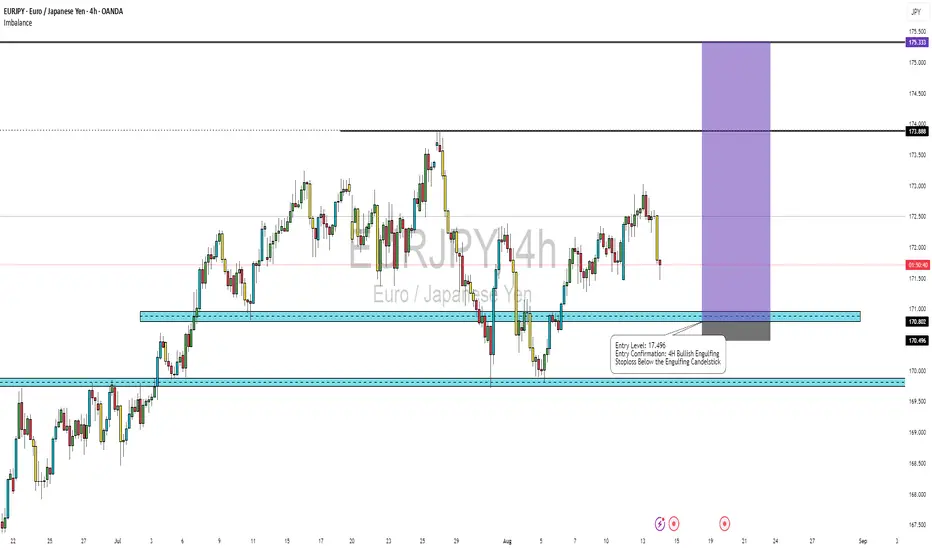
EURJPY – Anticipating a Bullish MoveI’m currently watching EURJPY for a potential upside move based on price action signals.
🔹 Setup Overview
Pair: EURJPY:
Entry Level: 177.496
Entry Confirmation: Bullish Engulfing candle on the 4H timeframe
Stop Loss: Just below the low of the Bullish Engulfing candlestick
📊 Technical Insight
EURJPY has been maintaining a bullish market structure on higher timeframes, with price consistently forming higher highs and higher lows. Recently, price has pulled back to a key support area around 177.496, aligning with a previous structure level and potential demand zone.
I’m waiting for a 4H Bullish Engulfing candle to confirm the buying pressure before entering. This candlestick formation often signals a strong shift in momentum from sellers to buyers, making it a reliable trigger for continuation trades.
🔍 Why This Setup?
Trend Alignment: The daily and weekly charts remain bullish, with strong buying momentum over the past few weeks.
Key Level Reaction: 177.496 coincides with both structural support and a Fibonacci retracement zone, increasing the confluence for a bounce.
Clear Risk Management: Placing the stop loss below the Bullish Engulfing candle low keeps risk defined while giving the trade room to breathe.
🎯 Potential Targets:
TP1: 178.800 (recent swing high)
TP2: 179.900 (psychological resistance)
TP3: 181.200 (extended bullish target)
⚠️ Risk Disclaimer:
This is my personal trading idea based on technical analysis, not financial advice. Always manage risk and follow your own strategy.
EURJPY PROFIT Eurjpy hit take profit and will keep trading and scalping it whether it gives good opportunities
EURJPY SHORTEurjpy has formed a market structure shift as shown on 4 hours. The pair also touched the fair value gap at the same place indicating a reversal. we enter the market at the current rate
EUR/JPY Channel Formation (6.08.2025) The EUR/JPY Pair on the M30 timeframe presents a Potential Selling Opportunity due to a recent Formation of a Channel Pattern. This suggests a shift in momentum towards the downside in the coming hours.
Possible Short Trade:
Entry: Consider Entering A Short Position around Trendline Of The Pattern.
Target Levels:
1st Support – 169.74
2nd Support – 169.25
🎁 Please hit the like button and
🎁 Leave a comment to support for My Post !
Your likes and comments are incredibly motivating and will encourage me to share more analysis with you.
Best Regards, KABHI_TA_TRADING
Thank you.
Disclosure: I am part of Trade Nation's Influencer program and receive a monthly fee for using their TradingView charts in my analysis.

EURYEN EURJPY BUYSEurjpy keeping it simple and straightforward will be buying easily and will be closing partials
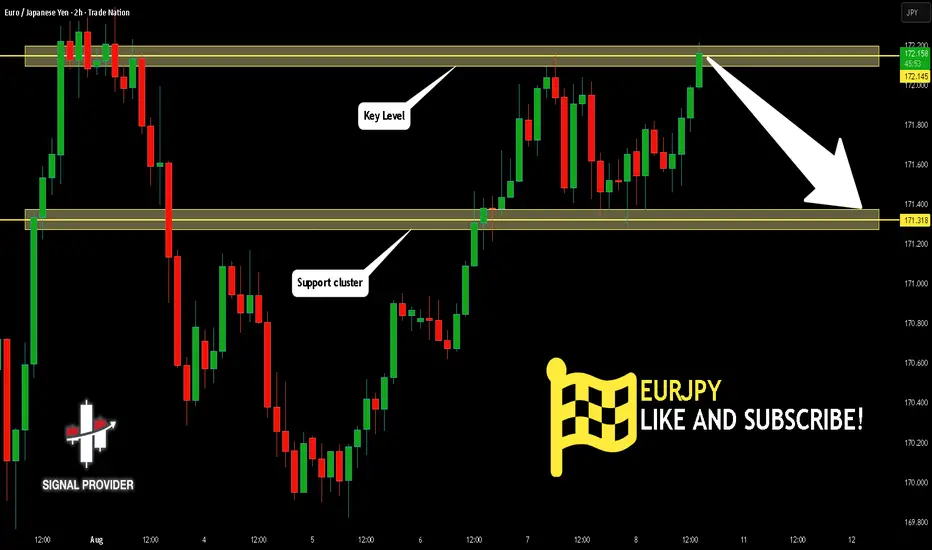
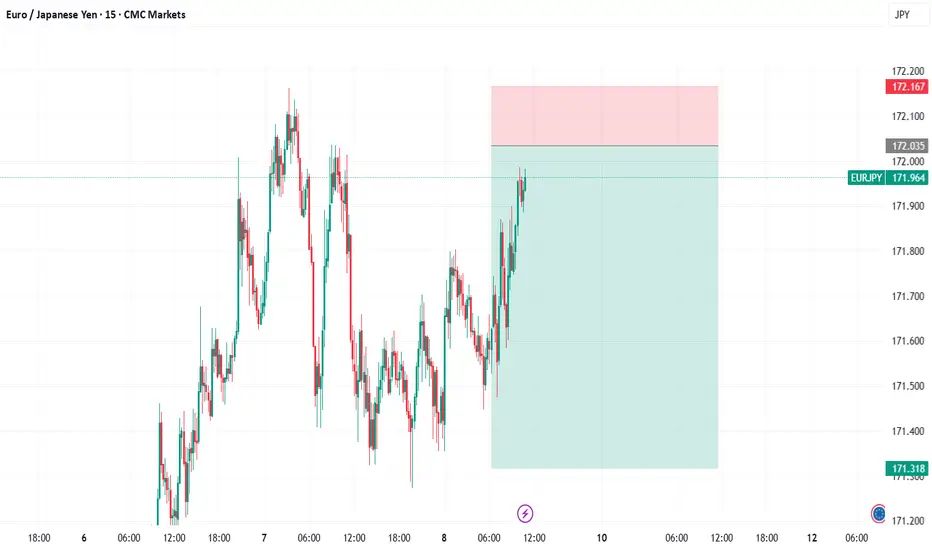
EURJPY Will Go Lower From Resistance! Sell!
Here is our detailed technical review for EURJPY.
Time Frame: 2h
Current Trend: Bearish
Sentiment: Overbought (based on 7-period RSI)
Forecast: Bearish
The market is on a crucial zone of supply 172.145.
The above-mentioned technicals clearly indicate the dominance of sellers on the market. I recommend shorting the instrument, aiming at 171.318 level.
P.S
We determine oversold/overbought condition with RSI indicator.
When it drops below 30 - the market is considered to be oversold.
When it bounces above 70 - the market is considered to be overbought.
Disclosure: I am part of Trade Nation's Influencer program and receive a monthly fee for using their TradingView charts in my analysis.
Like and subscribe and comment my ideas if you enjoy them!
EURJPY: Market Sentiment & Forecast
The recent price action on the EURJPY pair was keeping me on the fence, however, my bias is slowly but surely changing into the bearish one and I think we will see the price go down.
Disclosure: I am part of Trade Nation's Influencer program and receive a monthly fee for using their TradingView charts in my analysis.
❤️ Please, support our work with like & comment! ❤️

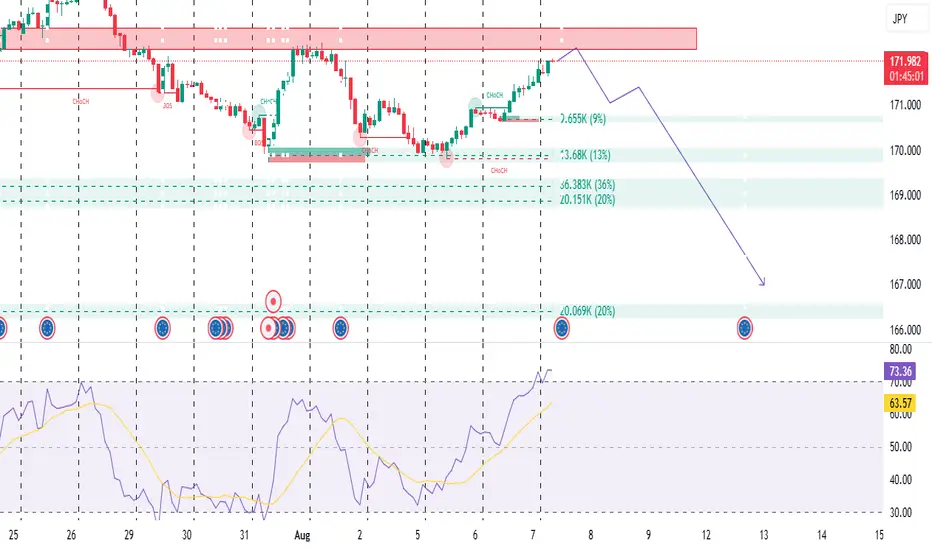
EUR/JPY REVERS AND FALL TO 167.000Price has hit a strong supply zone (resistance)
The market has reached a key supply zone, marked by the red shaded area.
This is where sellers previously entered the market aggressively, causing a sharp drop.
Price revisiting this zone suggests a possible rejection or distribution phase by institutional players, RSI is overbought
The Relative Strength Index (RSI) is currently around 73.21, above the 70 threshold → Overbought.
This indicates bullish momentum may be exhausted, and a potential reversal could happen soon.
If price makes a new high but RSI fails to follow → it may lead to a bearish divergence signal.
Trade idea (based on chart):
Sell Entry: 172.00–172.20
Stop Loss: Above 172.40
Take Profit 1: 170.00
TP 2: 168.00
TP 3: 166.99 (final demand zone).
DO YOU AGREE WITH THIS?
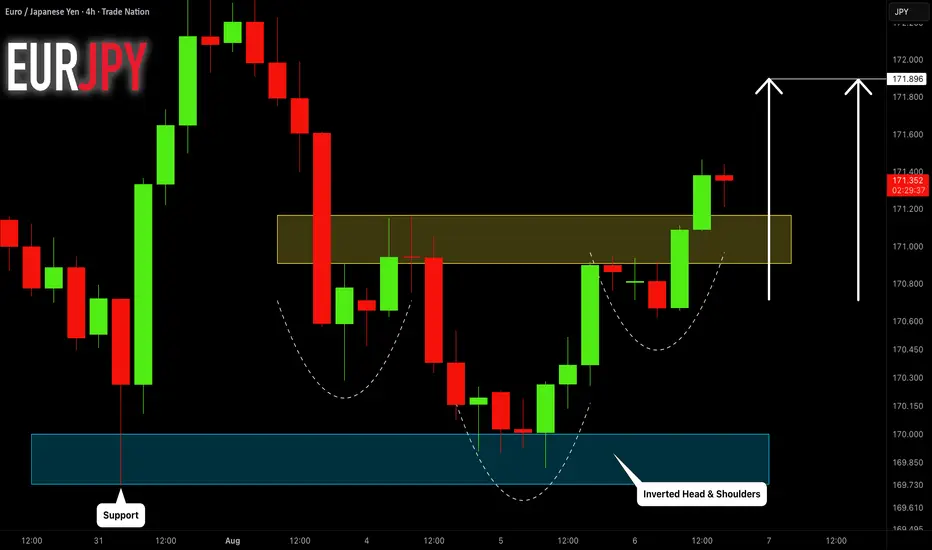
EURJPY: Classic Bullish Pattern 🇪🇺🇯🇵
There is a high chance that EURJPY will continue growing.
A bullish breakout of a neckline of an inverted head & shoulders
pattern leaves clear bullish clues.
Next resistance - 171.9
b]❤️Please, support my work with like, thank you!❤️
I am part of Trade Nation's Influencer program and receive a monthly fee for using their TradingView charts in my analysis.
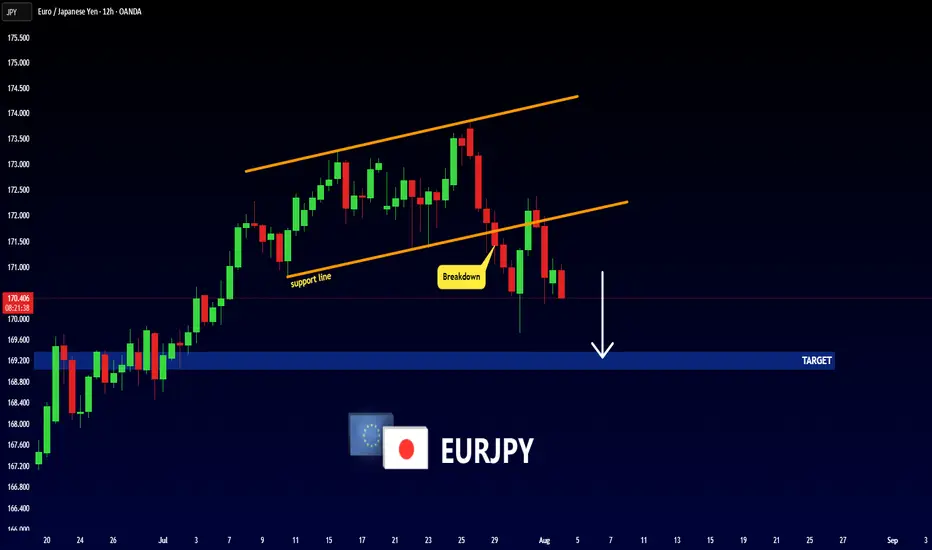
EURJPY - BEARISH MOVE!Hello Traders !
The EURJPY formed an ascending channel.
The price broke the support line!
So, I expect a bearish move📉
_____________
TARGET: 169.365🎯
Sell eurjpy More selling expected
Still valid for sellers
Respecting its weekly supply level
Targat still 161.000

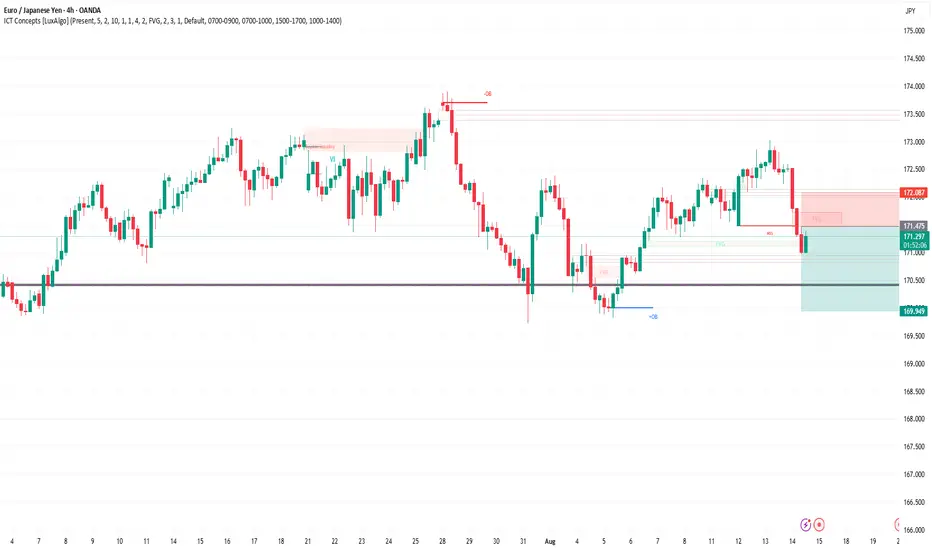
EURJPY: Rejection Block Support Fuels Bullish momentum!Greetings Traders,
In today’s analysis of EURJPY, recent price action confirms the presence of bullish institutional order flow. As a result, we aim to align ourselves with this directional bias by seeking high-probability buying opportunities that target the long-term highs, where a significant liquidity pool resides.
Key Observations:
Weekly Timeframe Insight:
Last week, price retraced into a weekly bullish Fair Value Gap (FVG), which has acted as a strong support zone. This reaction has initiated a bullish response across lower timeframes, validating the weekly FVG as a meaningful area of institutional demand.
H4 Bullish Market Structure Shift:
Following the weekly bounce, the H4 chart presented a clear bullish Market Structure Shift (MSS), signaling the onset of upward momentum. Price then retraced into an extreme discount, where it found support at a well-defined Rejection Block—an institutional array we expect to hold as a launchpad for further bullish continuation.
Trading Plan:
Entry Strategy:
Monitor the Rejection Block zone for bullish confirmation setups on lower timeframes (M15 and below) to validate potential long entries.
Target Objective:
The draw on liquidity remains at higher premium levels, with the liquidity pool above the long-term highs serving as our primary objective.
For a detailed market walkthrough and in-depth execution zones, be sure to watch this week’s Forex Market Breakdown:
As always, exercise patience, wait for confirmation, and maintain strict risk management.
Kind regards,
The Architect 🏛️📈

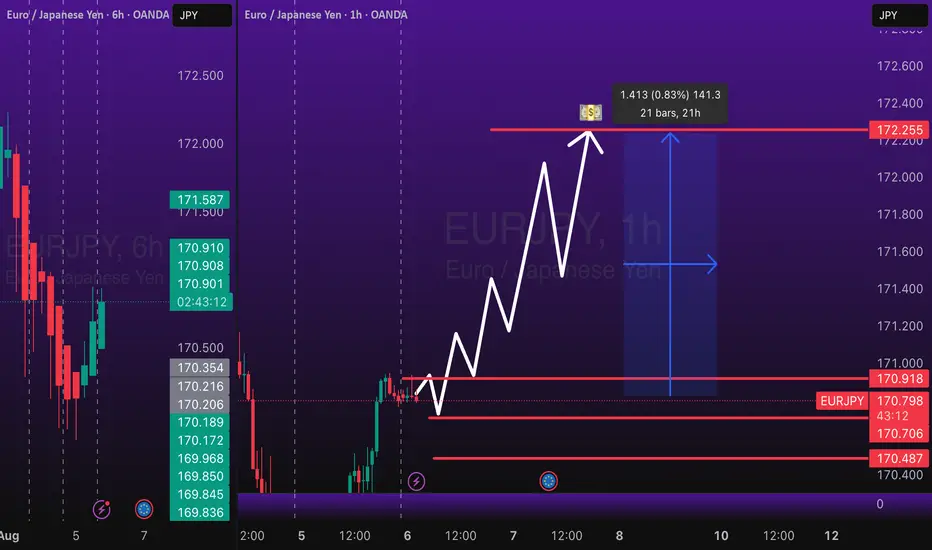
EURJPY to hit 172.250 Market Correction EURJPY Long trade, with my back testing of this strategy, EURJPY will hit 172.250
This is good trade.
Don't overload your risk like Greedy gambler!!!
Be Disciplined Trader, what what you can afford.
Use proper risk management
Looks like good trade.
Lets monitor.
Use proper risk management.
Disclaimer: only idea, not advice
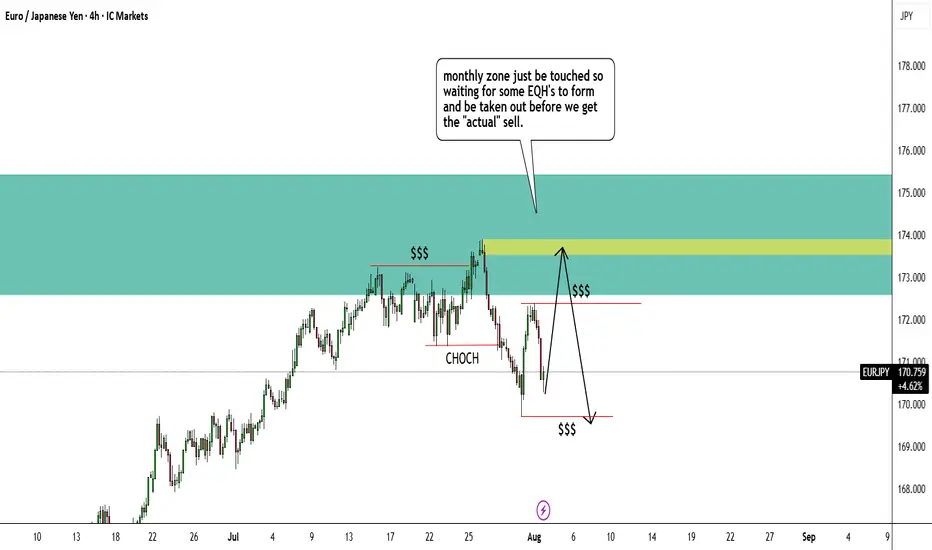
EURJPY shortsHello everyone
I got a EURJPY short trade coming up soon.
Reason being is that price came back to the monthly supply zone (blue)
Price than made a EQH zone which got taken out and created a CHOCH.
Price is now consolidating and has formed EQL and EQH but i believe price will break EQH first to come back to 4hr supply zone (yellow).
Some news is also coming out as well which could influence price as well
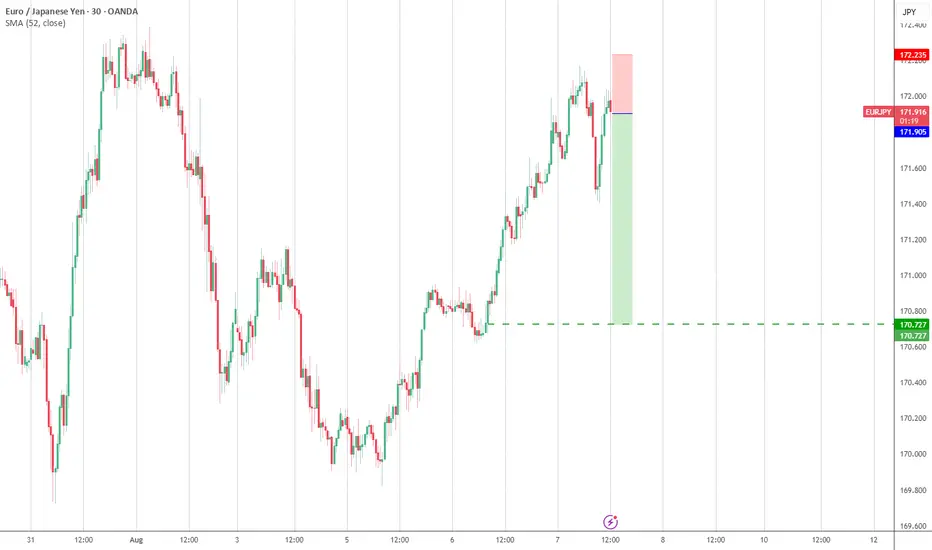
EUR/JPY Rally From 170 - Can Bulls Get the Higher-High?Recovery week so far in EUR/JPY. Last week saw price plunge down for a test of the 170 handle and that played right around the BoJ rate decision. The response to that, however, was clearly Yen-weakness as EUR/JPY jumped up to the 61.8% Fibonacci retracement of the prior sell-off.
More interesting, however, was how the pair was hammered around and just after the Friday NFP report.
That EUR/JPY weakness held through the weekly open, but it was again the 170.00 level that bulls came in to defend, and since then, buyers have been pushing a bullish sequence via short-term price action and the door remains open for continuation.
The next big test is that 61.8% retracement that held the bounce last week. That plots at 172.30 and above that is the 172.50 psychological level, so that resistance can be approached as a zone. If bulls can chew through that the recovery takes on another level of attraction and the door opens wider for a run up to 173.00 after which the 173.90 prior high is exposed as next resistance. - js
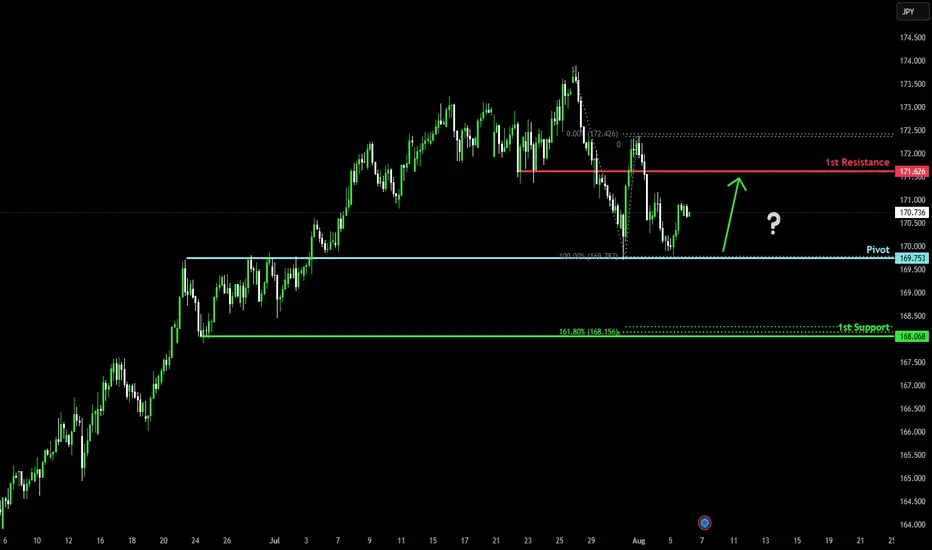
Bullish bounce off?EUR/JPY has bounced off the pivot which has been identified as an overlap support and could rise to the 1st resistance.
Pivot: 169.75
1st Support: 168.06
1st Resistance: 171.62
Risk Warning:
Trading Forex and CFDs carries a high level of risk to your capital and you should only trade with money you can afford to lose. Trading Forex and CFDs may not be suitable for all investors, so please ensure that you fully understand the risks involved and seek independent advice if necessary.
Disclaimer:
The above opinions given constitute general market commentary, and do not constitute the opinion or advice of IC Markets or any form of personal or investment advice.
Any opinions, news, research, analyses, prices, other information, or links to third-party sites contained on this website are provided on an "as-is" basis, are intended only to be informative, is not an advice nor a recommendation, nor research, or a record of our trading prices, or an offer of, or solicitation for a transaction in any financial instrument and thus should not be treated as such. The information provided does not involve any specific investment objectives, financial situation and needs of any specific person who may receive it. Please be aware, that past performance is not a reliable indicator of future performance and/or results. Past Performance or Forward-looking scenarios based upon the reasonable beliefs of the third-party provider are not a guarantee of future performance. Actual results may differ materially from those anticipated in forward-looking or past performance statements. IC Markets makes no representation or warranty and assumes no liability as to the accuracy or completeness of the information provided, nor any loss arising from any investment based on a recommendation, forecast or any information supplied by any third-party.