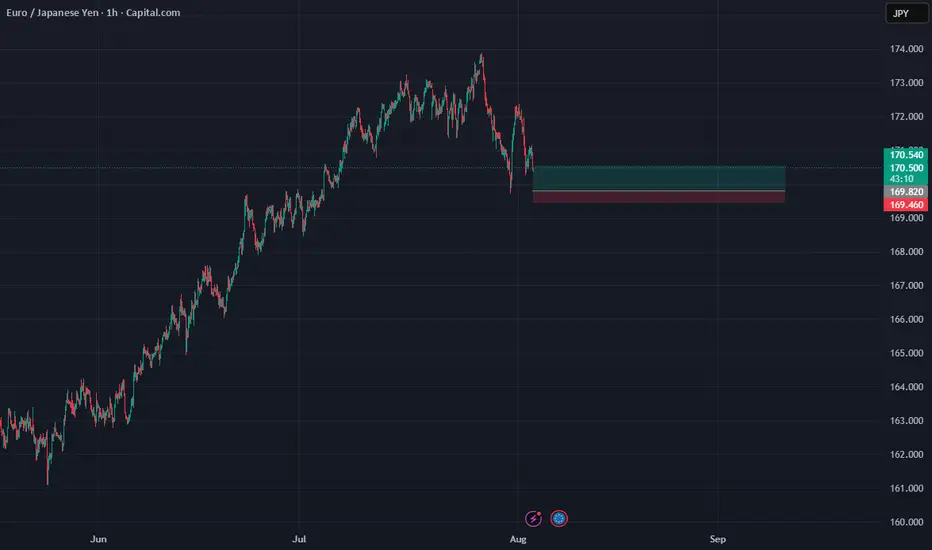
EUR/JPY 170.00 TestEUR/JPY was a high-flyer into late-July as the pair put in a very rare test above the 170.00 level. That price was almost in play back in 2007 and 2008, but ultimately the pair held about five pips below the big figure before plummeting on the back of the financial collapse.
Sixteen years later EUR/JPY was finally able to mount above 170, albeit temporarily, as price climbed above last summer until the massive reversal developed in July, sending prices spiraling all the way down to support around 155.00.
More recently, as Yen-weakness returned in the latter portion of Q2, combined with Euro strength as EUR/USD climbed to three-year-highs, EUR/JPY once again was able to push above the 170.00 handle.
Last week saw a bearish engulfing candlestick develop on Monday, and given the overbought backdrop at the time, the door quickly opened for bears. But since then, buyers have put up a stand around that same 170.00 level with an assist from last week's BoJ meeting.
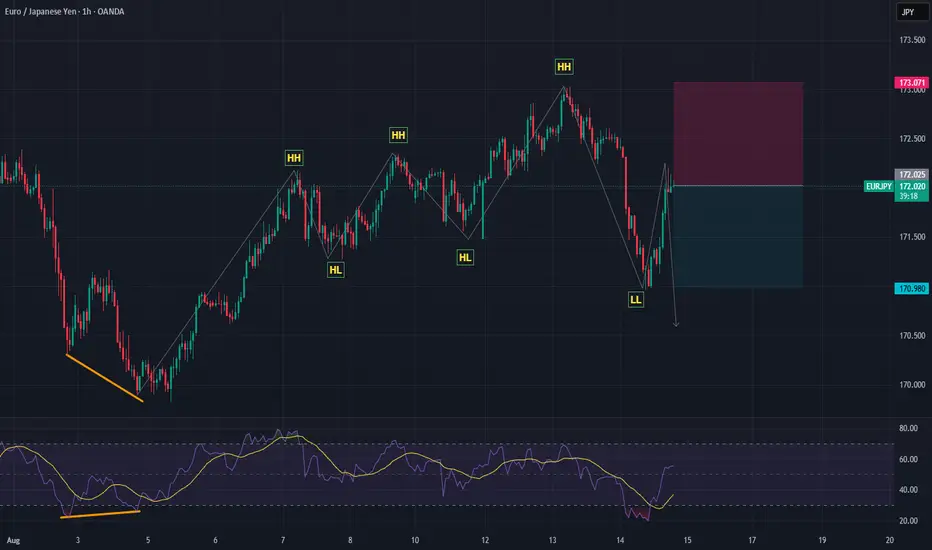
At this point there's been a hold of higher-lows with the 170.00 psychological level coming into play to hold support. This keeps the door open for bullish continuation and the Fibonacci retracement produced by last week's pullback remains of interest with a few important levels of note. The 172.30 area is the spot for bulls to beat, as this would mark a higher-high and that would then open the door for a re-visit of 173.00 and if bulls can muster that, there's the potential for more as it'll look like a move of broader trend continuation. - js
JPYEUR trade ideas
EUR/JPY – 4H Technical and Fundamental AnalysisEUR/JPY – 4H Technical and Fundamental Analysis
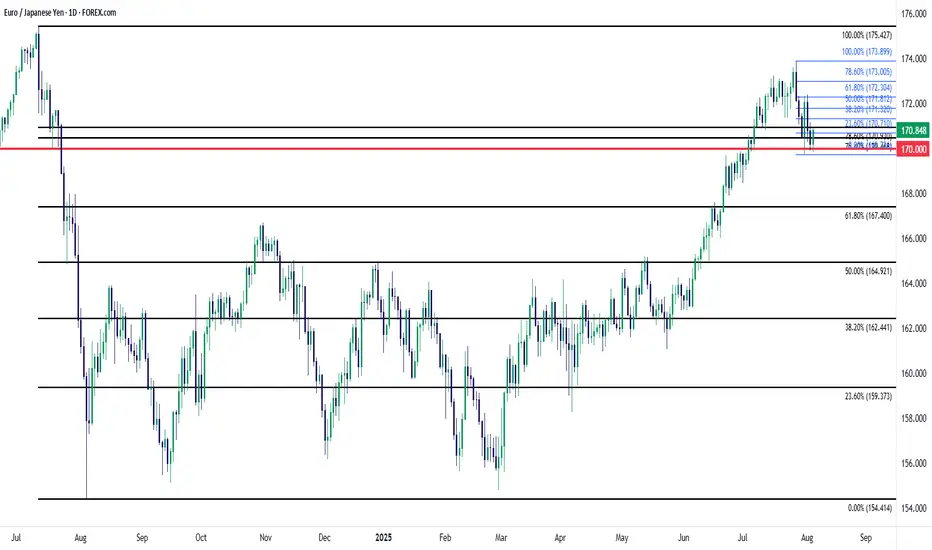
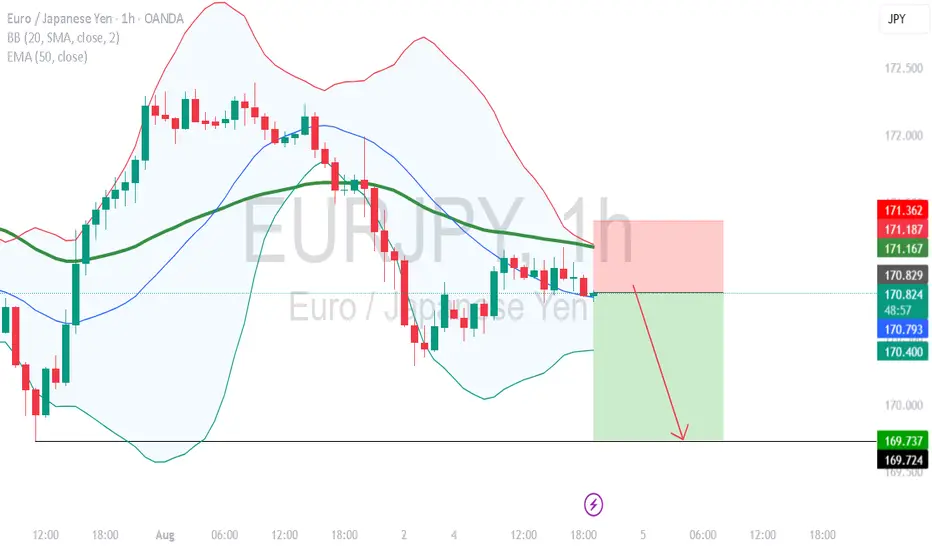
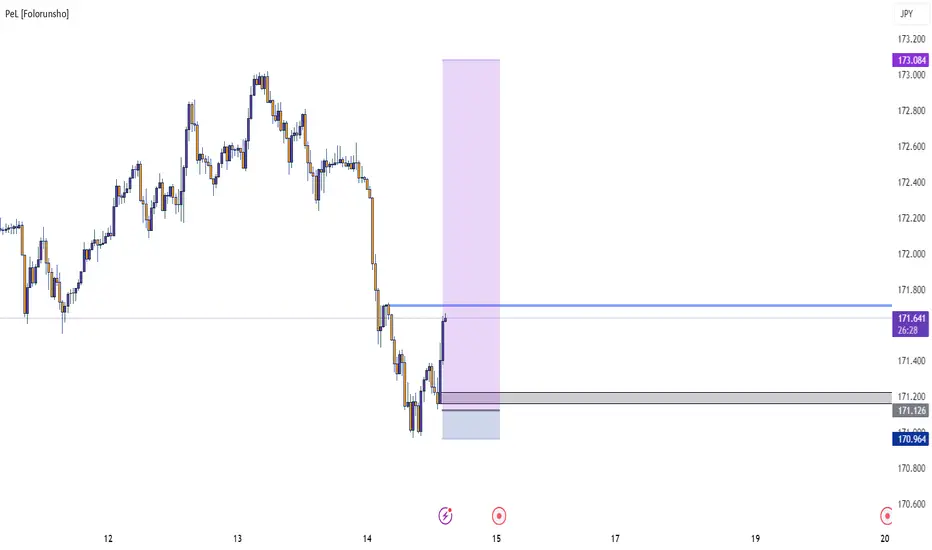
EUR/JPY recently pulled back after briefly touching a year-to-date high near 173.25. The pair has since traded within a tight corrective range between 170.00 and 172.30, indicating exhaustion near key resistance zones. Price has now broken below a minor support level—suggesting a potential Change of Character (ChoCh) and the beginning of an accumulation phase. This movement likely triggered liquidity hunts, sweeping stop-losses before dropping lower to re-establish downside momentum.
We are now monitoring for additional liquidity hunts within our identified zones before committing to a bearish continuation setup. The break of structure and recent liquidity grabs are strengthening the case for more downside pressure.
Fundamentals backed the move too:
🚨 Negative sentiment rose after headlines tied to weakening Eurozone economic data—particularly Germany’s recent PMI miss and cautious ECB commentary hinting at slower recovery prospects.
Meanwhile, the Japanese yen remains stable, supported by safe-haven flows amid geopolitical tensions and a broadly weaker Euro outlook.
📍 Sell Setup
Entry: Sell Stop at 170.730
Stop Loss: 171.940
Take Profit: 168.060
📌 Disclaimer:
This is not financial advice. Always wait for proper confirmation before executing trades. Manage risk wisely and trade what you see—not what you feel.

EURJPY Will Go Down From Resistance! Short!
Please, check our technical outlook for EURJPY.
Time Frame: 12h
Current Trend: Bearish
Sentiment: Overbought (based on 7-period RSI)
Forecast: Bearish
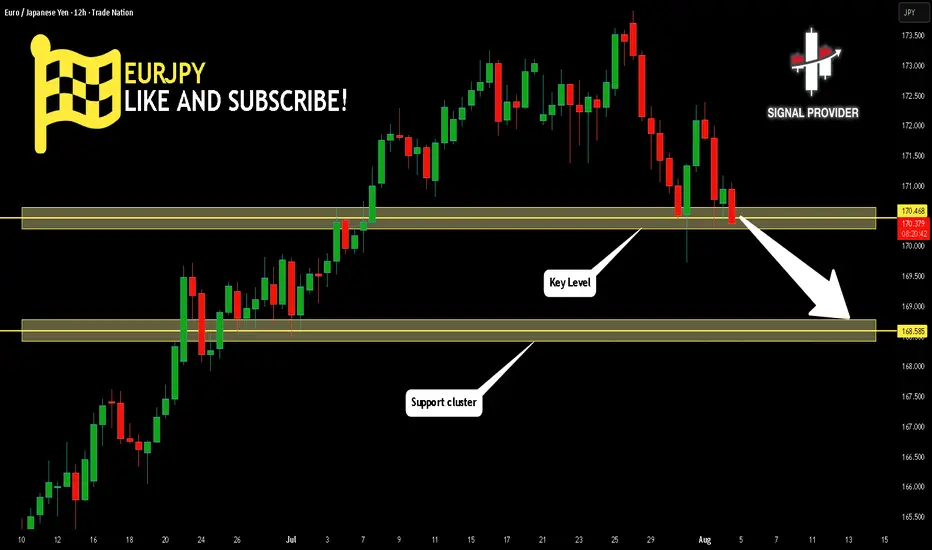
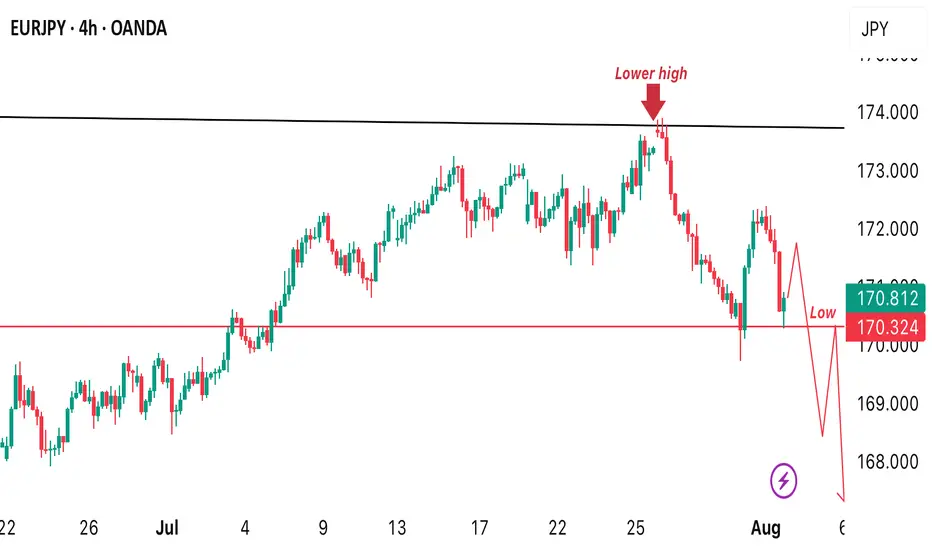
The market is approaching a significant resistance area 170.468.
Due to the fact that we see a positive bearish reaction from the underlined area, I strongly believe that sellers will manage to push the price all the way down to 168.585 level.
P.S
Overbought describes a period of time where there has been a significant and consistent upward move in price over a period of time without much pullback.
Disclosure: I am part of Trade Nation's Influencer program and receive a monthly fee for using their TradingView charts in my analysis.
Like and subscribe and comment my ideas if you enjoy them!
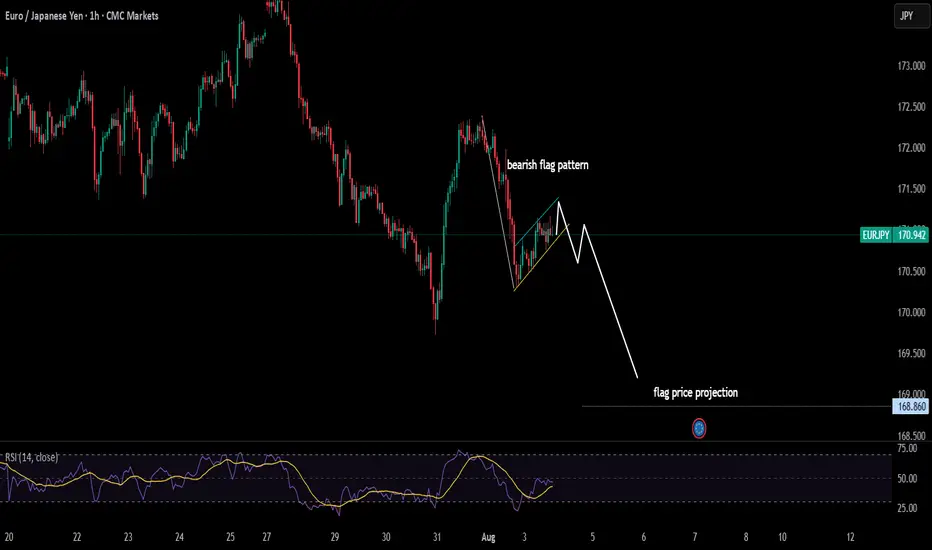
EURJPY in bearish trendwith no major sign of reversal trend is bearish, and with a bearish flag pattern, it has added another confluence of the continuity of its current trend trade can be taken when the price breaks the lower trendline of flag
ENTRY EURJPYDisclaimer:
This is merely a chart-based analytical trading idea and is not considered investment advice. Please manage your risks carefully and conduct your own research before making any trading decisions.
EUR_JPY SUPPORT AHEA|LONG|
✅EUR_JPY is going down now
But a strong support level is ahead at 169.757
Thus I am expecting a rebound
And a move up towards the target of 170.400
LONG🚀
✅Like and subscribe to never miss a new idea!✅
Disclosure: I am part of Trade Nation's Influencer program and receive a monthly fee for using their TradingView charts in my analysis.

EURJPY POTENTIAL SELL OPPORTUNITY-H1 timeframe!Price is set for a sell from the current market price! Technically, we can identify the already existing bear trend. Couple of hours ago, we saw price rejection around 171.162 that rejection could be a H1 lower high which potentially means price might drop back to the low. Therefore, a sell opportunity is envisaged from the current price

EURJPY bearish continuationFriday gave a very strong bearish candle.
Asian session and Europe session observed a pullback with sideway movement.
I'm expecting bearish continuation during US session.
calculate your own risk & reward.
Good luck
EURJPY 4hour TF - August 3rd,2025🟦 EURJPY 4H Analysis Bearish Idea
📅 August 3, 2025
🔹 Top-Down Trend Bias:
• Monthly – Bullish
• Weekly – Bullish
• Daily – Bullish
• 4H – Bearish
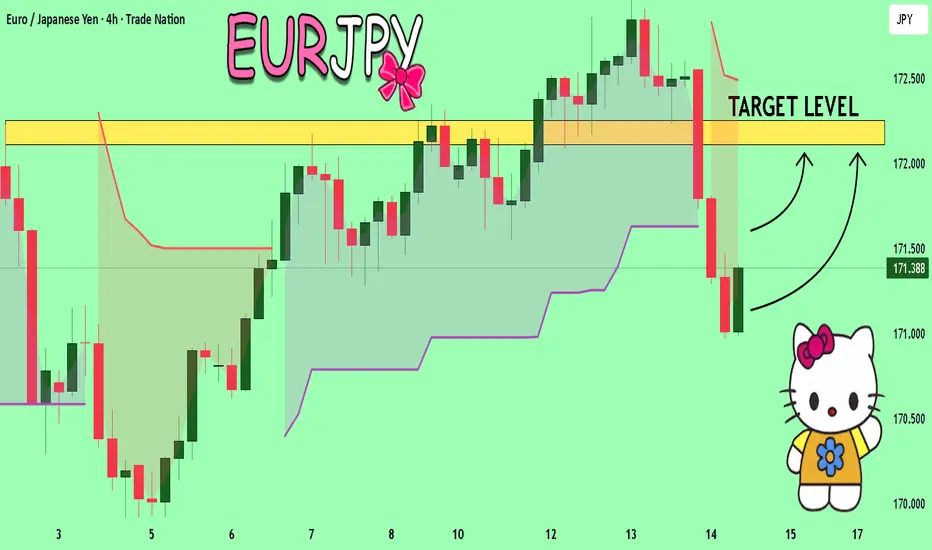
EURJPY has pulled back through the previous support zone around 171.000 and is currently consolidating after a sharp bearish move. Short term trend remains bearish, but higher timeframes suggest this may be a corrective phase.
🔍 Key Zone: 171.00 – 171.70
This zone represents the 38.2% fib retracement and prior structure. A rejection from this area could trigger further downside, while a break above may confirm a higher low.
✅ Scenario A: Bearish Continuation (Blue Path)
1.If price taps into 171.00–171.70 and rejects
2.Look for bearish confirmation (rejection wick, bearish engulfing, BOS)
Target: 169.60 (key support)
This setup follows short term momentum and offers clean R:R into prior liquidity.
⚠️ Scenario B: Bullish Break & Hold (Orange Path)
1.If price breaks and closes above 172.250
2.Watch for continuation toward 173.750, our extended fib target
3.Structure shift + bullish PA would align with HTF bullish trend
This would confirm strength returning to the pair, ideal for HTF trend continuation traders.
🧠 Final Notes
• 171.00–171.70 is the reaction zone to watch
• HTFs remain bullish, but 4H momentum must flip to validate upside
• Let price confirm direction

EURJPY POSSIBLE SELL OPPORTUNITYFrom the H4 timeframe we’re looking at a possible sell opportunity on this pair once we get a break to the downside.( that’s further bearish momentum) we’d open short positions on this asset.
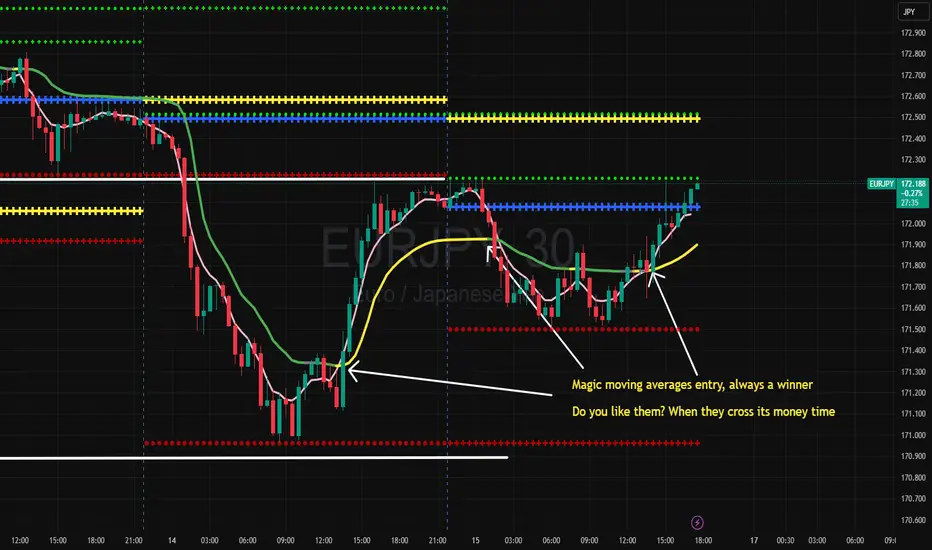
Moving average crossinng entryThis strategy is based on a unique combination of two moving averages crossing each. Every time this happens, i enter with 100 % confidence that my trade is a highly profitable one.
Look at these entries i took recently.
PROFIT ON EURJPYEurjpy I’m a beautiful up trend now can be the best time to take partials of profit and move ( adjust ) SL to BE, if looking to swing
EurjpyIts buying
But currently the Supply on m5 is holding the buy move possible to go back to demand and move from there
EURJPY BUYING Eurjpy has been moving great lately and now can expect it to keep it’s structure and head to the up side , will be scalping it and taking partials
EURJPY Massive Long! BUY!
My dear friends,
Please, find my technical outlook for EURJPY below:
The price is coiling around a solid key level - 171.15
Bias - Bullish
Technical Indicators: Pivot Points Low anticipates a potential price reversal.
Super trend shows a clear buy, giving a perfect indicators' convergence.
Goal - 172.11
About Used Indicators:
The pivot point itself is simply the average of the high, low and closing prices from the previous trading day.
Disclosure: I am part of Trade Nation's Influencer program and receive a monthly fee for using their TradingView charts in my analysis.
———————————
WISH YOU ALL LUCK
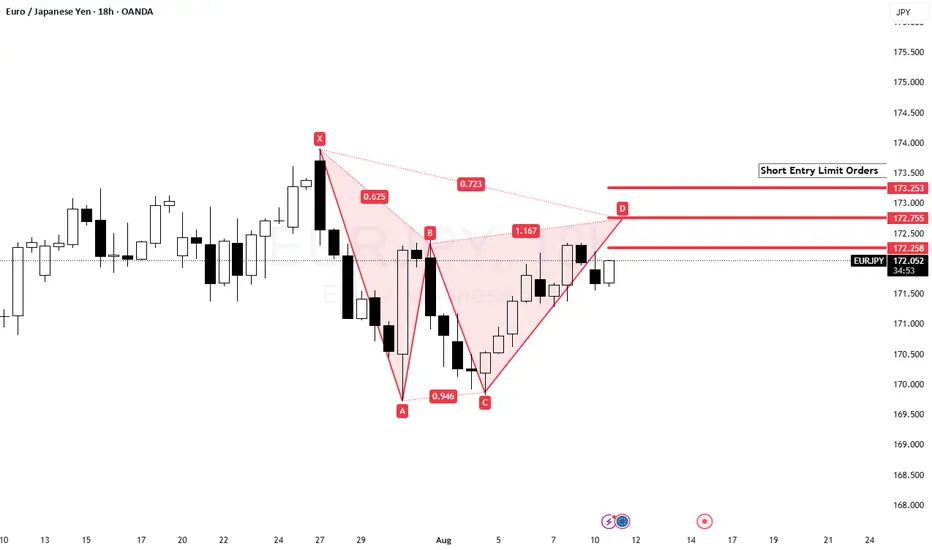
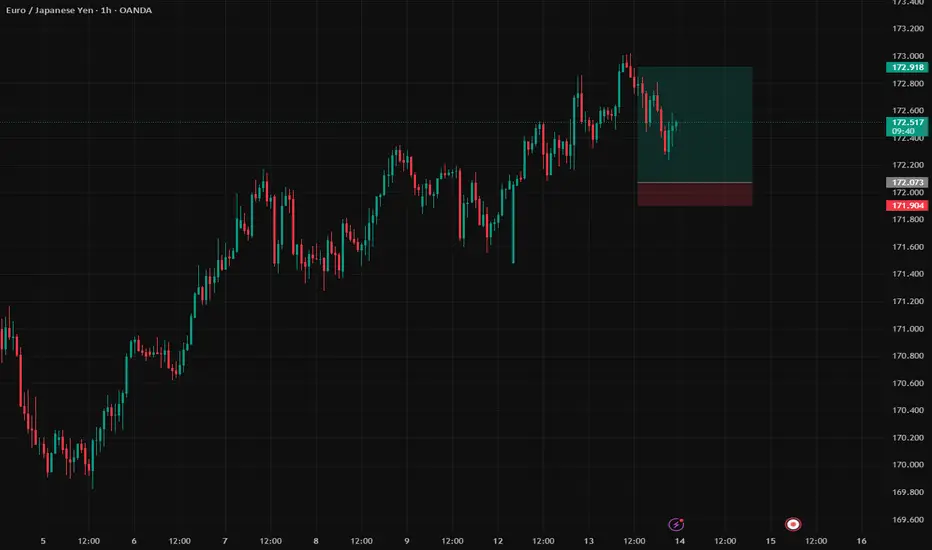
EUR/JPY Bearish BatA Bearish Bat is forming on the EUR/JPY custom timeframe chart (18hr). I'm expecting price to push through 172.00 and possibly through 173.00 before reversing. I've put in a few limit orders. If price sharply reverses I'm just going to short the market.
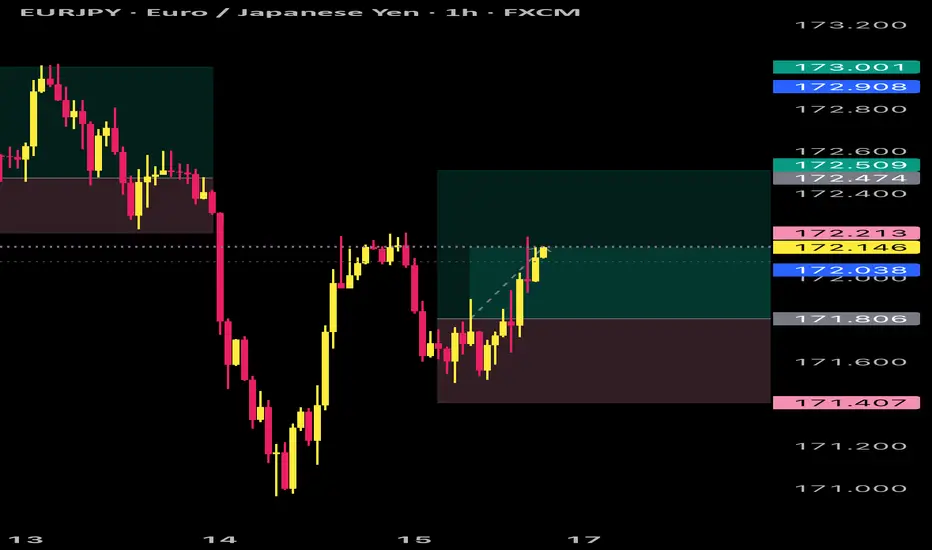
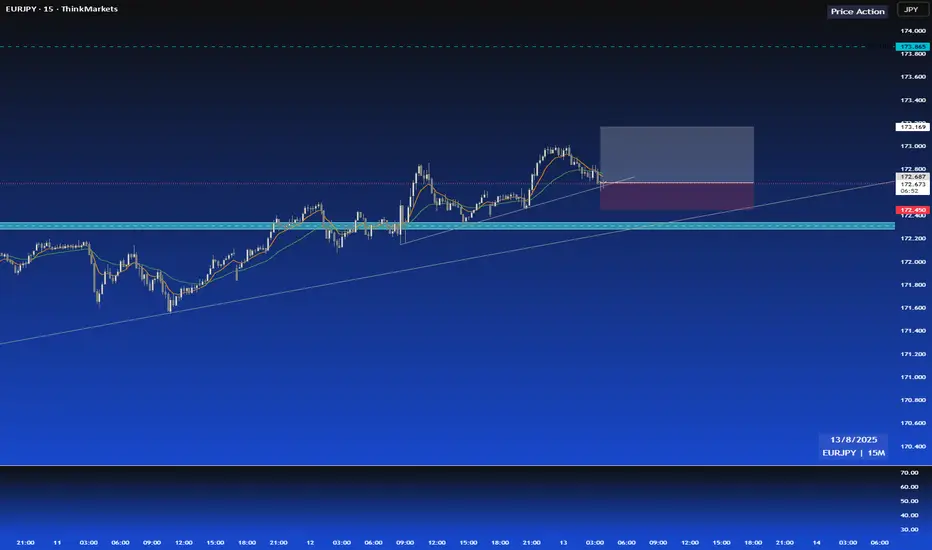
EJ Trade Idea – Risking 1% for Potential 5% Gain 13/8/2025I trade with a fixed 1:5 risk–reward ratio, focusing on setups that offer asymmetric profit potential. My approach emphasizes precise entries, strict risk management, and the patience to let trades reach their full potential.
This method allows me to risk small while aiming for meaningful gains, keeping my results consistent and sustainable over time. Trading, for me, is as much about mindset as it is about method — staying calm, following the plan, and letting probabilities work in my favor.
Disclaimer: This is purely an idea shared for educational purposes. I take no responsibility for any financial decisions you make. Please assess it carefully and adapt it to your own trading plan before acting.
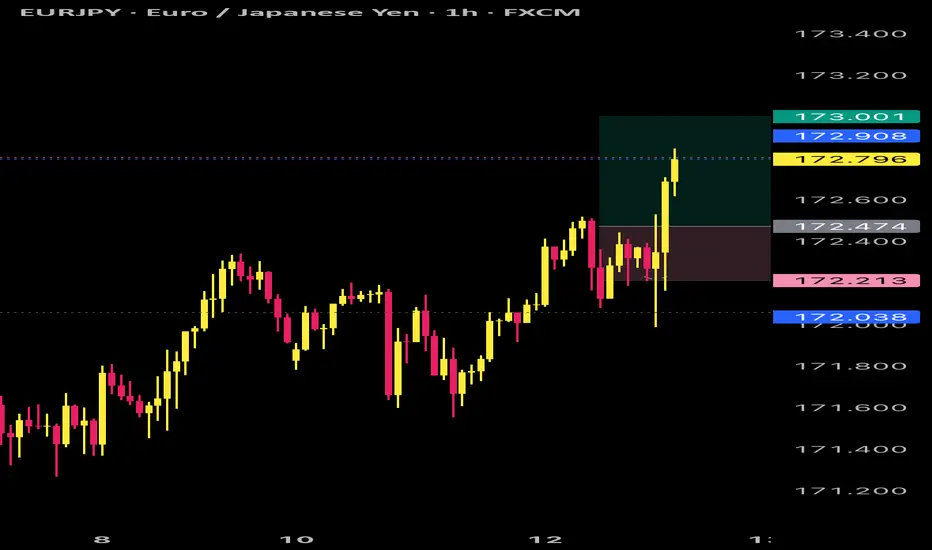
EURJPY short term Resistance bullish breakoutEURJPY just broke 4h resistance entered a long setup at 15m entry for a 2rr target. Annotations on chart. Pretty self explanatory.
Let me know your thoughts.
EURJPY PROFIT Eurjpy performed well and has mashed all take profits and unlocked a new price level will be looking to hold a bit more longer
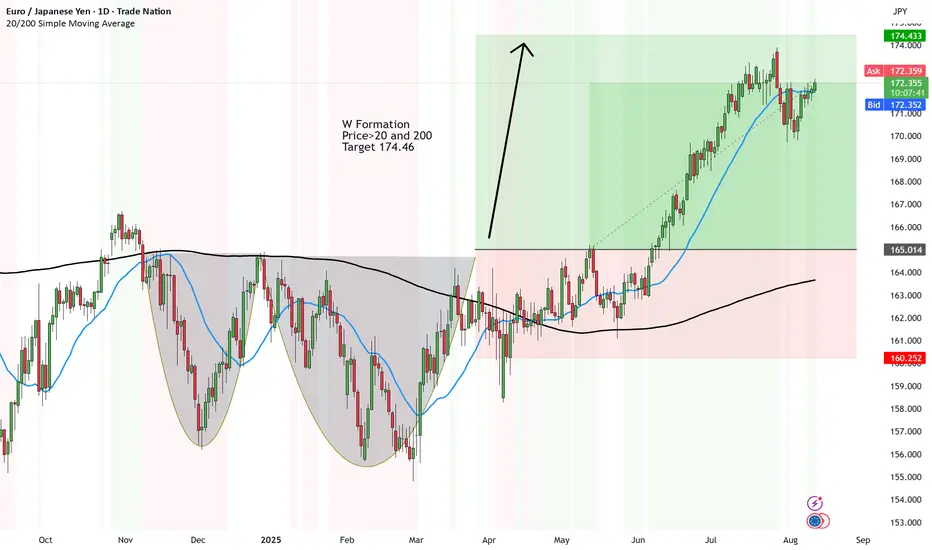
EUR/JPY - target almost reached at 174.46 - But is it worth it?W Formation formed tick.
Price>20 and 200 - Tick
Target 174.46
Stop loss - not hit - TICK
All easy and said and done.
BUt the analysis was done in April. It is August.
We take on daily interest charges.
Opportunity costs.
So are these LONG term trades good in the long run? Maybe with LARGE portfolios then it's all relative and the costs are the price to pay.
But for smaller portfolios that most people have - it's not worth it.
Prioritise with your trading risk management and profile. And if need be, implement a TIME STOP LOSS to avoid long winded holding trades that turn into unnecessary marriages.
Disclosure: I am part of Trade Nation's Influencer program and receive a monthly fee for using their TradingView charts in my analysis.