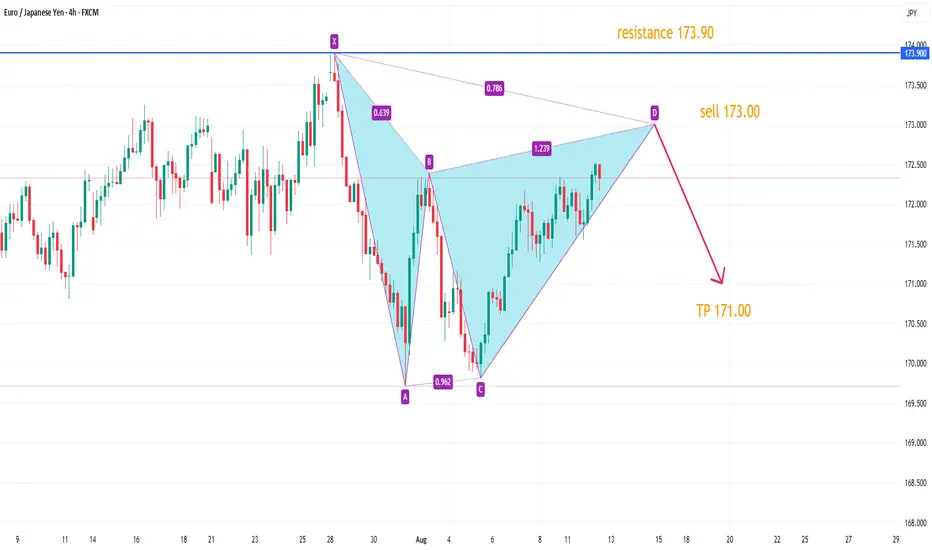
EURJPY SELL 173.00(Gartley)On the daily chart, EURJPY has the opportunity to form a bearish Gartley pattern. Currently, you can pay attention to short opportunities around 173.00, and the downside target is around 171.00.
JPYEUR trade ideas
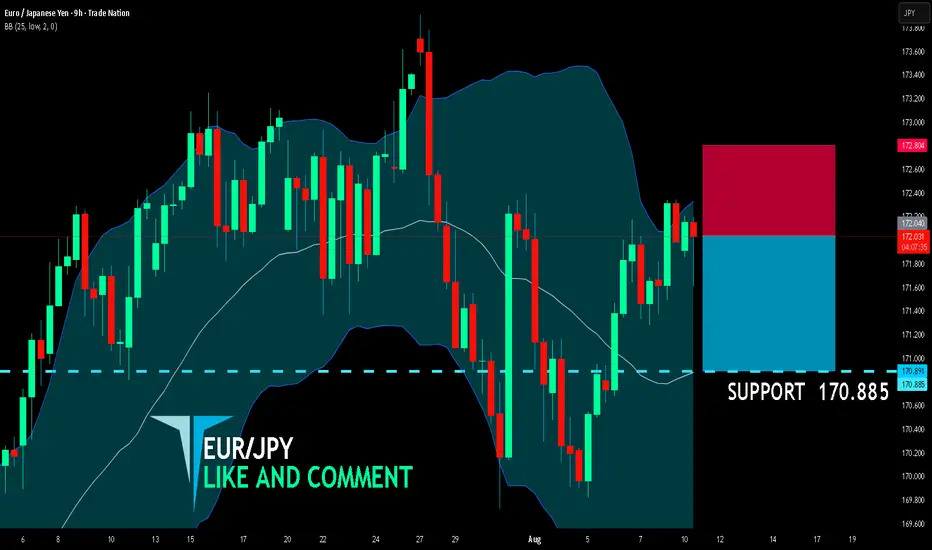
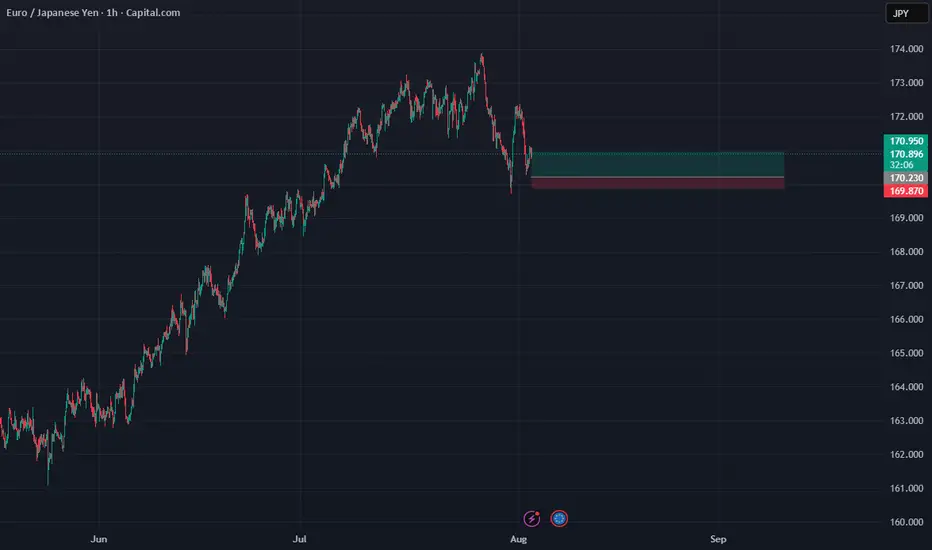
EUR/JPY BEARS WILL DOMINATE THE MARKET|SHORT
EUR/JPY SIGNAL
Trade Direction: short
Entry Level: 172.040
Target Level: 170.885
Stop Loss: 172.804
RISK PROFILE
Risk level: medium
Suggested risk: 1%
Timeframe: 9h
Disclosure: I am part of Trade Nation's Influencer program and receive a monthly fee for using their TradingView charts in my analysis.
✅LIKE AND COMMENT MY IDEAS✅
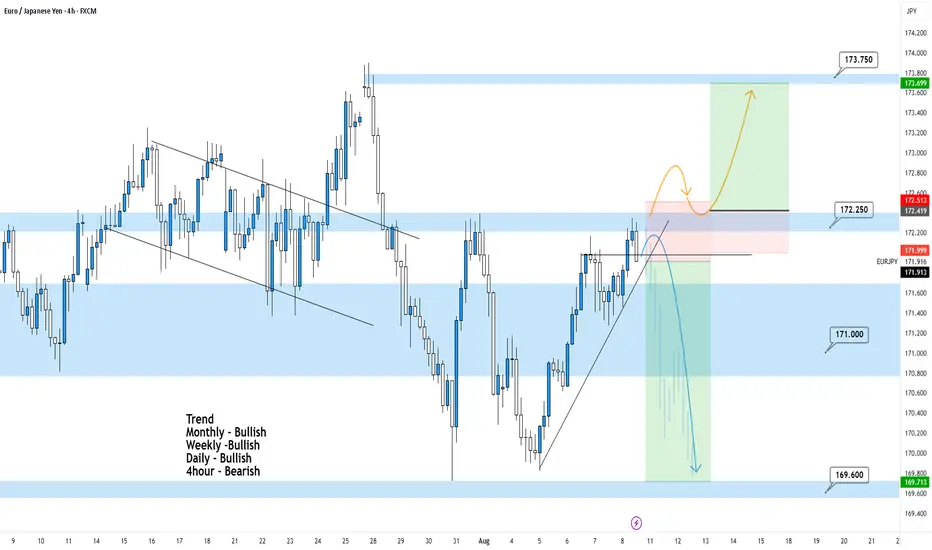
EURJPY 4Hour TF - August 10th, 2025🟦 EURJPY 4H Analysis
📅 August 10, 2025
Top-Down Trend Bias:
• Monthly – Bullish
• Weekly – Bullish
• Daily – Bullish
• 4H – Bearish
EURJPY is approaching the 172.25 resistance zone after a strong bullish correction. While higher timeframes remain bullish, the 4H structure is still technically in a retracement phase, making this a critical reaction level.
🔍 Key Zone: 172.50
This area marks prior structure and could serve as either a breakout base for further upside or a strong rejection point for sellers.
✅ Scenario A: Bullish Breakout (Orange Path)
1.If price breaks and closes above 172.50
2.Expect continuation toward 173.75 resistance zone
This would align with the overall bullish HTF bias
⚠️ Scenario B: Bearish Rejection (Blue Path)
1.If price rejects from 172.250
2.Look for bearish confirmation (rejection wicks, engulfing, LTF BOS)
Target 1: 171.00
Target 2: 169.60 support
This would maintain the short term 4H bearish structure while still sitting inside a bullish macro trend.
🧠 Final Notes
• 172.250 is the key decision point, watch for clear confirmation
• HTFs favor upside, but short term traders may find better R:R on a rejection
• Always trade the reaction, not the assumption
EURJPY BUYS BLUEThis pair has responded positively to the analysis of the recent post and it has now hit take profit perfectly with minimum drawdown

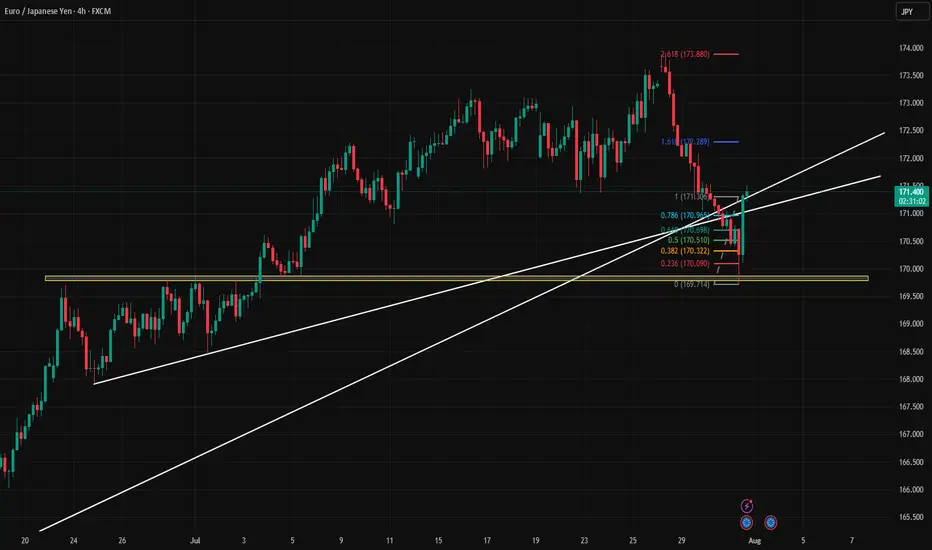
Long EJEJ showed false break the trendline with nice rejection, fulfills my criteria to go long with fibo. Anticipate with TP at fibo 261.8
Possible Short Position Levels for EURJPYThe trade plan is as follows:
Action: Entering a short position, betting on the price to fall.
Entry: 171.886, anticipating a pullback to a previously broken support level.
Stop Loss: Placed at 172.406 to limit losses if the price unexpectedly rises and breaks the recent high.
Targets: Two take-profit levels are identified to secure profits as the price declines.
TP1: 170.780 (a recent support level).
TP2: 169.720 (a major previous low).
The setup is considered favorable because the potential profit is significantly larger than the potential risk.
Disclaimer
This analysis is for educational and informational purposes only and does not constitute financial advice. The provided trade idea is based on technical analysis and historical price action, and past performance is not indicative of future results. Trading foreign exchange on margin carries a high level of risk and may not be suitable for all investors. Before deciding to trade, you should carefully consider your investment objectives, level of experience, and risk appetite. You could lose some or all of your initial investment. Seek advice from an independent financial advisor if you have any doubts. Any action you take upon the information on this chart and analysis is strictly at your own risk.

EURJPY LONG After seeing price reject 170.000 monthly area of institutional support we saw a sharp push to the upside on the weekly timeframe from last week and we could see the market push to the upside not that the 4hr broke area of structure resistance

ENTRY EURJPYDisclaimer:
This is merely a chart-based analytical trading idea and is not considered investment advice. Please manage your risks carefully and conduct your own research before making any trading decisions.
ENTRY EURJPYDisclaimer:
This is merely a chart-based analytical trading idea and is not considered investment advice. Please manage your risks carefully and conduct your own research before making any trading decisions.
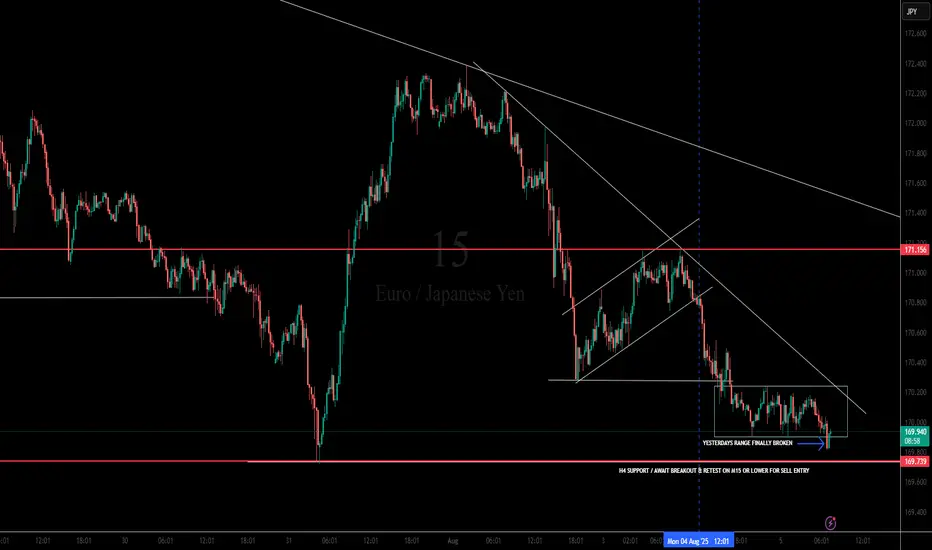
Multi-Timeframe Breakdown: LOOK @ PREVIOUS PUBLISHED IDEA FOR H4📌 M15 Chart 'SELL ENTRY PENDING'
Key Notes on Chart:
"Yesterday’s range finally broken" – confirmed.
Consolidation zone (range) broken to the downside, showing momentum shift.
Support Break: Price has broken through intra-day support of the range and retested the underside.
Break of Structure (BOS) on LTF (lower timeframe) is evident.
Bearish Flag/Channel broken down.
SMC Bias: Likely engineered a false sense of support before breaking down (liquidity grab from range buyers).
🎯 Trade Setup: Sell Opportunity (Continuation Setup)
🔻 ENTRY:
After confirmed break of the M15 range and H4 support (~169.74), look to enter on a retest rejection (LTF bearish candle confirmation on M15 or M5).
Conservative Entry: On breakdown retest @ 169.70 – 169.80
Aggressive Entry: Current price action continuation breakdown from 169.74
⚠️ What to Watch
If price reclaims and closes strongly above 170.20, invalidate bearish bias.
Any bullish engulfing or LTF shift in structure near current support warrants caution.
Watch for fakeout traps — ensure retest confirmation before entry.
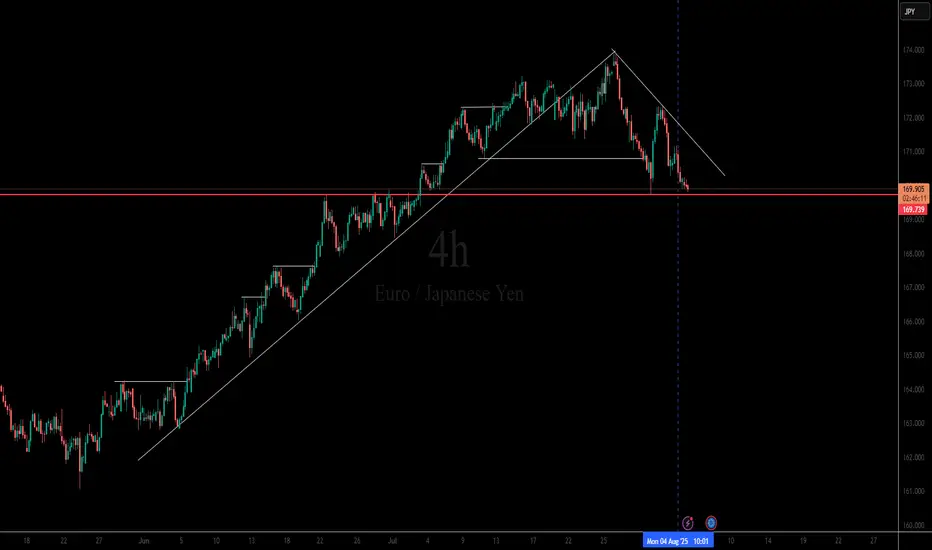
Multi-Timeframe Breakdown: LOOK AT NEXT PUBLISHED IDEA FOR M15 📌 H4 Chart SELL ENTRY LOADING....
Market Structure: Clean uptrend that broke structure to the downside.
Trendline Break: The bullish trendline has been broken and respected as resistance, showing bearish strength.
Support Level: Price is sitting right on a strong horizontal support (~169.74) — tested multiple times in the past.
Bearish Channel Forming: Price is forming lower highs and lower lows, suggesting a bearish trend continuation.
Liquidity Context:
There was likely sell-side liquidity below that horizontal support, which price might aim to sweep.
Buyers defending this area aggressively before; if they fail again, a breakout could accelerate.
EURJPY ANALYSISAfter seeing the previous weekly candle close bearish and the daily from Monday close below the low of the last bearish candle which is a sign of sellers strength, we could expect further sells to continue but a simple retracement on the 4hr back to an area of interest for a potential LH structure point before further sells

EURJPY about to enter into a DowntrendRecently EURJPY reached high points in the chart at 173.016
From there it fell and continued downwards.
I took a quick demo trade with an inverse risk to reward. Not the ideal thing to do, but I didn't want to keep my TP higher than 173.016 since we know it's a strong resistance level.
Got a quick win there.
Now, on the 4H, we can see that one huge red candle look out the previous five green candles.
It indicates that selling pressure is incoming.
This would be a good time to sell now. But I do want to see price go below 171.540 just to get that extra confirmation. Just in case, price decides to consolidate or go high for a while.
Have to stay vigilant with this market now.
TP1 will be 171.100.
TP2 will be 170.000
TP3 will be 168.800
Lets see how this trade plays out.


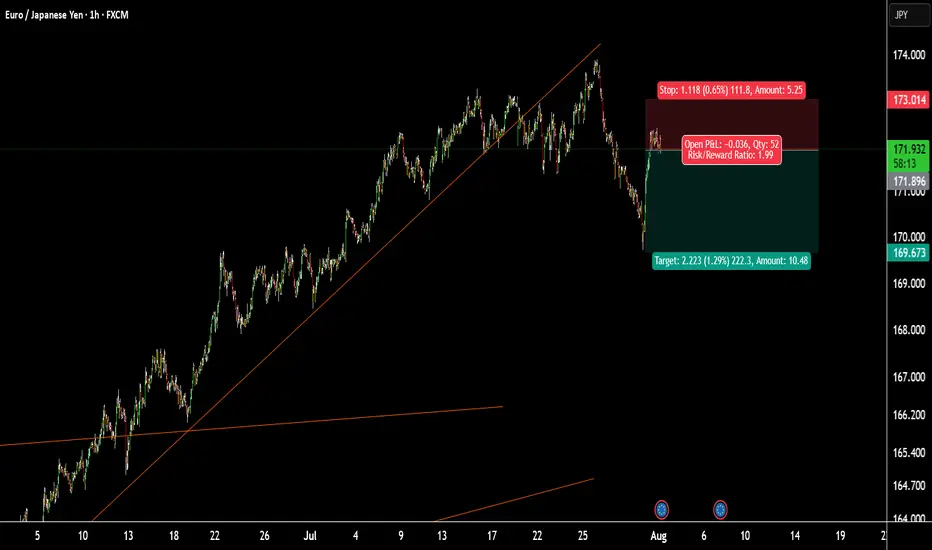
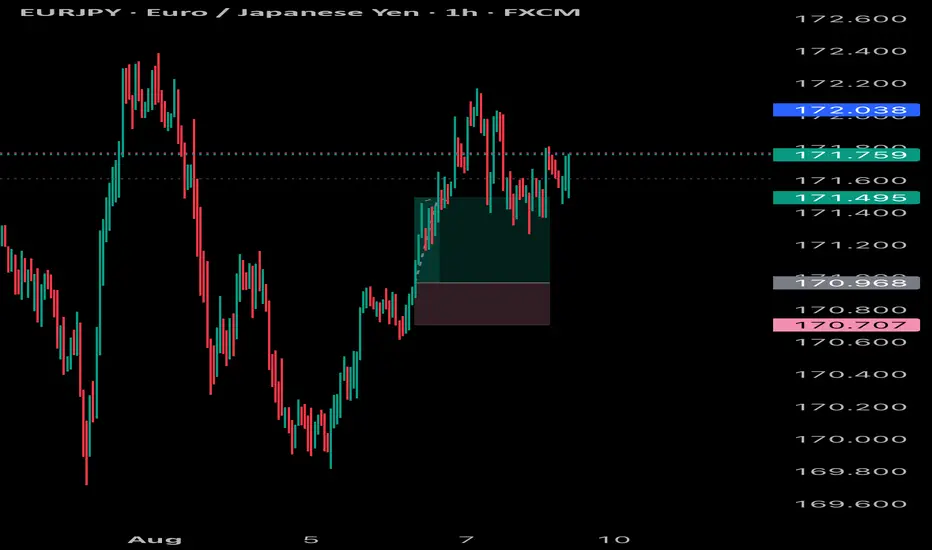
Trading the Pullback on EURJPY My Trade PlanThe EURJPY is clearly in a strong bullish trend 📈, as shown by a consistent pattern of higher highs and higher lows on the 1H timeframe ⏱️. In this video, I’m looking to capitalize on a pullback as a potential buy opportunity 🎯.
We dive into my entry strategy, explore how to align with the prevailing trend, and break down key concepts such as price action, market structure, and smart pullback zones 🧠📊.
⚠️ As always, this is for educational purposes only — not financial advice.

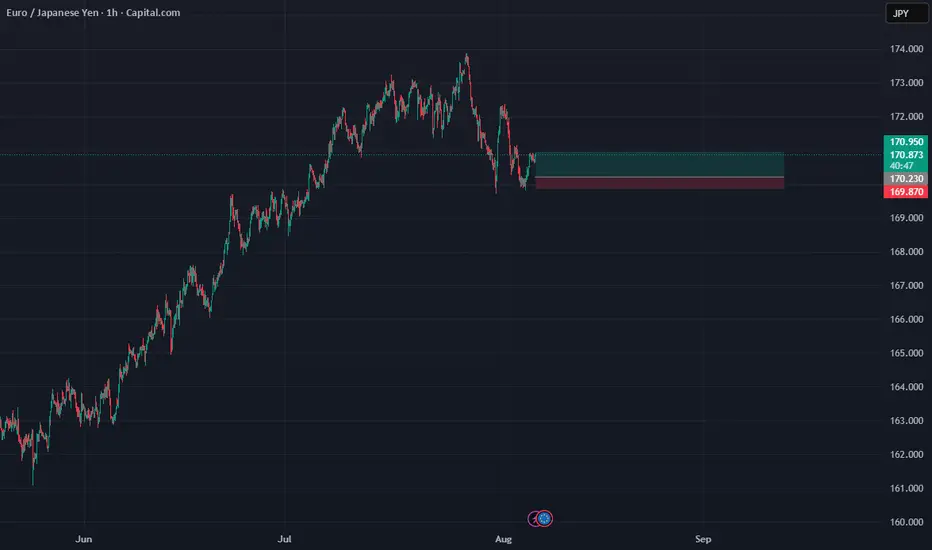
EURJPY SHORTWe have a break of Market structure. The pair rose to the daily fair value gap hoping the pair will drop to the 169.800 level

EURJPY Next Trade PlanThis Is not Advice. This is my view for next trade for a Swing, Maybe Market Goes Up With 1H OB. And Next Target Is Today High. It's My Analysis Maybe I,m wrong Because Market Is not 100% predictable.
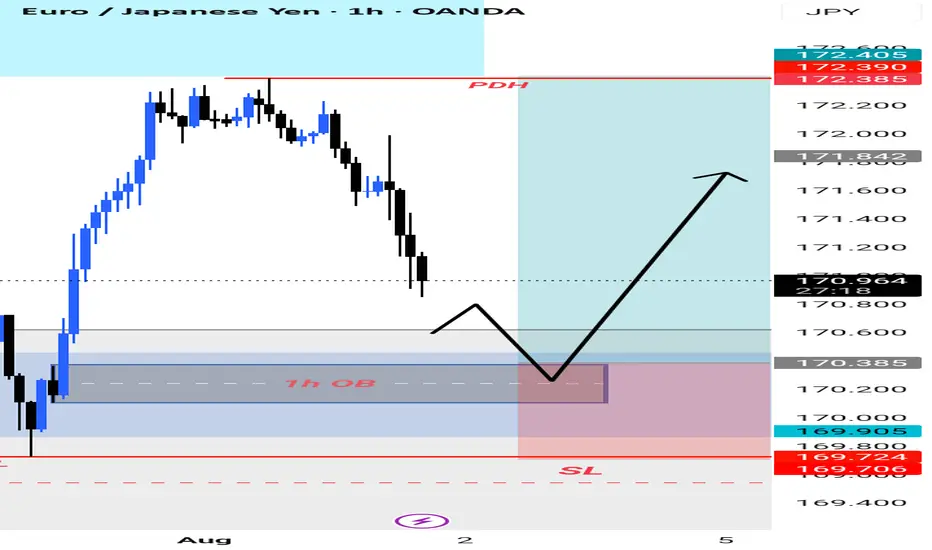
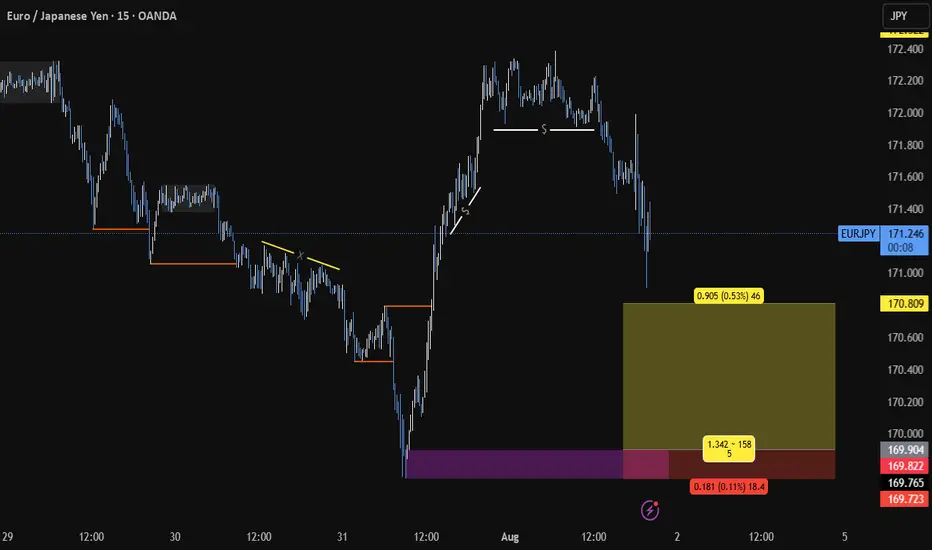
EURJPY BUYBUY @169.904
SL @169.723
TP @170.809
If it moves above and create a BOS, then close the trade....
And always risk 1%
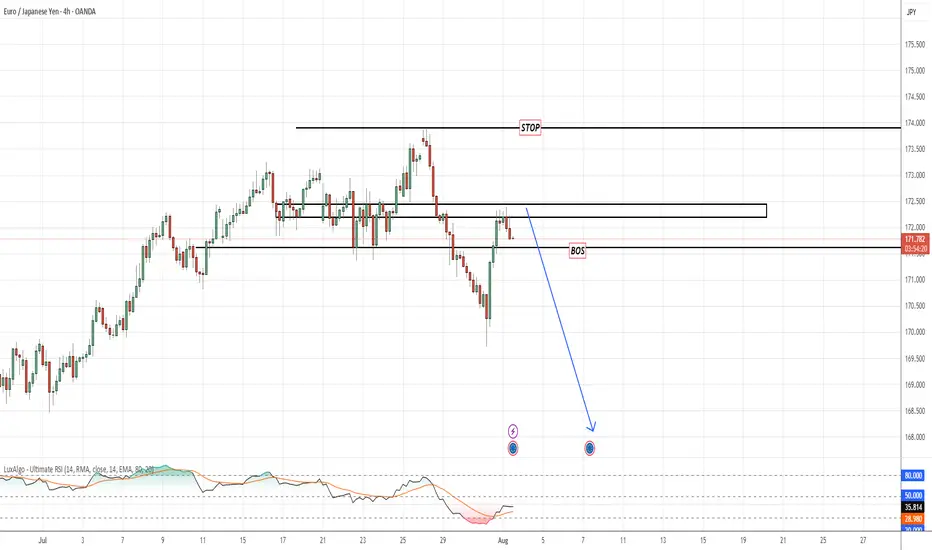
EURJPYPrice just broke key internal structure with a clear BoS (Break of Structure) after liquidity sweep above the previous highs. We're now watching for a clean retracement to the supply zone to execute a sniper short.
📍 Setup Details:
BoS Confirmed: 172.00 level cleanly broken
Area of Interest: Supply zone 172.90–173.60
Stop: Above liquidity zone ~174.55
Target: Downside continuation toward 168.00–167.00
📉 RSI shows momentum weakness on the pullback
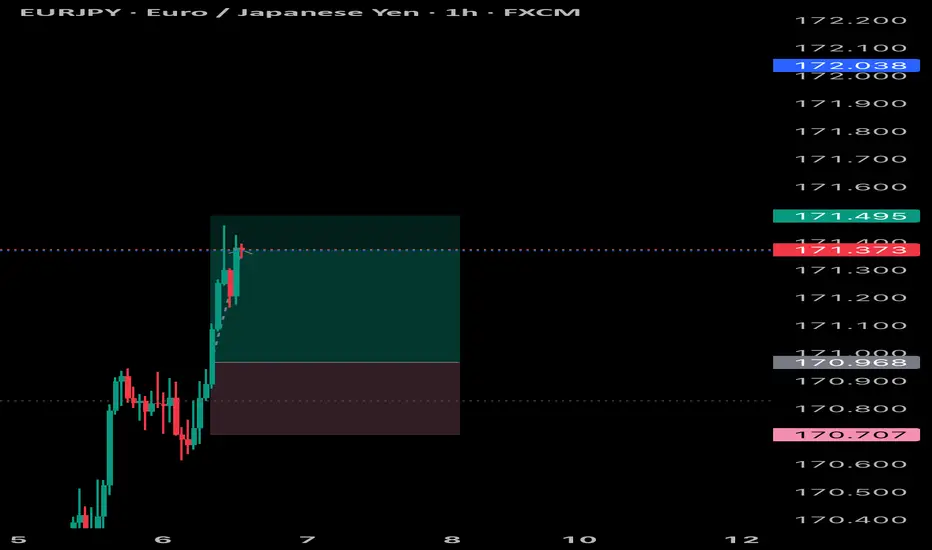
How I’m Trading the EURJPY Break of Structure Setup📈 EURJPY Analysis Update 🔍
I'm currently watching EURJPY closely. On the weekly timeframe, the pair is clearly in a strong bullish trend 🚀. Price has recently tapped into a previous daily bullish order block 🧱 — a key zone of interest.
Now, I’m watching for a break of structure (BoS) 📉 followed by a bullish continuation, especially if price pulls back into the fair value gap (FVG) 📊 near the current low.
As always, this setup — along with all key details and trade considerations — is fully broken down in the 🎥 video.
⚠️ This is for educational purposes only and not financial advice.

EURJPY SELLas the main trend line is brake and the lower low is accepted. I think it moves down and good for sell
EURJPY