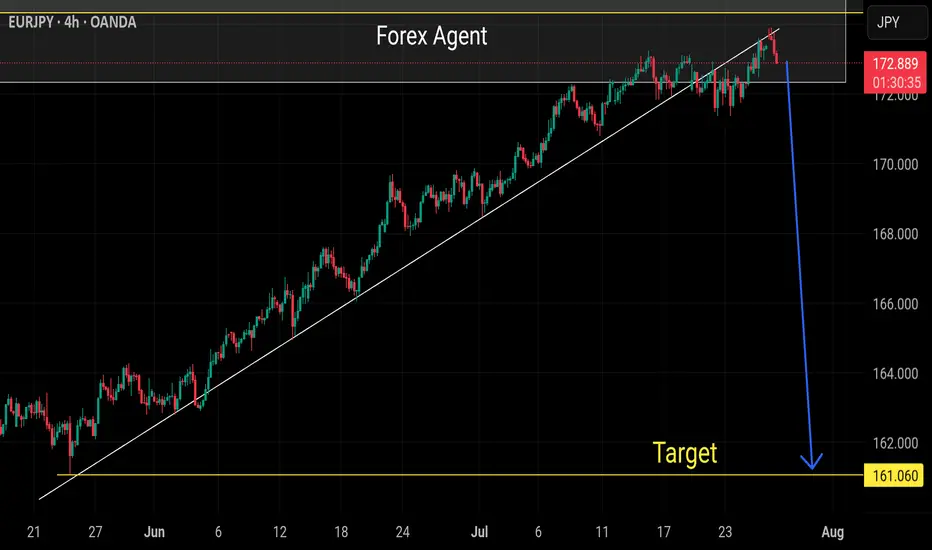
EURJPY Eyes New Highs After Pullback?What I see!
EURJPY Technical Outlook –
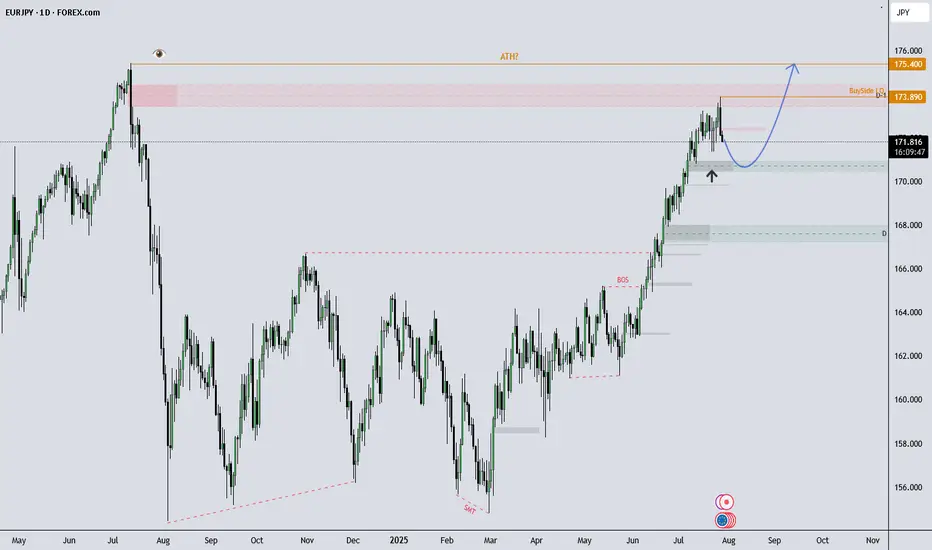
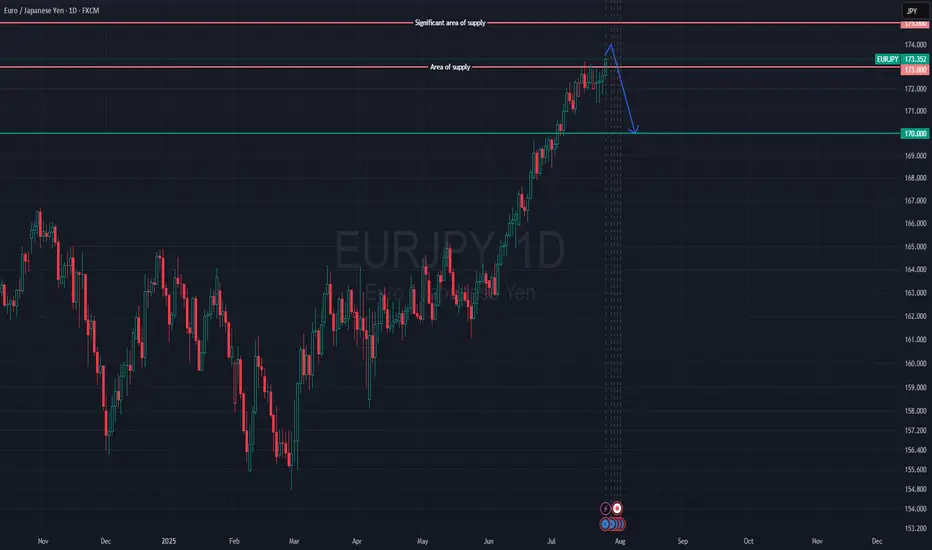
EURJPY remains in a strong uptrend and recently tapped into buy-side liquidity at 173.89, which now marks the All-Time High (ATH). After a brief rejection from that level, price is currently showing signs of a healthy pullback.
I’m observing the 170.00–171.00 zone, which aligns with previous demand. If price continues to respect this area, the overall bullish structure remains intact, with potential for a move back toward (and possibly beyond) the ATH.
A sustained break below 170.00 could indicate room for a deeper pullback, potentially toward the 168.00s, which would be a key area to monitor.
This analysis is shared for educational and discussion purposes only.
JPYEUR trade ideas
EUR/JPY Bearish Engulf as EUR/USD Sells Off Ahead of the FedA good illustration of FX market structure is on display today. EUR/USD is down sizably after teh announcement of the EU trade deal and this may be a 'buy the rumor, sell the news' kind of event. But, there's also the possibility that this is squaring up ahead of a really big week of drivers with FOMC, Core PCE and NFP all scheduled for later this week. But, there's also the sentiment argument, where a strong bullish move has taken hold of the Euro in the first half of the year as EUR/USD has jumped to fresh three-year highs.
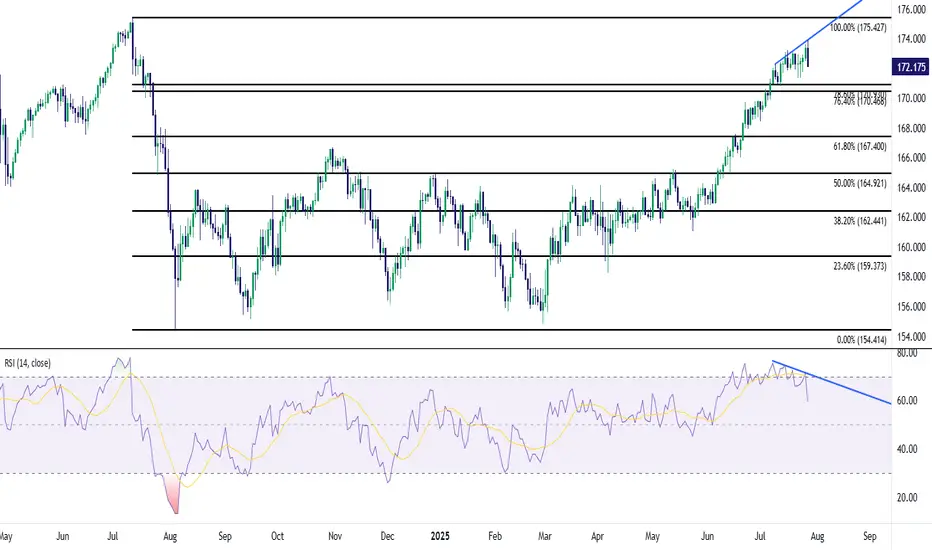
And while USD/JPY is rallying up to the 148.00 level, displaying Yen-weakness, EUR/JPY is down on the daily with a show of JPY-strength. This highlights that the move in EUR/USD is likely driving that sell-off in EUR/JPY as EUR/JPY is currently working on a bearish engulfing candlestick on the daily. And this happens after last week showed overbought RSI on both the daily and weekly charts, with daily RSI diverging from price as EUR/JPY set a fresh yearly high shortly after the open this morning.
This shows that EUR/JPY is very much in-play this week with those US drivers, and there's also the Bank of Japan rate decision to consider. In EUR/JPY, there's possible support tests coming up, around the 170.47 and 170.93 Fibonacci levels, followed by the 170.00 big figure. - js
EURJPY point of revers?
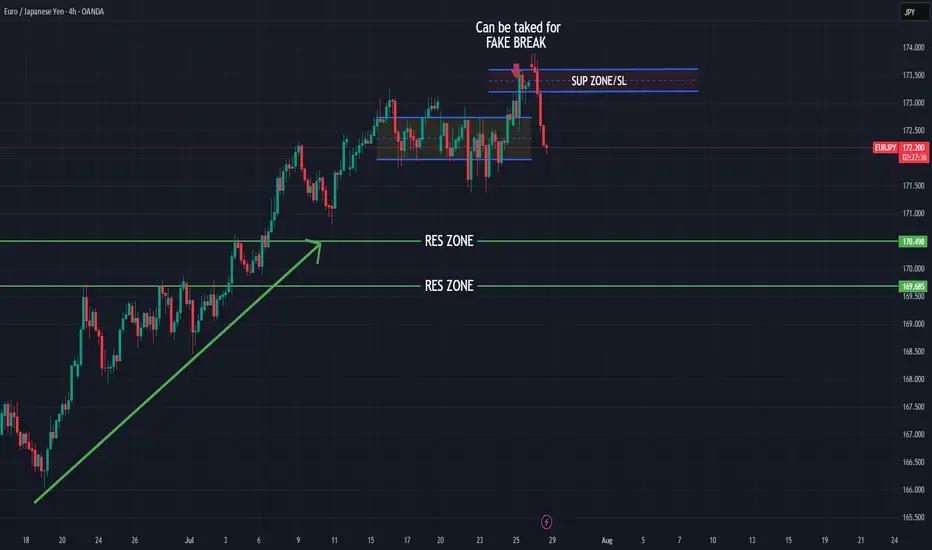
OANDA:EURJPY constantly pushing in last periods, currently on this point expecting trend revers and short bearish push.
SUP zone: 173.200
RES zone: 170.500, 169.700
EURJPY Sellers In Panic! BUY!
My dear friends,
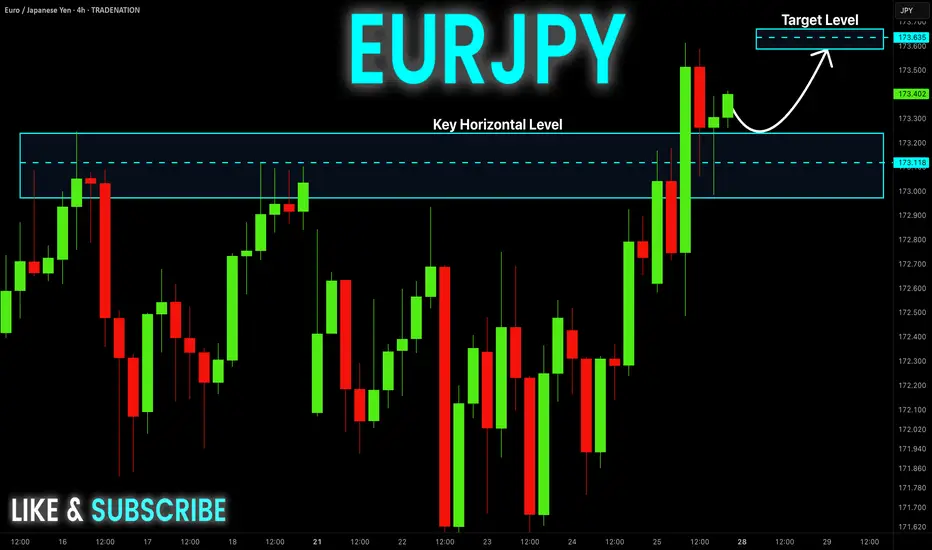
Please, find my technical outlook for EURJPY below:
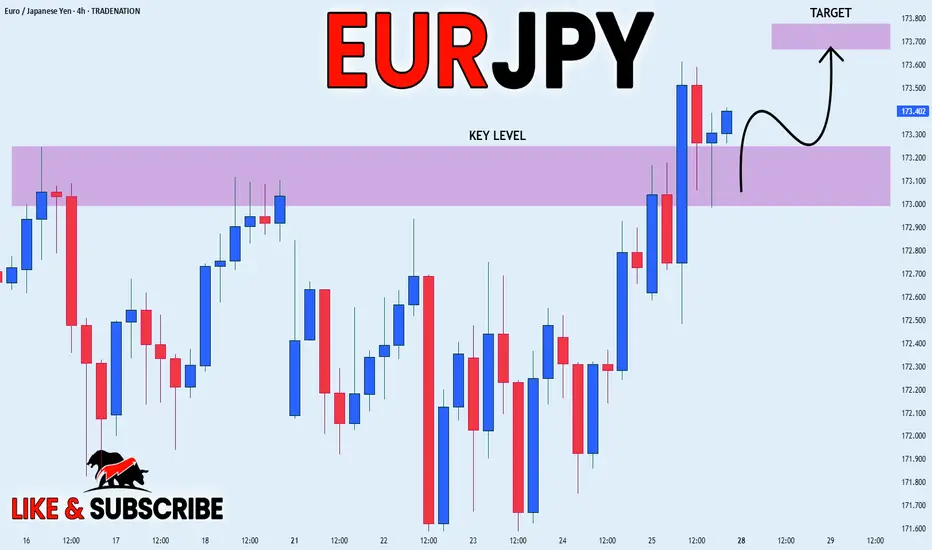
The price is coiling around a solid key level - 172.51
Bias - Bullish
Technical Indicators: Pivot Points Low anticipates a potential price reversal.
Super trend shows a clear buy, giving a perfect indicators' convergence.
Goal - 173.00
Safe Stop Loss - 172.29
About Used Indicators:
The pivot point itself is simply the average of the high, low and closing prices from the previous trading day.
Disclosure: I am part of Trade Nation's Influencer program and receive a monthly fee for using their TradingView charts in my analysis.
———————————
WISH YOU ALL LUCK

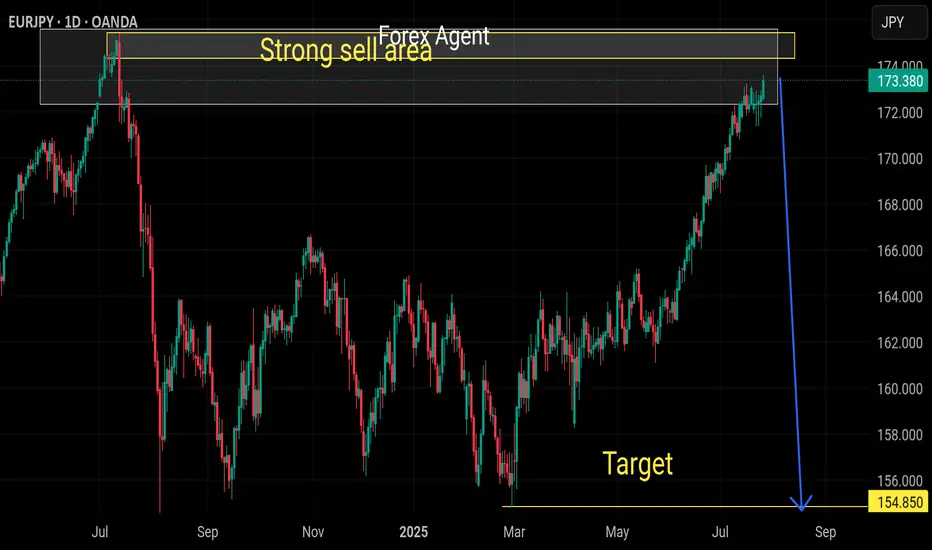
Strong sell eurjpy Big drop now eurjpy as euro gonna weak among all cross pairs
Weekly already overbought
Support trend breakout and retested on H4
EURJPY Retest support before buys NOTE:
This pair may form liquidity trap before the buyers continue the movement to the upside
EURJPY ANALYSIS After seeing the weekly close bullish we could expect the pair to continue the bullish leg this new week with the daily and 4hr trading in the same direction. An upside target of 175.000 could be the profit taking areas for the next leg to the upside

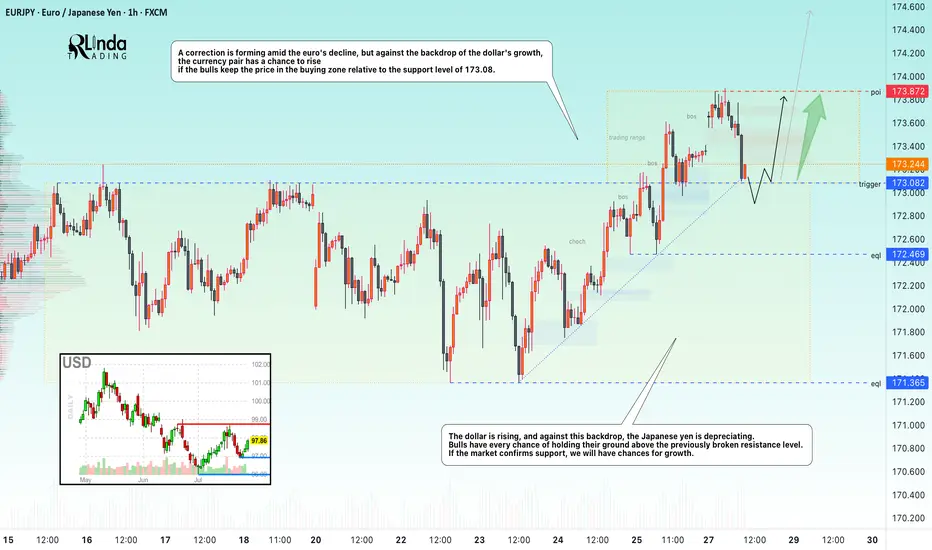
EURJPY → Retest support before growthFX:EURJPY has been correcting since the opening of the European session. The movement was triggered by yesterday's news related to the trade deal between the US and Europe...
EURJPY is reacting to news related to the deal between the US and Europe. A correction is forming amid the fall of the euro, but against the backdrop of the dollar's growth, the currency pair has a chance to rise if the bulls keep the price in the buying zone relative to the support level of 173.08.
The dollar is rising, and against this backdrop, the Japanese yen is falling. Bulls have every chance of holding their ground above the previously broken resistance. If the market confirms support, we will have chances for growth.
Resistance levels: 173.87
Support levels: 173.082, 172.47
The currency pair may form a liquidity trap relative to the previously broken consolidation resistance. A false breakdown of support and price consolidation in the buying zone (above 173.1) could trigger further growth.
Best regards, R. Linda!
EURJPYBank of Japan (BOJ) — July 28, 2025: Latest Overview
Policy Rate and Recent Moves
Short-term policy rate: Remains at 0.5%, the highest since 2008.
Decision timing: This rate was set in January 2025 (up from 0.25%) and has been maintained
Policy Outlook and Economic Backdrop
Inflation: Tokyo's core CPI is running above the BOJ’s 2% target (2.9% YoY in July), primarily due to external price pressures like energy and currency movements, not strong domestic demand.
Growth trends: The BOJ has trimmed its growth outlook, noting headwinds from higher U.S. tariffs and yen weakness, but still expects a moderate recovery if global trade remains stable.
Bond Purchases: The BOJ is scaling back its massive holdings of Japanese government bonds—targeting a 400 billion yen quarterly reduction through March 2026, then lowering to 200 billion yen in subsequent quarters.
Potential rate path: Market consensus and BOJ commentary indicate a possible hike to at least 0.75% by year-end 2025 if above-target inflation persists and downside global risks do not intensify.
Key Drivers and Central Bank Signals
U.S.-Japan trade: The new trade pact has reduced some uncertainties, supporting the possibility of policy tightening if inflation and yen trends remain stable.
Inflation’s nature: The BOJ stresses that any additional rate hikes will depend on seeing sustained, demand-driven price increases and wages, rather than just external cost pressures.
Governor Ueda’s message: The BOJ is maintaining a cautious, data-dependent approach, prioritizing stability and careful evaluation of global and domestic risk factors.
Quick Fact Table
Indicator Latest (July 2025) BOJ’s Signal
Policy Rate 0.5% Steady for now; another hike possible in 2025
Tokyo Core CPI (YoY) 2.9% Sustainable above-target inflation
Next Meeting July 30–31 Hawkish bias; likely no immediate change
Bonds (JGB reduction) -400B yen/Q Gradual unwinding through March 2026
Rate Outlook Stable, with upside Hike to 0.75% possible by year-end if justified
Summary:
The BOJ remains in a cautious, data-driven policy stance at 0.5% as of late July 2025, with inflation still above target and moderate growth. The central bank is slowly reducing bond purchases and may raise rates again by year-end if the current economic trends persist, but no change is expected at the imminent July meeting.
European Central Bank (ECB) — July 2025: Latest Policy and Economic Update
Key Interest Rates and Current Stance
Deposit Facility Rate: 2.00%
Main Refinancing Operations (MRO) Rate: 2.15%
Marginal Lending Facility Rate: 2.40%
These rates were set after a 25 basis point cut in early June 2025 and have now been held steady as of the ECB’s July 24, 2025 meeting.
Monetary Policy Context
Policy Pause: The ECB ended a year-long easing cycle which saw rates cut from 4% to 2%. The current pause reflects the ECB’s “wait-and-see” approach as inflation has now stabilized at its 2% target and global trade tensions—especially over U.S. tariffs—add significant uncertainty.
No Commitments: The Governing Council is explicitly not pre-committing to any future rate path, emphasizing a data-dependent, meeting-by-meeting stance.
Asset Purchases: The ECB’s asset purchase programme (APP) and the pandemic emergency purchase programme (PEPP) portfolios are being reduced gradually, with no reinvestment of maturing securities.
Inflation and Economic Outlook
Inflation: Now at 2% (its target). The ECB expects it to remain near target for the period ahead. Wage growth continues but is slowing, and underlying price pressures are easing.
Ecoomic Growth: The eurozone economy grew more strongly than expected in early 2025, but trade uncertainty and a stronger euro are holding back business investment and exports. Higher government spending, especially on defense and infrastructure, is expected to support growth over the medium term.
Loans and Credit: Borrowing costs are at their lowest since late 2022. Households are benefiting from strong labor markets and growing wages, but banks are cautious in their lending due to uncertainty and global trade tensions.
Risks and Forward Guidance
The ECB is focused on safeguarding price stability amid exceptional uncertainty due to global trade disputes and policy risks.
There is no forward guidance for the next rate change. Markets are pricing only one possible additional cut for 2025, and a potential return to tightening in late 2026 if inflation stays below target.
Summary Table: ECB at a Glance (July 2025)
Policy Rate 2.15%
Deposit Rate 2.00%
Marginal Lending 2.40%
Inflation (Jun 25) 2% (target achieved)
GDP Growth (2025) 0.9% (projected)
Policy bias Cautious, data-dependent pause
The ECB’s current stance is one of caution, monitoring the effects of prior easing and global trade risks while inflation stabilizes at target. No further near-term cuts are planned unless significant data surprises emerge. The approach is flexible, with decisions made meeting-by-meeting in response to evolving economic and financial conditions.

EURJPY – DAILY FORECAST Q3 | W31 | D28 | Y25📊 EURJPY – DAILY FORECAST
Q3 | W31 | D28 | Y25
Daily Forecast 🔍📅
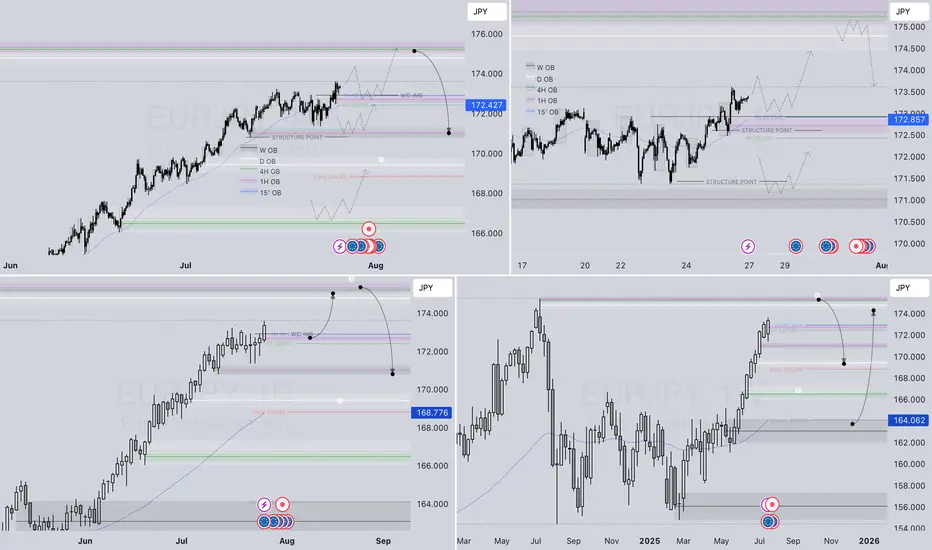
Here’s a short diagnosis of the current chart setup 🧠📈
Higher time frame order blocks have been identified — these are our patient points of interest 🎯🧭.
It’s crucial to wait for a confirmed break of structure 🧱✅ before forming a directional bias.
This keeps us disciplined and aligned with what price action is truly telling us.
📈 Risk Management Protocols
🔑 Core principles:
Max 1% risk per trade
Only execute at pre-identified levels
Use alerts, not emotion
Stick to your RR plan — minimum 1:2
🧠 You’re not paid for how many trades you take, you’re paid for how well you manage risk.
🧠 Weekly FRGNT Insight
"Trade what the market gives, not what your ego wants."
Stay mechanical. Stay focused. Let the probabilities work.
OANDA:EURJPY


Eur/jpy Bulls to dominate @174.440 Handle As we begin a new week, I see the bulls coming in and grabbing the unmitigated liquidity @174.440 handle. My advice to fellow traders is that if the ECB stays hawkish or the BOJ remains dovish, EUR/JPY has room to stretch higher.
Watch Euro inflation numbers, BOJ yield curve control updates, and U.S. data spillovers.
Buy @ 173.15
TP 1.~174.440

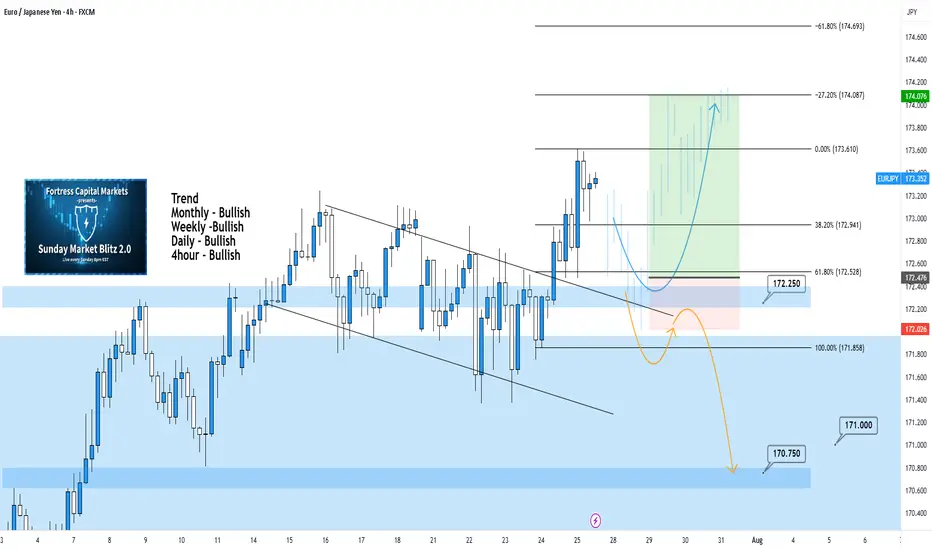
EURJPY 4Hour TF - July 27th, 2025EURJPY 7/27/2025
EURJPY 4hour Bullish Idea
Monthly - Bullish
Weekly - Bullish
Daily - Bullish
4hour - Bullish
All timeframes suggest we are bullish and after last week that is clear. We’re expecting a bit of a pullback but let’s get into two potential setups for the week ahead:
Bullish Continuation - If we are to continue with the bullish trend we would like to enter a trade at the next point of structure. In this scenario, the next point of structure would be a higher low as close to 172.250 support & our 61.8% fib level as possible.
Look to target higher toward our -27% fib level if this happens.
Bearish Reversal - For us to consider EJ bearish again we would need to see a strong break below our support at 172.250.
If we see bearish structure below this zone we can say price action will most likely fall lower, potentially down to 170.750.
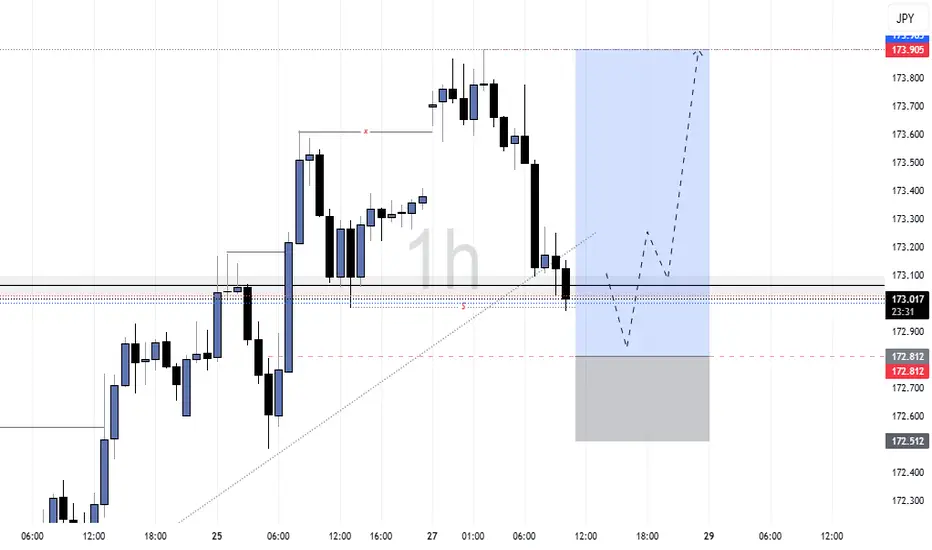
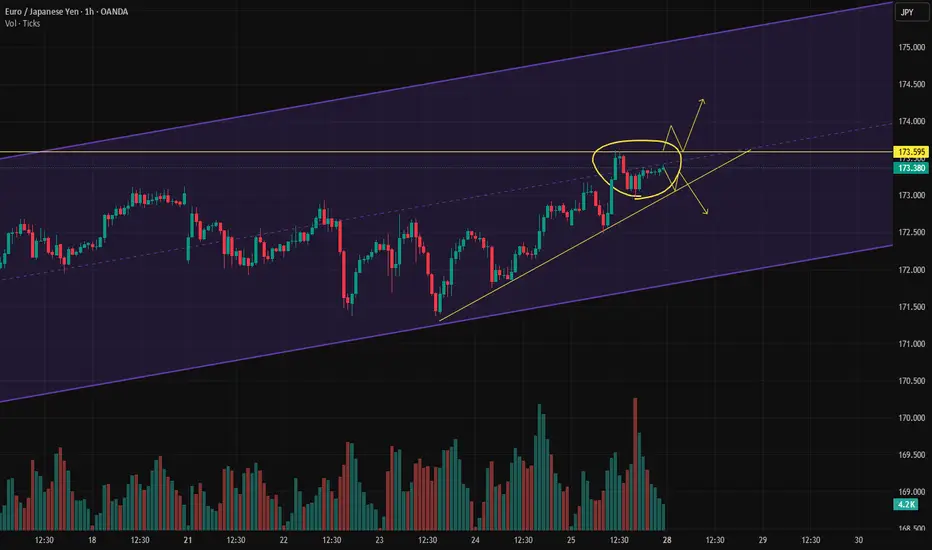
4-hour channel midlineThe price has reached the midline of the 4-hour channel, and buying volume has decreased in this area.
We need to see whether the price can break above the midline or not.
If it breaks to the upside, our first target will be the top of the channel.
If it gets rejected, our target will be the bottom of the channel.
Strong sell eurjpyStrong selling wave coming in next weeks minimum 800 pips drop expected
Strong selling level reached
Strong bearish engulfing level
Weekly overbought pair
EUR-JPY Local Long! Buy!
Hello,Traders!
EUR-JPY is trading in an
Uptrend and the pair made
A breakout, a retest and
A bullish rebound from the
Horizontal support of 173.200
So we are bullish biased and
We will be expecting a
Further bullish move up
On Monday!
Buy!
Comment and subscribe to help us grow!
Check out other forecasts below too!
Disclosure: I am part of Trade Nation's Influencer program and receive a monthly fee for using their TradingView charts in my analysis.
EURJPY – WEEKLY FORECAST Q3 | W31 | Y25📊 EURJPY – WEEKLY FORECAST
Q3 | W31 | Y25
Weekly Forecast 🔍📅
Here’s a short diagnosis of the current chart setup 🧠📈
Higher time frame order blocks have been identified — these are our patient points of interest 🎯🧭.
It’s crucial to wait for a confirmed break of structure 🧱✅ before forming a directional bias.
This keeps us disciplined and aligned with what price action is truly telling us.
📈 Risk Management Protocols
🔑 Core principles:
Max 1% risk per trade
Only execute at pre-identified levels
Use alerts, not emotion
Stick to your RR plan — minimum 1:2
🧠 You’re not paid for how many trades you take, you’re paid for how well you manage risk.
🧠 Weekly FRGNT Insight
"Trade what the market gives, not what your ego wants."
Stay mechanical. Stay focused. Let the probabilities work.
OANDA:EURJPY
EURJPY Bullish Breakout with IFC Confirmation | MMC Retest Play🔍 Market Structure & Price Behavior Explanation
🔹 1. Channel Structure and Bearish Trap:
The pair was previously trading within a downward sloping channel, forming lower highs and lower lows. This structure was respected for several sessions, creating a bearish bias for most retail traders.
However, as per Mirror Market Concepts, such channels often act as liquidity traps — designed to build sell-side liquidity before a strong reversal.
🔹 2. IFC Candle Break — Smart Money Confirmation:
A powerful bullish impulse candle (IFC - Institutional-Filled Candle) broke through all previous swing highs formed inside the channel. This is a critical sign that institutional buyers have stepped in and the bearish trend is likely over.
This candle is not just a breakout but also a signature of smart money transitioning the market structure from bearish to bullish. The breakout occurred with high momentum and volume, piercing through the upper channel boundary, invalidating the bearish trend.
📘 Key Note: IFC candles usually represent imbalance, strong directional intent, and are often followed by continuation after retest.
🔹 3. Retesting Phase – Key to Confirmation:
After the breakout, price retested the broken structure, which is now acting as a new demand zone. The retest is clean, holding firmly above minor support — giving confirmation of bullish control.
This zone is also aligned with a QFL (base structure) concept, where price returns to the base before a new leg of the trend begins.
🔹 4. Current Price Action: Building for Next Leg
Price is now consolidating just below the next key reversal zone (marked in green). This zone represents potential supply or resistance.
There are two likely outcomes here:
Rejection at the reversal zone, with a potential pullback before continuation.
Clean break above, followed by "Demand Doubling", where price re-tests this level again, confirming further upside momentum.
In case the second scenario plays out (as marked on the chart), EURJPY could aggressively rally toward 174.400 and beyond.
🔹 5. Demand Zones & Key Levels:
✅ Minor Demand Zone (~173.00):
Currently respected — origin of last bullish move.
✅ Major Demand Zone (~171.200):
Acts as macro support in case of deep retracement.
✅ Reversal Zone (~173.800 – 174.200):
Price may slow down, reject, or consolidate here. Smart money usually decides at this level.
📈 MMC Trading Plan (Mirror Market Concept Approach):
Buy Bias is active as long as price remains above the minor demand zone.
Any rejection from reversal zone with wick traps followed by bullish engulfing setups = potential long entries.
Break & hold above 174.200 will likely trigger momentum-based entries, targeting extended bullish continuation.
💹 Trade Setup Parameters:
📥 Entry #1: After successful retest and bullish confirmation at demand
🛑 Stop Loss: Below retest structure (~172.850)
🎯 Take Profit 1: 173.950 (within reversal zone)
🎯 Take Profit 2: 174.350+ (post-demand doubling continuation)
🧠 Trader’s Mindset – What to Expect Next:
The chart is a classic example of MMC in real-time, where:
Price traps sellers inside a fake bearish channel
Breaks structure using high-volume impulsive moves
Retests demand zone cleanly
Builds up toward the next decision-making zone
Patience is key here. Let price either break and confirm above the reversal zone or give us another deep retest for the best R:R long setup.

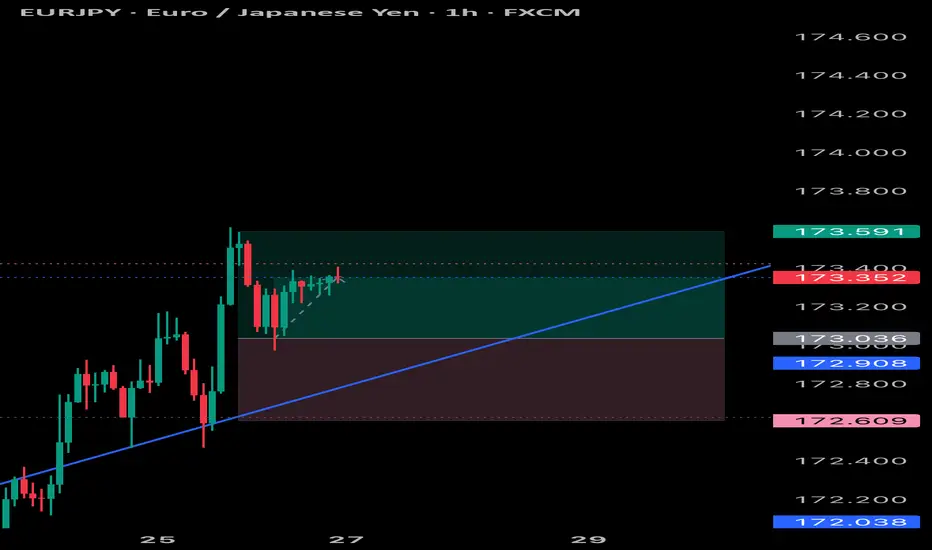
Lower Timeframe Analysis on EUR/JPYIn this trade, I intend to open a long position.
Looking at the lower timeframes (15-minute chart), I see a potential buying opportunity. After reaching the area near the 173.609 level, the pair reversed down to around 172.978, and then bounced back up. This movement may indicate the start of a reversal followed by a pullback.
Moving on to the higher timeframes (daily and weekly), the bullish candles are showing some strength, and the following technical indicators:
* 45-period Exponential Moving Average
* 70 and 95-period Simple Moving Averages
* Parabolic SAR
Are moving in line with the intended direction and objective, which may suggest a continuation of the upward trend.
That said, it's important to remember that despite this technical analysis, it's crucial to monitor economic data, news, and other fundamental factors that could affect this pair, since this assessment focuses solely on the technical side.
The long position tool displayed on the chart is just an additional aid to help support the entry decision.

EUR/JPY is Approaching a Key Supply Zone, Possible ShortWe initially anticipated a reversal around the 173.000 supply zone. It’s important to note that the Bank of Japan is currently facing a serious issue in the bond market — there have been several sessions with no bids for Japanese government debt. This is a troubling development and likely means the central bank will step in to purchase bonds soon.
That said, price closed above the 173.000 level on Friday, signaling further bullish momentum. The next key area of interest is the 175.000 level — a significant supply zone we are monitoring closely. If price reacts and pulls back from this level, we’ll be analyzing the yen across other major pairs, as well as keeping a close eye on the euro.
EUR_JPY WILL GROW|LONG|
✅EUR_JPY will keep growing
Because the pair is in the uptrend
And recently broke the key level of 173.200
So we will be expecting
Bullish continuation
LONG🚀
✅Like and subscribe to never miss a new idea!✅
Disclosure: I am part of Trade Nation's Influencer program and receive a monthly fee for using their TradingView charts in my analysis.
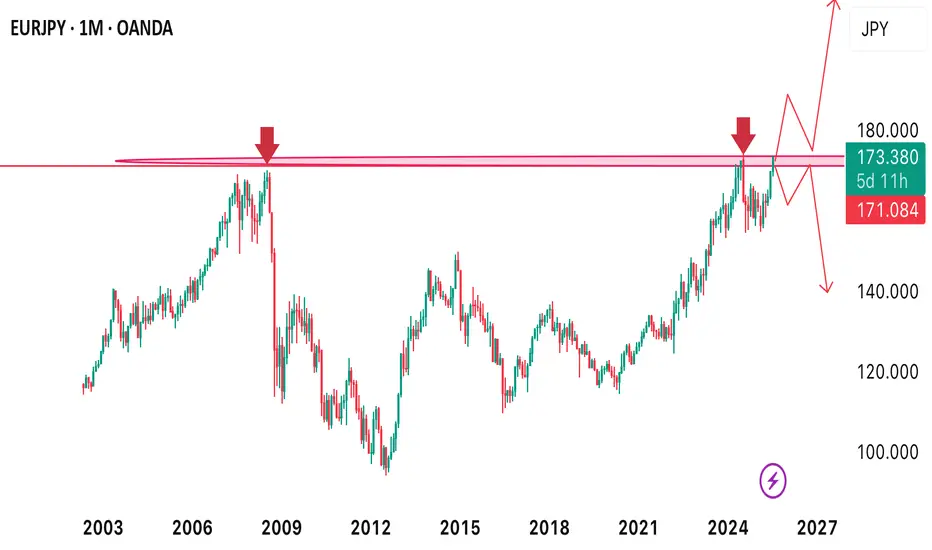
Price approaches a resistance level one more time!EURJPY recently approached a monthly resistance level. It’s a crucial level where we’re monitoring price closely to see either a breakout or the resistance level for the first time since 2008 (over 17years now) coming week as we’re going to keep a close watch from the intraday perspective to help us spot when market will either start to break above the resistance to start to decline from that high
EURJPY LOOKING GOOD Eurjpy has been behaving as expected and can continue to the up side and complete its pattern