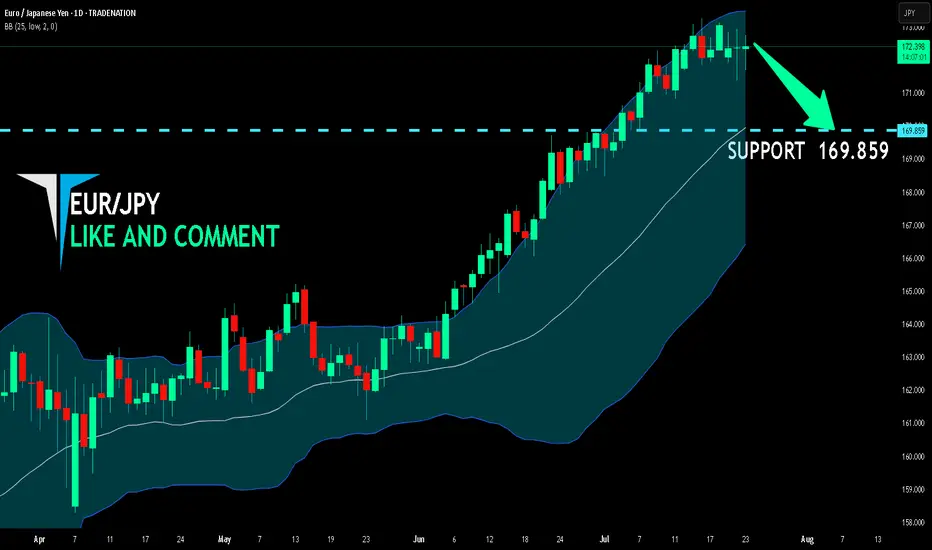
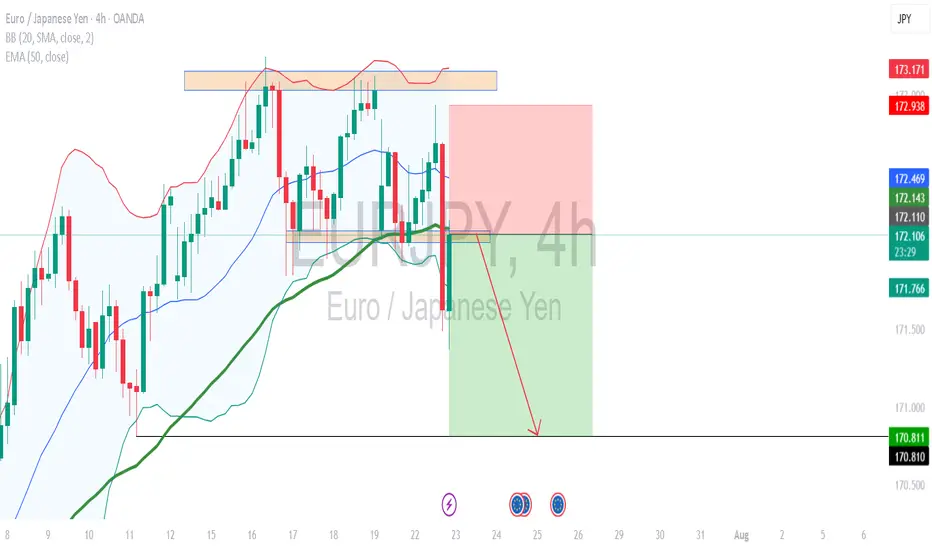
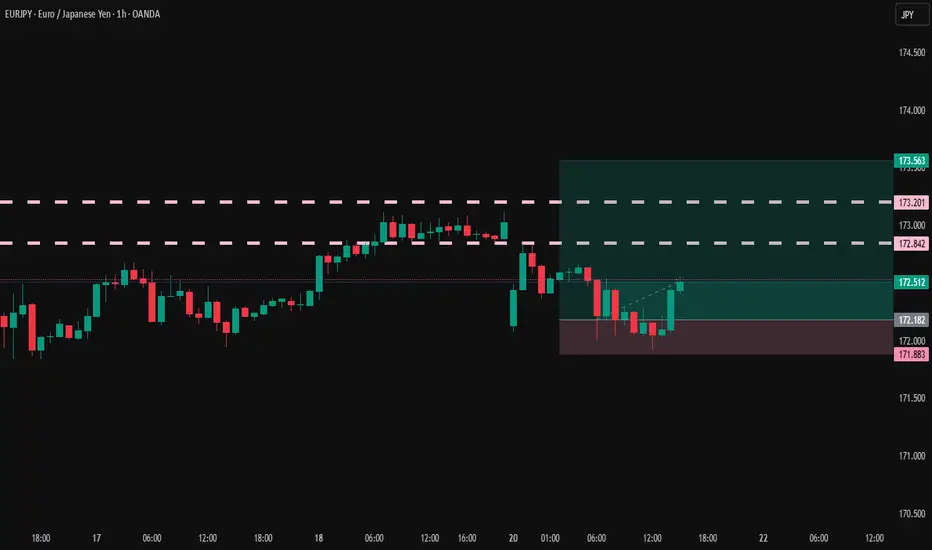
EUR/JPY BEST PLACE TO SELL FROM|SHORT
Hello, Friends!
EUR-JPY uptrend evident from the last 1W green candle makes short trades more risky, but the current set-up targeting 169.859 area still presents a good opportunity for us to sell the pair because the resistance line is nearby and the BB upper band is close which indicates the overbought state of the EUR/JPY pair.
Disclosure: I am part of Trade Nation's Influencer program and receive a monthly fee for using their TradingView charts in my analysis.
✅LIKE AND COMMENT MY IDEAS✅
JPYEUR trade ideas
EURJPY break of strong support , at fib 0.5 short EURJPY was trending in uptrend but recently a strong support was broken and Big Sell candle is formed and currently price has pulled back to fib 0.5 and soon may price go down.

EURJPY
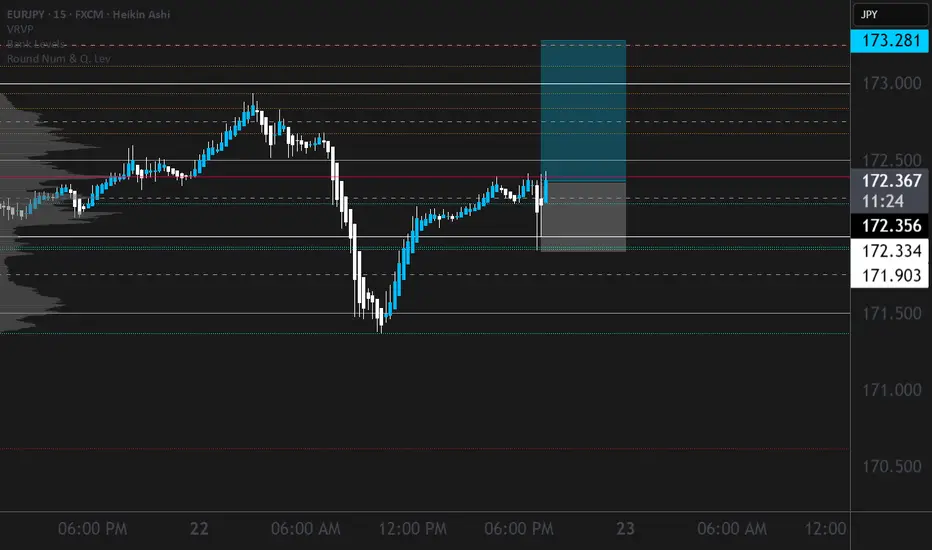
📍 Strategy: BoS + Retest Sniper Entry
🔍 Market Context:
Break of Structure (BoS) confirmed
Price returned to retest broken structure zone
RSI showing overbought divergence (above 70)
Perfect rejection from AREA OF INTEREST near 172.90–173.00
🔻 TRADE DETAILS
🟣 Sell Entry: 172.349
🔺 Stop Loss: 172.948 (Above structure high)
🎯 Take Profit: 169.146
🧮 Risk/Reward: ~1:5.6
🧠 Confidence: 75% setup based on structure + RSI + fakeout wick

EURJPY 4H chartIf price fails to reclaim above 172.5 and prints a bearish confirmation candle on the retest, it's a high-probability short opportunity targeting the 170.000–169.800 support zone — as you've marked.
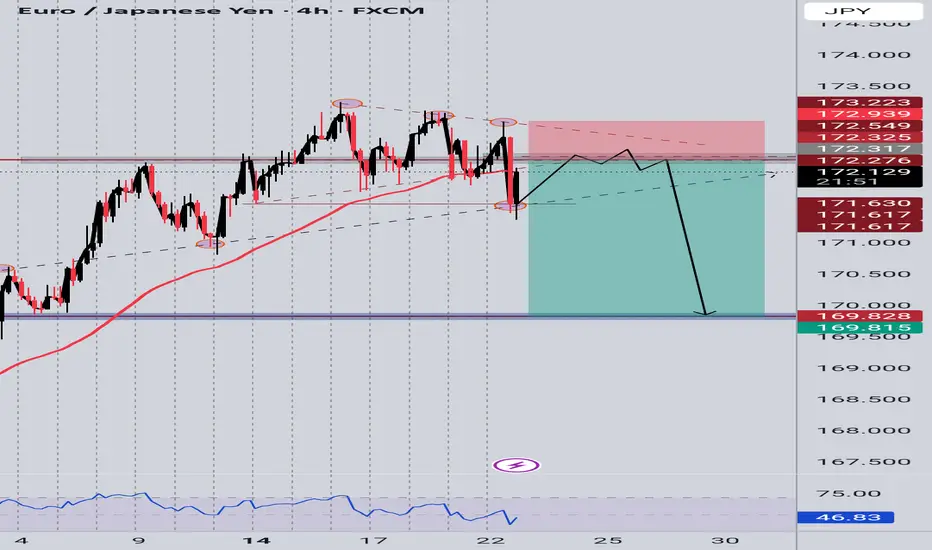
EURJPY Short at current market priceH4 Price action showing support has been broken.
Seller started to stepping in.
Now support become resistant.
calculate your own risk & reward.
Good Luck
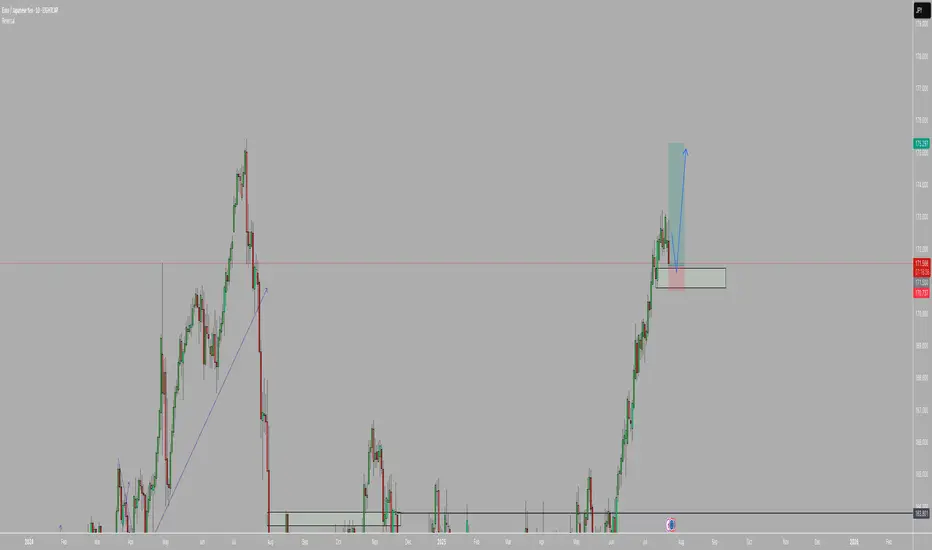
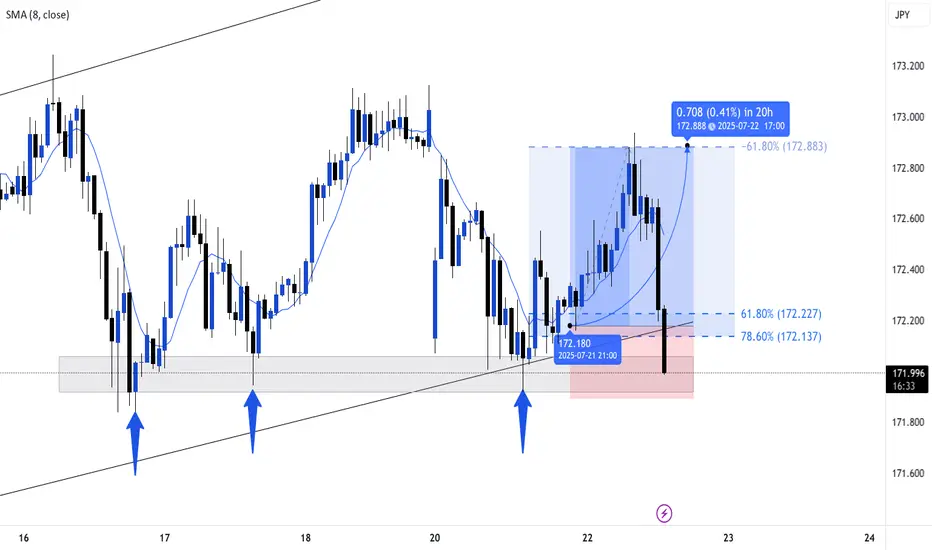
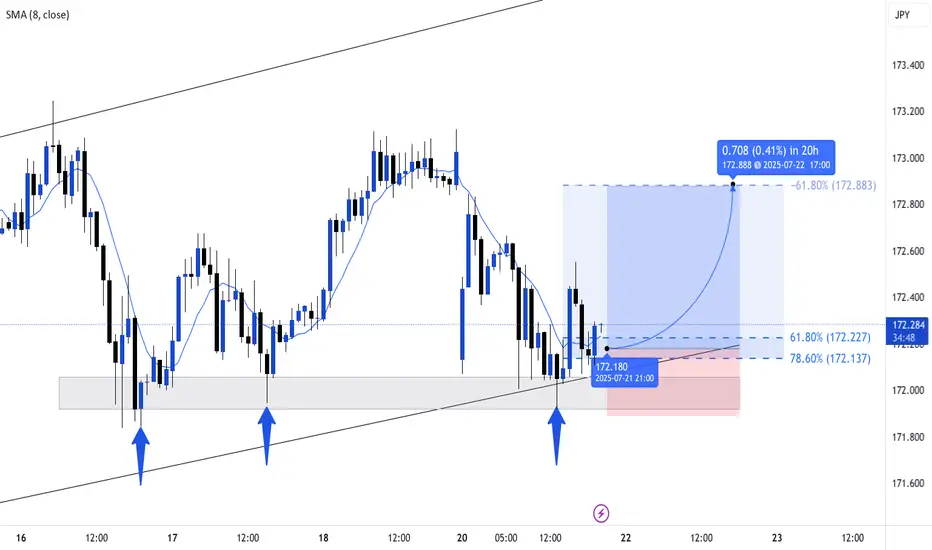
RESET PRICE FOR EJEurjpy has gone down but only to clear stops and lows but we keep following the trend because it is the only true direction for now

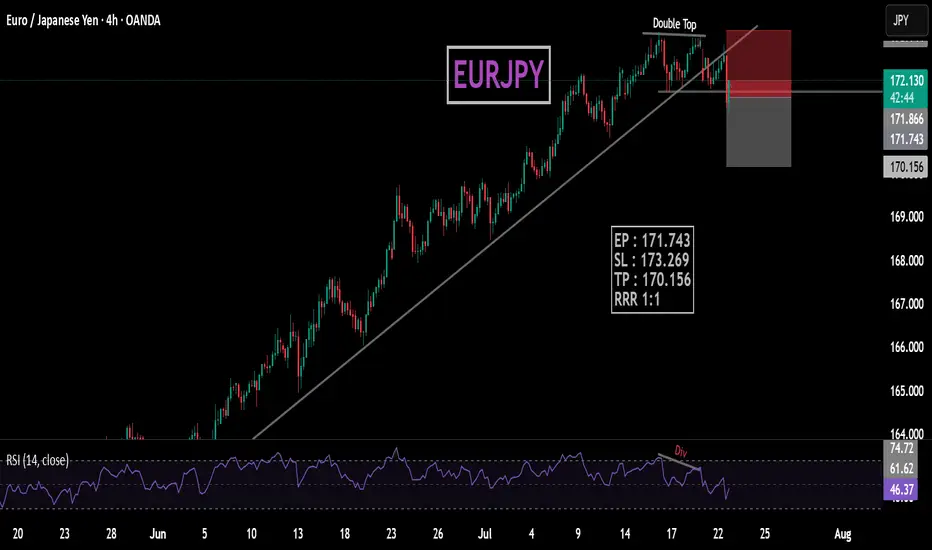
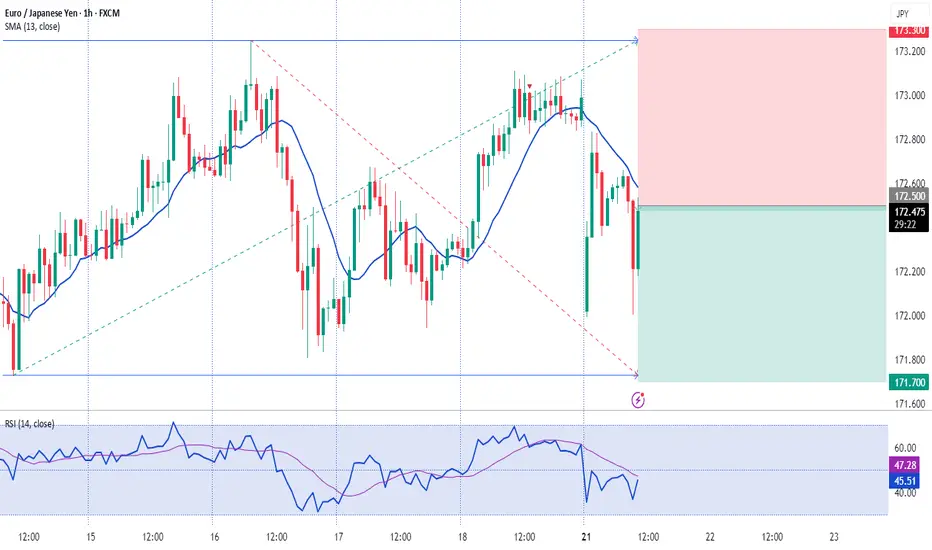
EURJPYDouble top with rsi bearish Divergence also bulish trendline beark.
EP : 171.743
SL : 173.269
TP : 170.156
RRR 1:1
EURJPY BUYSI'm still strongly bullish on the Euro, and this current pullback on EURJPY appears to be a healthy retracement within the larger uptrend. It offers a good opportunity to enter long positions with the expectation of a move back to retest the highs reached in July 2024.
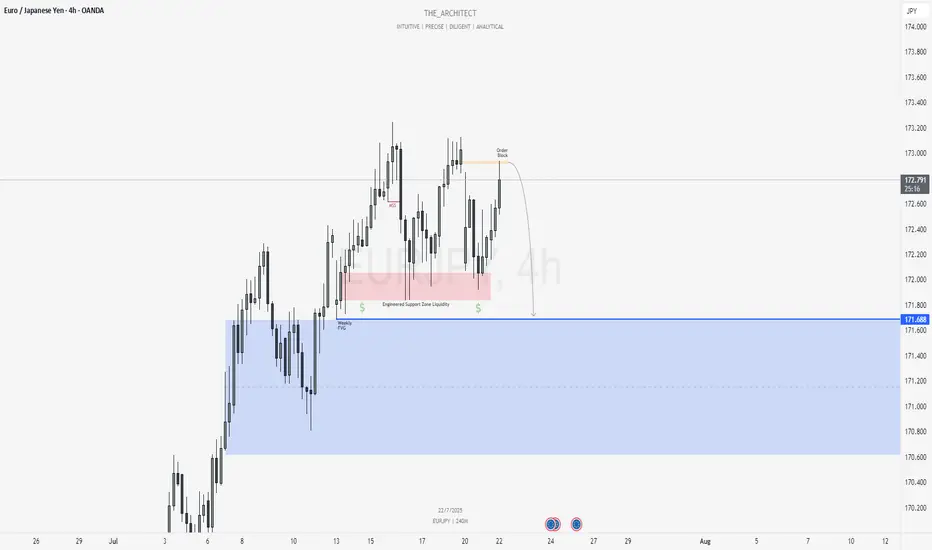
EURJPY: MSS on H4 Signals Bearish Shift Toward Weekly FVGGreetings Traders,
In today’s analysis of EURJPY, we observe that a Market Structure Shift (MSS) has recently occurred on the H4 timeframe, indicating a potential change in directional bias. This suggests that price may begin to draw toward the Weekly Fair Value Gap (FVG), presenting a favorable opportunity to align with bearish order flow.
Higher Timeframe Context:
The weekly timeframe currently shows an unfilled Fair Value Gap (FVG) to the downside, acting as the primary draw on liquidity. This macro bearish draw adds weight to the idea of shorting the pair from premium levels. On the H4—our intermediate timeframe—we now have structural confirmation via a bearish MSS, aligning the two timeframes toward downside targets.
Key Observations on H4:
Bearish Order Block in Premium: Price has recently retraced into an H4 bearish order block situated within premium pricing. This zone acts as institutional resistance and is currently showing signs of rejection.
Confirmation Zone: This H4 bearish order block is being monitored for M15 confirmation entries, as we look for price to break lower from this key institutional level.
Engineered Support & Resting Liquidity: Just above the weekly FVG lies an engineered support zone—characterized by equal lows—suggesting that liquidity has been pooled there. This area serves as a high-probability draw for institutional price delivery.
Trading Plan:
Entry Strategy: Seek lower timeframe (M15) confirmation around the H4 bearish order block before initiating short positions.
Targets: The first target lies at the H4 internal liquidity pool within discounted pricing. The longer-term objective is the weekly FVG, where liquidity is likely to be delivered next.
For a detailed analysis, please watch this weeks Forex Outlook:https://tradingview.sweetlogin.com/chart/EURNZD/BZC9xW1L-July-21-Forex-Outlook-Don-t-Miss-These-High-Reward-Setups/
Maintain patience, follow your confirmation rules, and always adhere to sound risk management principles.
Kind Regards,
The_Architect 🏛️📉
UP TREND Simple up trend that is being followed and respected here by the price , we BULLS are in control
EURJPY in bullish trend EURJPY in bullish trend, potential reversal setup Entry with sell stop. RR 1:1

EURJPY buysHello everyone,
I am looking for eurjpy buys only because on the 15 min chart, price decided to take out EQL's to go long thus creating a big bullish move which has been marked in yellow and annotated.
Price than made this wedge liquidity zone where both EQL's and EQH's are present so we believe outside of this range is where the liquidity actually is.
4hr and 15 min demand zone is still untouched so we're looking for the buy around the 171.185 area to be precise.
I will be putting up screenshots as well so that it makes sense.

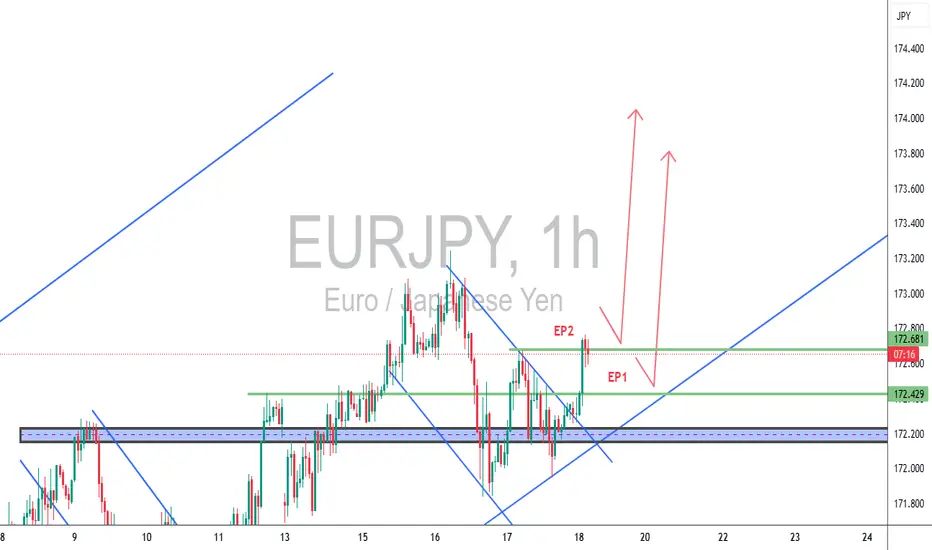
EURJPY – TCB Setup (Higher Timeframe Validation)🕐 EURJPY – TCB Setup (Higher Timeframe Validation ✅)
Strategy: Trend → Countertrend → Breakout (TCB)
Timeframe: 1H
Status: Breakout confirmed — now watching EP1/EP2 for clean entry signals
🔍 Setup Breakdown:
📈 Trend: Clean bullish channel structure still intact
↘️ Countertrend: Descending wedge fully broken to the upside
🚀 Breakout: Price is now testing key structure → breakout above 172.429 & 172.681 zones
📌 Trade Plan:
EP1: 172.429 — safer, structure-based retest
EP2: 172.681 — aggressive entry if price holds above
SL: 172.150
TP1: 173.400
TP2: 174.000
R:R: 1:2.5+ depending on entry location
Checklist Score: 95% — confirmed breakout, now waiting for execution model in NY or Asia session
🧠 TCB Note:
Higher timeframe confluence makes this setup stronger. Look for price action confirmation (e.g. bullish engulfing or rejection wicks) at EP1/EP2 before executing.
#EURJPY #ForexTCB #BreakoutTrading #PriceActionFX #SmartMoneyFlow
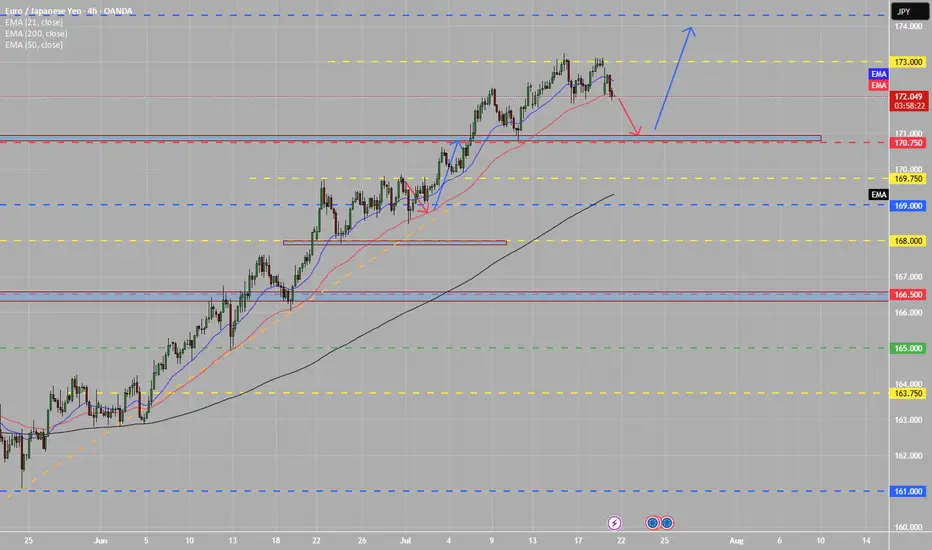
EJ BULLISH SETUP Looking for a nice retest at the daily support zone, if this holds true price will start to look for monthly resistance marked in blue.
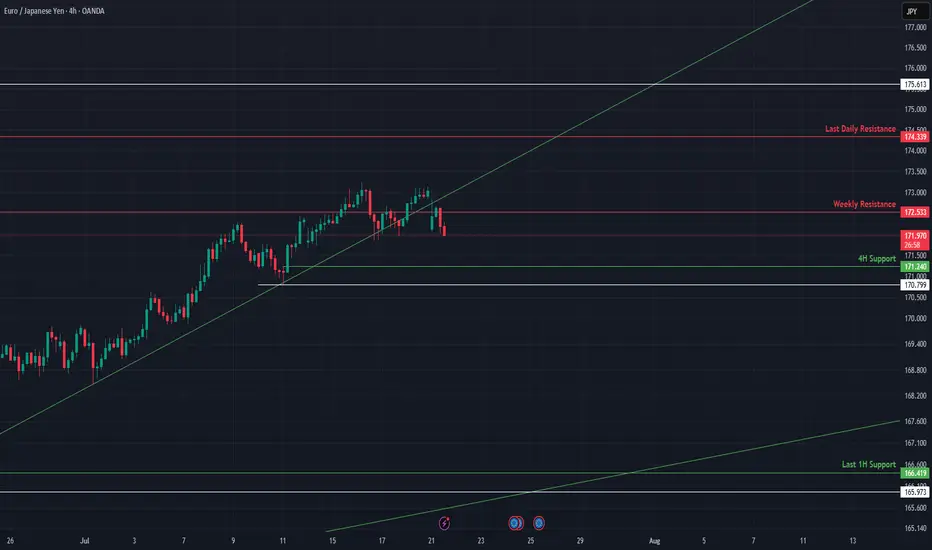
EURJPY at Risk of Breakdown Below Key Support📈 EURJPY Approaches Key Technical Breakout Point
EURJPY is caught between a critical 4H support and weekly resistance, with momentum beginning to compress. The next move hinges on whether price holds the rising trendline or breaks beneath it. This update outlines the active structure, key levels, and macro narrative around JPY weakness.
🔍 Technical Analysis:
EURJPY recently rejected from weekly resistance at 172.53 and is now sitting on the 4H support at 171.24, right above an ascending trendline. The structure remains bullish while this trendline holds, but a breakdown below 170.77 would flip the bias.
On the upside, reclaiming 172.53 opens the path toward 174.33 (Last Daily Resistance). If support gives way, expect a drop toward 166.80 or lower.
🛡️ Support Zones (if pullback continues):
🟢 171.24 – 4H Support (High Risk)
Immediate support. Good for tight risk scalps.
Stop-loss: Below 170.77
🟡 166.89 – 165.27 – 1H Last Support (Medium Risk)
Strong historical base + diagonal confluence. Favorable for intraday or swing entries.
Stop-loss: Below 165.00
🔼 Resistance Levels:
🔴 172.53 – Weekly Resistance
Key rejection point. Break above this confirms upside continuation.
🔴 174.33 – Last Daily Resistance
Major supply zone. Bullish breakout target.
🧭 Outlook:
Bullish Case:
Hold above 171.24 and break 172.53 = upside continuation toward 174.33.
Bearish Case:
Break below 170.77 and failure to reclaim = possible slide toward 166.80 and below.
Bias:
Neutral–bullish while price holds above trendline. Flip bearish on close below 170.77.
🌍 Fundamental Insight:
JPY remains weak due to BoJ’s ultra-loose stance. However, intervention risk remains elevated if yen depreciation becomes disorderly. Euro remains supported by ECB’s hawkish tone and improving economic data. Watch for BOJ rhetoric and global yield shifts.
✅ Conclusion:
EURJPY is resting at a structural pivot between 4H support and weekly resistance. A breakout in either direction will likely determine the trend into August. Bulls must defend the trendline and 171.24 to stay in control.
Not financial advice. Like & follow for more high-probability setups across FX majors.
short eurjpysell eurjpy targetting 100% fib level as tp1. even though it is a weekly analysis, i dont intend to stay in it for more than a week

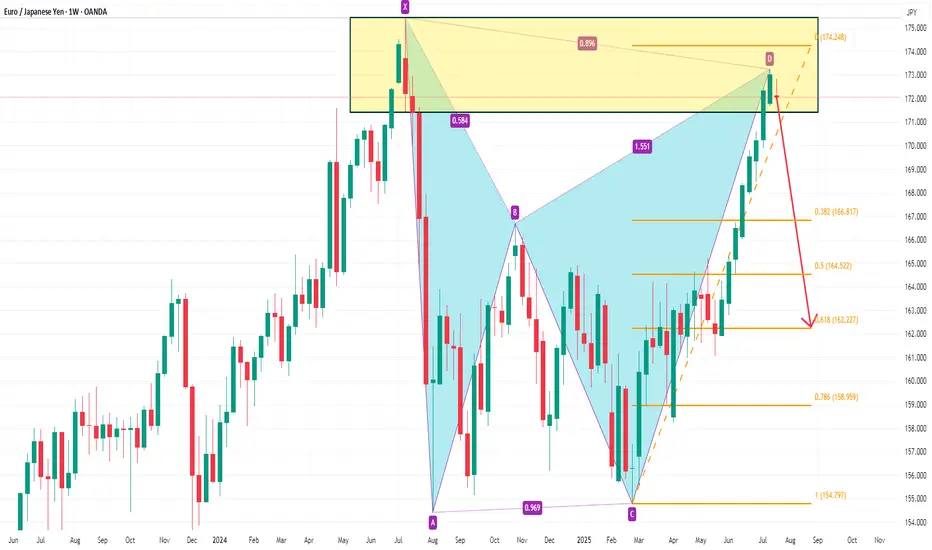
EURJPY Bearish Bat PatternOn the weekly chart, EURJPY has currently formed a bearish bat pattern, and short selling can be considered at present. The downside target is around 166.8. After breaking through, the support below is around 162.2.
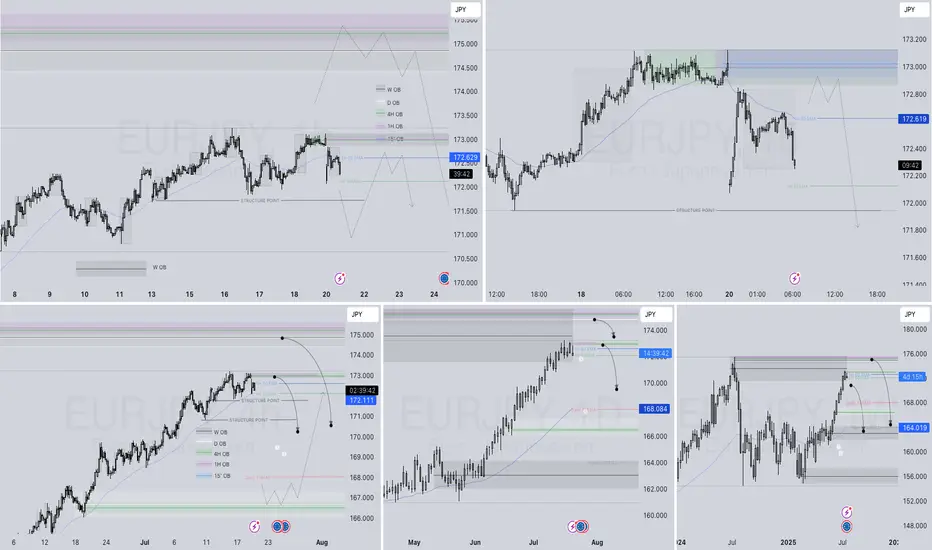
EURJPY Q3 | D21 | W30 | Y25📊EURJPY Q3 | D21 | W30 | Y25
Daily Forecast 🔍📅
Here’s a short diagnosis of the current chart setup 🧠📈
Higher time frame order blocks have been identified — these are our patient points of interest 🎯🧭.
It’s crucial to wait for a confirmed break of structure 🧱✅ before forming a directional bias.
This keeps us disciplined and aligned with what price action is truly telling us.
📈 Risk Management Protocols
🔑 Core principles:
Max 1% risk per trade
Only execute at pre-identified levels
Use alerts, not emotion
Stick to your RR plan — minimum 1:2
🧠 You’re not paid for how many trades you take, you’re paid for how well you manage risk.
🧠 Weekly FRGNT Insight
"Trade what the market gives, not what your ego wants."
Stay mechanical. Stay focused. Let the probabilities work.
FRGNT 📊