JPYUSD trade ideas
Fundamental Market Analysis for June 30, 2025 USDJPYThe USD/JPY pair is attracting some sellers towards 143.85 during the Asian session on Monday. The U.S. dollar (USD) is weakening against the Japanese yen (JPY) amid rising bets for a Federal Reserve (Fed) interest rate cut.
The United States (US) and China are close to a deal on tariffs. However, U.S. President Donald Trump abruptly ended trade talks with Canada, adding uncertainty to the market's positive outlook.
In addition, traders are betting that the U.S. central bank will cut rates more frequently and possibly sooner than previously expected. Markets estimate the probability of a quarter-point Fed rate cut at nearly 92.4%, up from 70% a week earlier.
On the data side, the personal consumption expenditure (PCE) price index rose 2.3% in May, up from 2.2% in April (revised from 2.1%), the U.S. Bureau of Economic Analysis reported Friday. This value matched market expectations. Meanwhile, the core PCE price index, which excludes volatile food and energy prices, rose 2.7% in May, following a 2.6% increase (revised from 2.5%) seen in April.
On the other hand, the Bank of Japan's (BoJ) cautious stance on interest rate hikes could put pressure on the yen and create a tailwind for the pair.
Trade recommendation: SELL 143.50, SL 144.30, TP 142.40
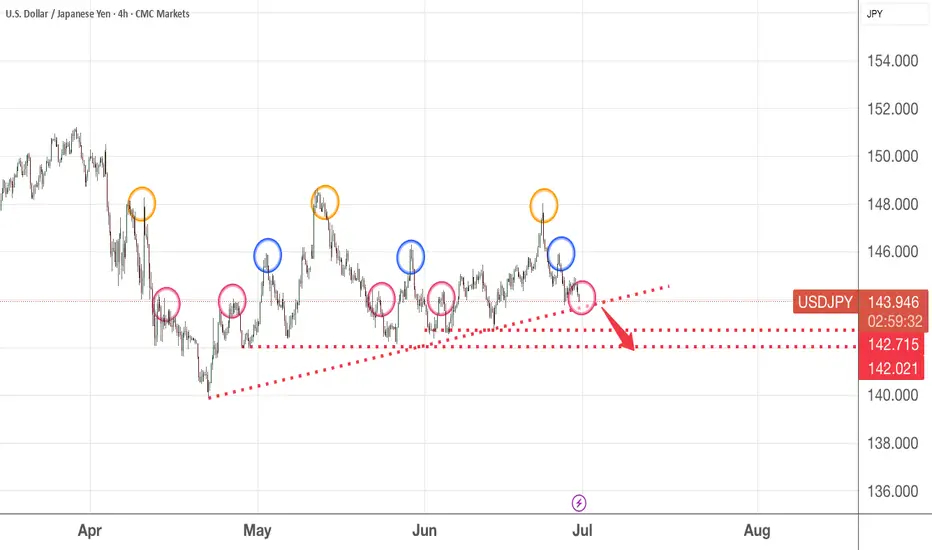
Interesting pattern found in USDJPY 4H chartIn this 4H chart, if you observe closely - the orange circle shows the peak at 148 price level
then, it falls to the blue circle at 146 price level before settling lower at the 143 price level. This is also where we are now.
I believe it is likely to break down further for which I have indicated a potential profit target.
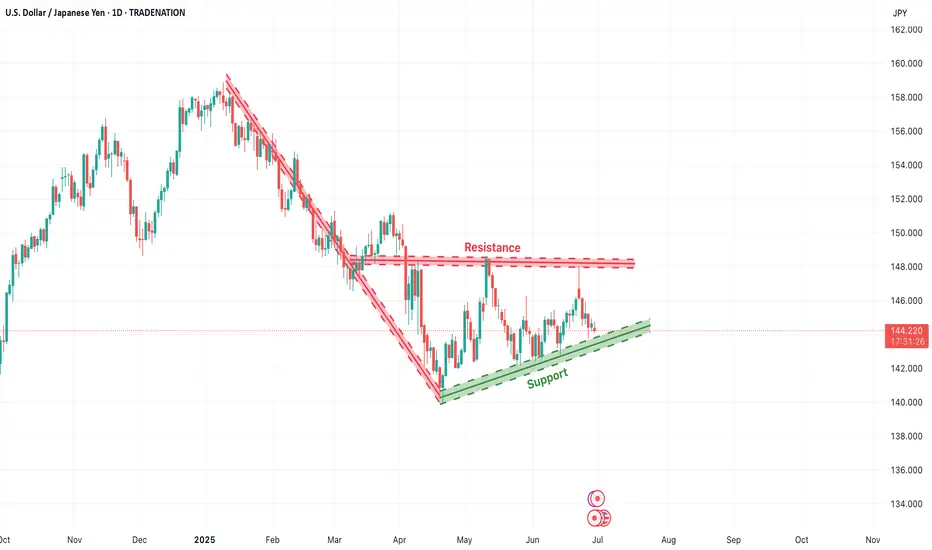
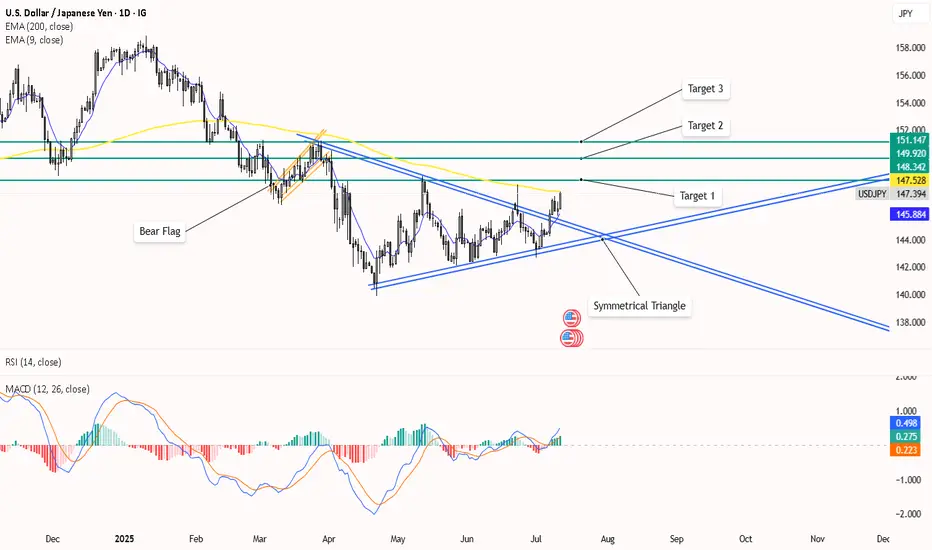
USD/JPY Consolidation Triangle – Breakout WatchThe USD/JPY pair is currently trading inside a well-formed symmetrical triangle pattern on the daily chart. This structure typically forms when the market is in a phase of consolidation, with neither buyers nor sellers able to break the range. Price is compressing between a horizontal resistance zone (~146.50) and a rising support line (~143.50), indicating that a breakout in either direction may be imminent.
This triangle has formed after a sharp downtrend, followed by a broad base formation. Such setups often precede a decisive move, especially if accompanied by volume.
🔼 Upside Breakout Scenario
If price breaks and closes above the resistance zone (above 146.50–147.00) with bullish confirmation, we can expect momentum to shift in favor of buyers. A confirmed breakout would open the path toward 150.00+, possibly even retesting the highs of 2024 near 152.00. This would be seen as a bullish reversal after a prolonged downtrend.
🔽 Downside Breakdown Scenario
Alternatively, if price fails to hold the rising trendline and breaks below the 143.00–142.50 support zone, it may confirm a bearish breakdown. This would suggest a continuation of the earlier downtrend with fresh bearish momentum targeting 140.00 and lower levels.
🧭 Trade Strategy Consideration
Bullish Plan: Buy breakout above 147.00 with SL below 145.50 and TP near 150.50–152.00
Bearish Plan: Sell breakdown below 142.50 with SL above 144.00 and TP near 140.00–138.00
Neutral Bias: Wait for breakout confirmation; no trade inside the triangle
This is a tight volatility setup where breakout traders should stay alert. The longer the consolidation, the stronger the breakout move tends to be.
=================================================================
Disclosure: I am part of Trade Nation's Influencer program and receive a monthly fee for using their TradingView charts in my analysis.
=================================================================
USDJPYThis could become a trade, but it requires the market to return to our setup and provide a good risk-to-reward opportunity. Further downside is possible, but a reversal is not out of the question..
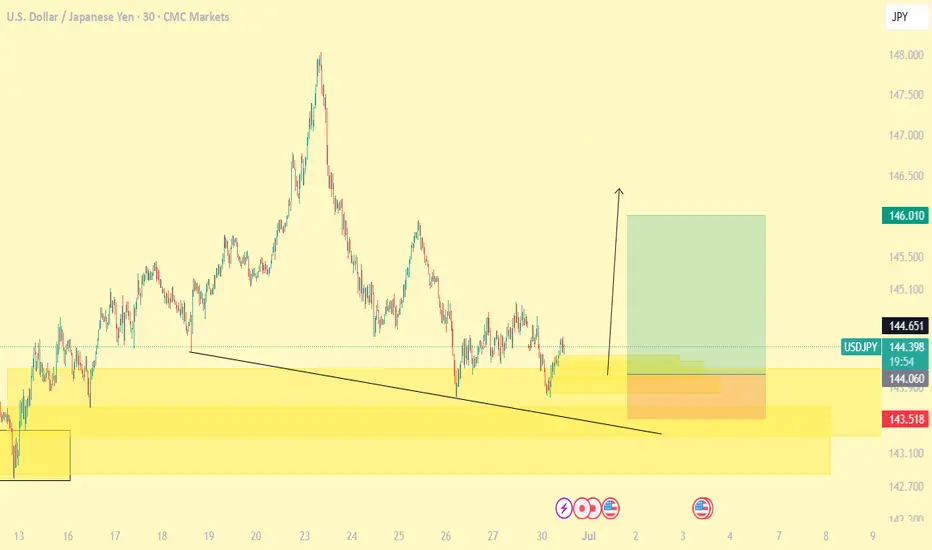
USDJPY| - Bullish Play Within Bearish HTF ContextHTF Overview (4H): Structure is still technically bearish, with buy-side liquidity (BSL) untouched and a major 4H supply OB unmitigated above. Expecting price to seek out that zone before any full reversal.
MTF Refinement (30M): Refined structure shows a potential bullish leg forming to push toward the 4H supply. Price is reaching for nearby sell-side liquidity (SSL), acting as inducement.
Execution Plan: Waiting for a clean sweep of SSL. Once that occurs and the 30M OB is mitigated, I’ll drop to LTF (1M/5M) to confirm bullish intent with CHoCH or BOS before executing a long.
Mindset: Playing the internal bullish wave with precision while respecting higher timeframe narrative. Quick to react if the HTF bias reasserts itself.
Bless Trading!
USD/JPY(20250714)Today's AnalysisMarket news:
① Fed's Goolsbee: The latest tariff threat may delay rate cuts. ② The Fed responded to the White House's "accusations": The increase in building renovation costs partly reflects unforeseen construction conditions. ③ "Fed's megaphone": The dispute over building renovations has challenged the Fed's independence again, and it is expected that no rate cuts will be made this month. ④ Hassett: Whether Trump fires Powell or not, the Fed's answer to the headquarters renovation is the key.
Technical analysis:
Today's buying and selling boundaries:
147.02
Support and resistance levels:
148.39
147.88
147.55
146.49
146.15
145.64
Trading strategy:
If the price breaks through 147.55, consider buying, and the first target price is 147.88
If the price breaks through 147.02, consider selling, and the first target price is 146.49
USD/JPY) LOGN TIME Analysis Read The captionSMC trading point update
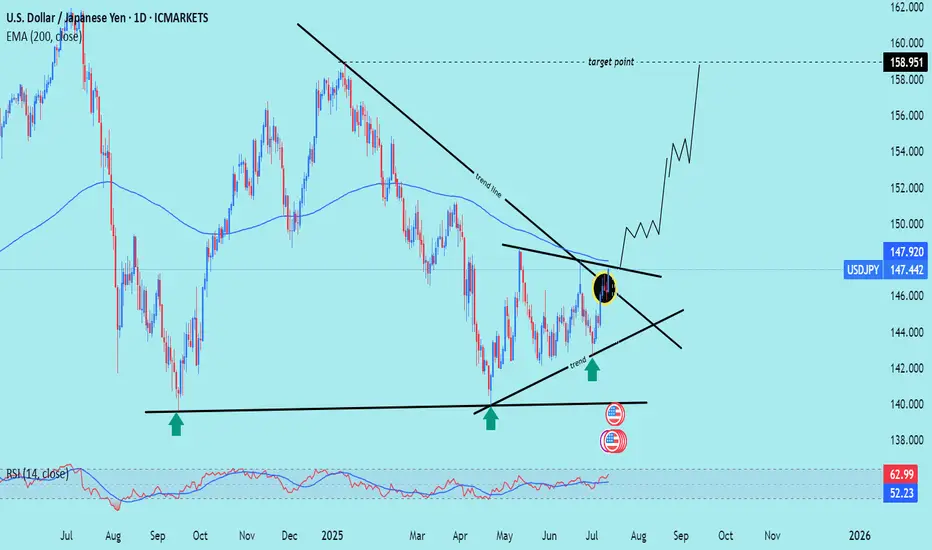
Technical analysis of USD/JPY on the daily timeframe, highlighting a long-term downtrend reversal with potential for significant upside.
---
Analysis Summary
Pair: USD/JPY
Timeframe: Daily
Current Price: 147.442
Bias: Bullish breakout from a descending wedge structure.
---
Key Technical Insights
1. Descending Trendline Break:
Price has broken above the long-term downtrend line, signaling a reversal.
Breakout area is circled in yellow, confirming bullish intent.
2. Trendline & Structure Support:
Multiple rejections from the ascending support trendline (marked by green arrows) confirm accumulation and higher lows.
3. 200 EMA as Dynamic Resistance/Support:
Price is now above the 200 EMA (147.920) — a bullish signal, turning resistance into support.
4. RSI (14):
RSI at 62.99, approaching overbought territory, but still has room to push further.
---
Target Point
Target: 158.951
Based on measured move from wedge breakout and historical resistance level.
---
Trade Setup Idea
Direction Entry Stop-Loss Target
Buy 147.40–147.60 Below 145.80 158.95
Mr SMC Trading point
---
Summary
This chart signals a major bullish breakout on USD/JPY, with the break of a year-long downtrend structure, reclaiming the 200 EMA. If this breakout sustains, price could aim for 158.95 in the coming weeks.
Please support boost 🚀 this analysis)
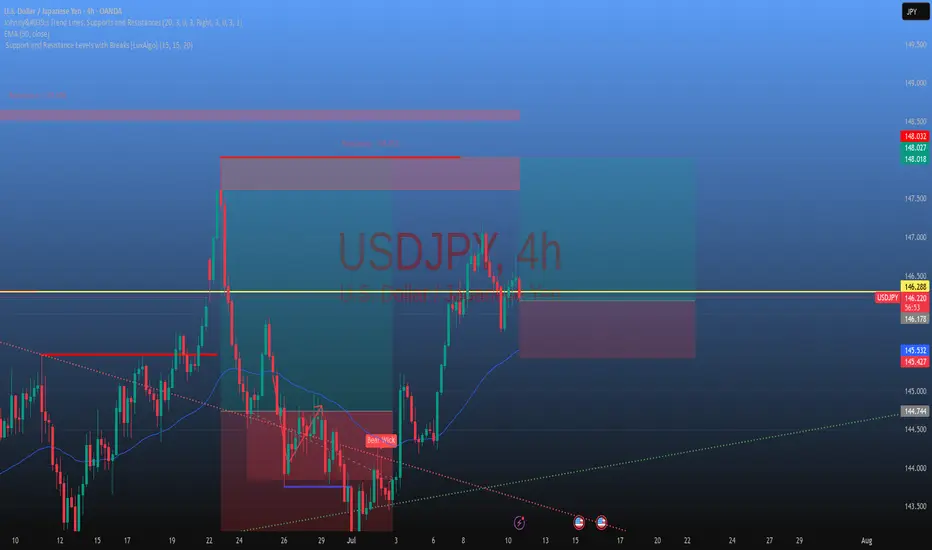
USDJPY LONG & SHORT – WEEKLY FORECAST Q3 | W29 | Y25
💼 USDJPY LONG & SHORT – WEEKLY FORECAST
Q3 | W29 | Y25
📊 MARKET STRUCTURE SNAPSHOT
USDJPY is currently reaching for a key higher time frame supply zone, looking for price action to show weakness at premium levels. Structure and momentum are now aligning for a short opportunity backed by multi-timeframe confluence.
🔍 Confluences to Watch 📝
✅ Daily Order Block (OB)
Looking for Strong reaction and early signs of distribution.
✅ 4H Order Block
Break of internal structure (iBoS) confirms a short-term bearish transition.
✅ 1H Order Block
📈 Risk Management Protocols
🔑 Core principles:
Max 1% risk per trade
Only execute at pre-identified levels
Use alerts, not emotion
Stick to your RR plan — minimum 1:2
🧠 You’re not paid for how many trades you take, you’re paid for how well you manage risk.
🧠 Weekly FRGNT Insight
"Trade what the market gives, not what your ego wants."
Stay mechanical. Stay focused. Let the probabilities work.
🏁 Final Thoughts from FRGNT
📌 The structure is clear.
The confluences are stacked.
Let execution follow discipline, not emotion.
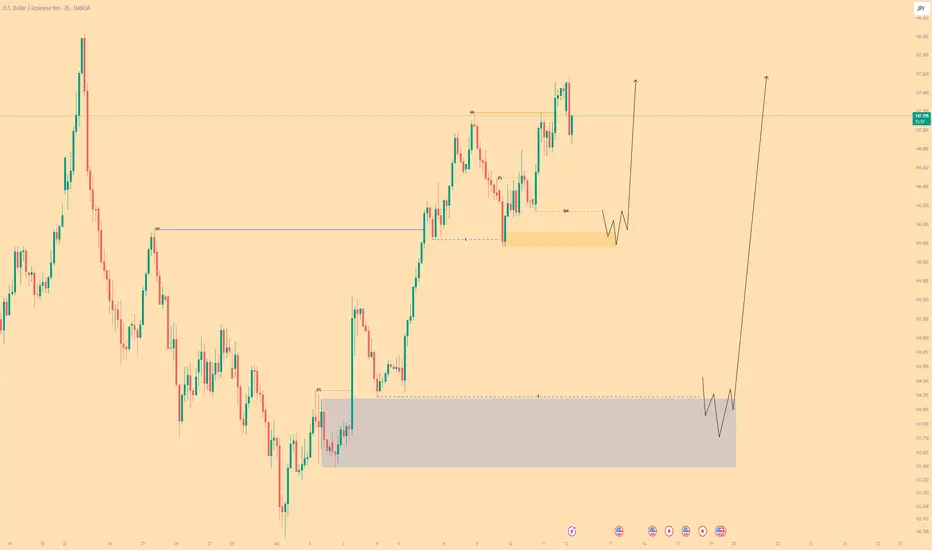
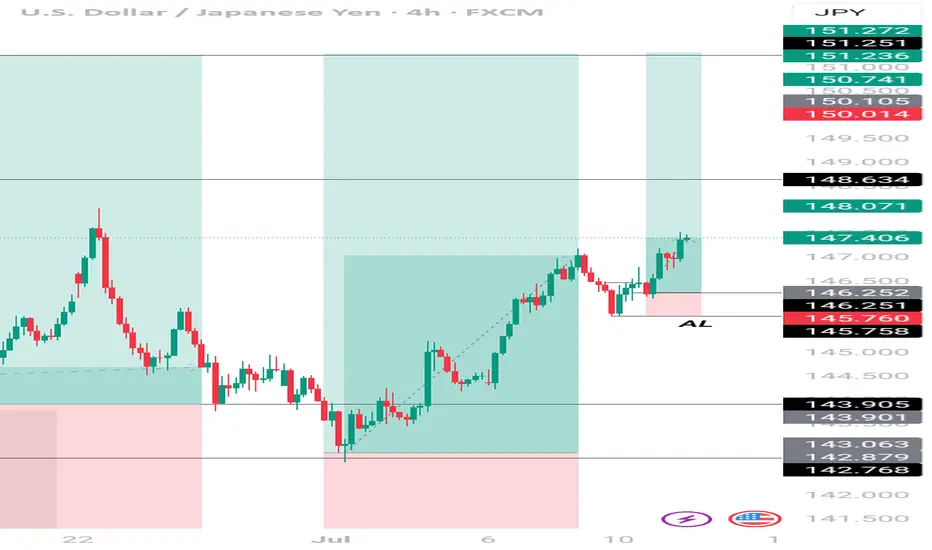
USDJPY Analysis : Major Move Loading Towards Target Zone🕵️♂️ Overview
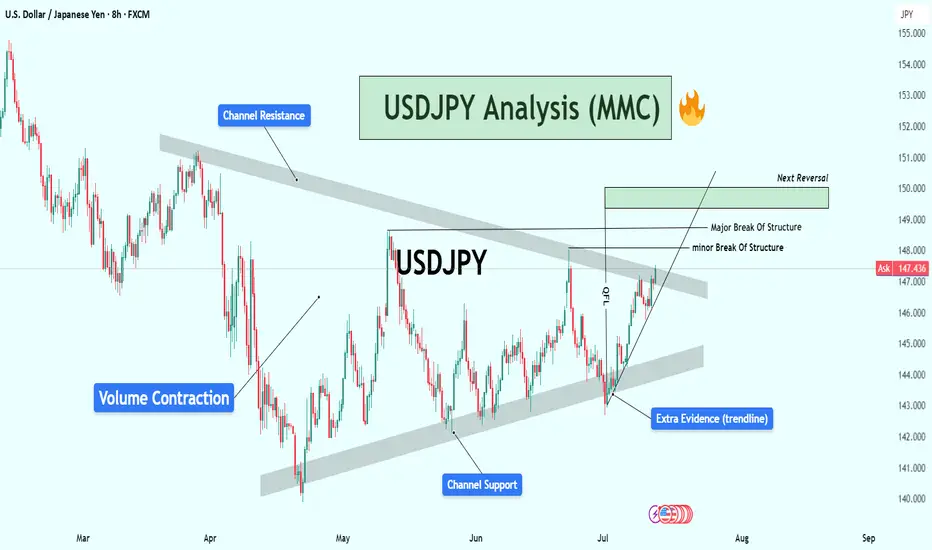
The USDJPY pair is approaching a critical turning point within a well-established descending channel structure. After several months of corrective movement and internal structure shifts, the market is now displaying multiple layers of confluence pointing toward an impending major reaction or reversal. Let’s break down this chart step by step.
🧱 Market Structure Analysis
🔹 Descending Channel:
The entire chart is governed by a broad descending channel, with price making lower highs and lower lows since early March.
Each touch of the channel support has led to a bounce, and the price is now once again near channel resistance, creating a possible reaction zone.
🔹 Volume Contraction Phase:
In the mid-section of the chart, we observe volume contraction, indicating liquidity drying up and buyers/sellers entering a phase of uncertainty.
This contraction is typical in accumulation or re-accumulation phases, which often precede strong impulsive moves — exactly what followed here.
🧩 Structural Breaks and Trendline Clarity
🔸 Minor Break of Structure:
A recent high was taken out in early July, marking a minor break of structure (BOS), showing the first signs of bulls taking short-term control.
🔸 Major Break of Structure:
A more significant high (marked on the chart) has also been broken, confirming a major BOS — this implies institutional positioning or a shift in market sentiment.
🔸 Trendline Break – Extra Confirmation:
The bullish push came after breaking a clean internal trendline, which acted as diagonal resistance.
Once this trendline broke, price aggressively accelerated upward — this is a classic market maker cycle (MMC) Phase 2 (expansion) move.
📍 Confluence at Next Reversal Zone (149.00 – 150.00)
The green highlighted zone is the next potential area for bearish pressure to return, based on:
Key Supply Zone: Historical area where sellers previously dominated.
Channel Resistance Confluence: Top of the descending channel aligns with this zone.
Psychological Level: 150.00 is a major psychological round number — often attracts profit-taking and institutional activity.
Fibonacci (if plotted): Likely 78.6% – 88.6% retracement from last swing high.
Overextended Rally: Price has rallied strongly since early July with very little correction — it’s approaching exhaustion.
🔄 Market Maker Cycle (MMC) Alignment
This move perfectly reflects the Market Maker Cycle:
Accumulation: During volume contraction phase.
Manipulation: Fakeouts near channel support to trap shorts.
Expansion: Break of structure + trendline, aggressive rally.
Distribution (Next): Likely to occur at the 149–150 zone with a sharp rejection.
🧠 Trader’s Plan – What to Look For
📈 If Bullish:
Targets: 148.80 to 149.80 zone
Hold until rejection signs (bearish candles, volume spikes, divergences)
SL: Below recent swing low/trendline (~146.00)
📉 If Bearish (After Rejection):
Watch for:
Strong bearish engulfing candle or shooting star
RSI/MACD divergence (not shown but suggested)
Break of short-term ascending trendline
Targets: Back toward 145.50 or mid-channel (dynamic)
🔖 Summary
USDJPY is showing clear signs of bullish exhaustion near the upper channel resistance and major structure levels. If price respects this zone (149–150), expect a healthy corrective leg or full reversal. Multiple layers of technical evidence, including structure breaks, trendline breach, and MMC phases, are aligning for a high-probability play.
This is a textbook setup for experienced traders watching key zones with proper confirmations.
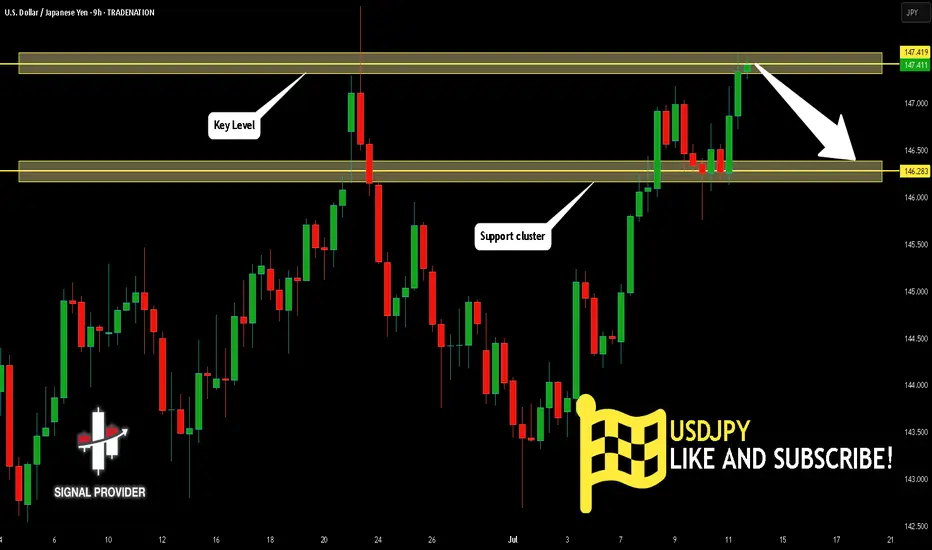
USDJPY Is Very Bearish! Short!
Take a look at our analysis for USDJPY.
Time Frame: 9h
Current Trend: Bearish
Sentiment: Overbought (based on 7-period RSI)
Forecast: Bearish
The market is testing a major horizontal structure 147.419.
Taking into consideration the structure & trend analysis, I believe that the market will reach 146.283 level soon.
P.S
Please, note that an oversold/overbought condition can last for a long time, and therefore being oversold/overbought doesn't mean a price rally will come soon, or at all.
Disclosure: I am part of Trade Nation's Influencer program and receive a monthly fee for using their TradingView charts in my analysis.
Like and subscribe and comment my ideas if you enjoy them!
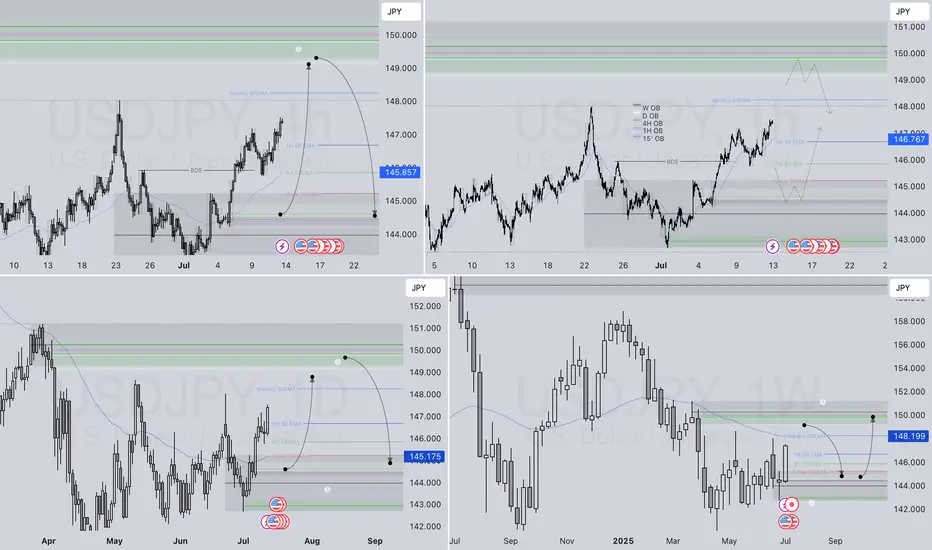
USDJPY MULTI TIME FRAME ANALYSISHello traders , here is the full multi time frame analysis for this pair, let me know in the comment section below if you have any questions , the entry will be taken only if all rules of the strategies will be satisfied. wait for more price action to develop before taking any position. I suggest you keep this pair on your watchlist and see if the rules of your strategy are satisfied.
🧠💡 Share your unique analysis, thoughts, and ideas in the comments section below. I'm excited to hear your perspective on this pair .
💭🔍 Don't hesitate to comment if you have any questions or queries regarding this analysis.

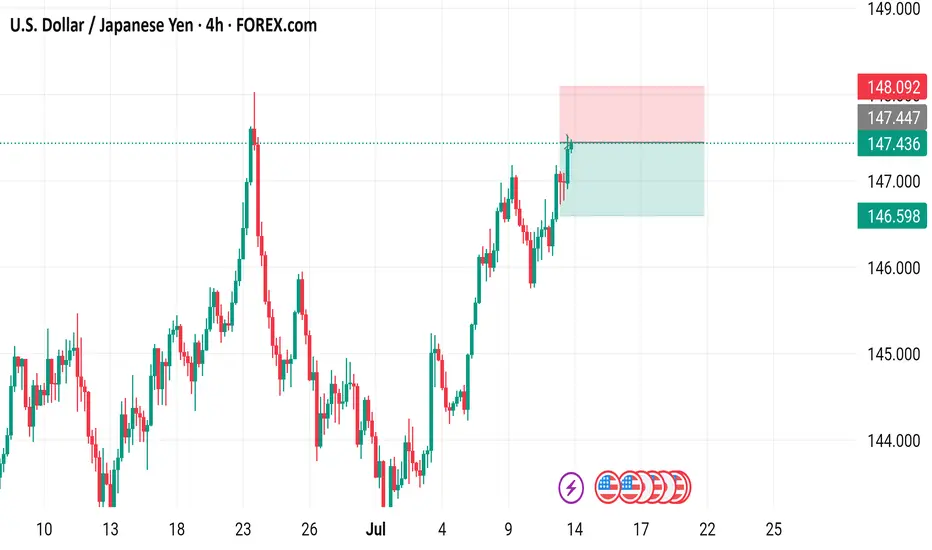
USD/JPY 4-Hour Forex Chart4-hour performance of the U.S. Dollar (USD) against the Japanese Yen (JPY) from late June to mid-July 2025, sourced from FOREX.com. The current exchange rate is 147.436, with a 1.178 (+0.81%) increase. Key levels include a sell price of 147.393 and a buy price of 147.479. The chart shows a recent upward trend with a resistance zone highlighted between 147.436 and 148.092, and support around 146.598. Candlestick patterns indicate volatility, with notable price movements around early July.
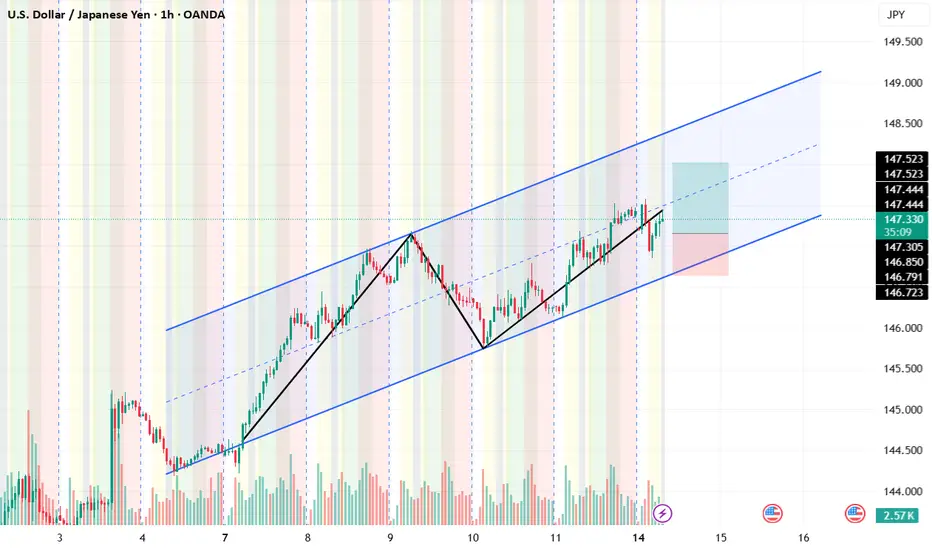
USD/JPY Symmetrical Triangle Breakout.Hello traders,
Just sharing my idea of what might happen next based on the recent price movement.
After a long downtrend this pair started gaining strength after April 2025 and formed a symmetrical triangle.
We can clearly see the breakout on 9 July 2025.
Will this breakout continue ?
Well, its about to touch the 200 Ema only than we can confirm if the bullish momentum keep continue. Price might pullback.
This analysis is based on chart patterns and some indicators like EMA, RSI, MACD and Fibonacci.
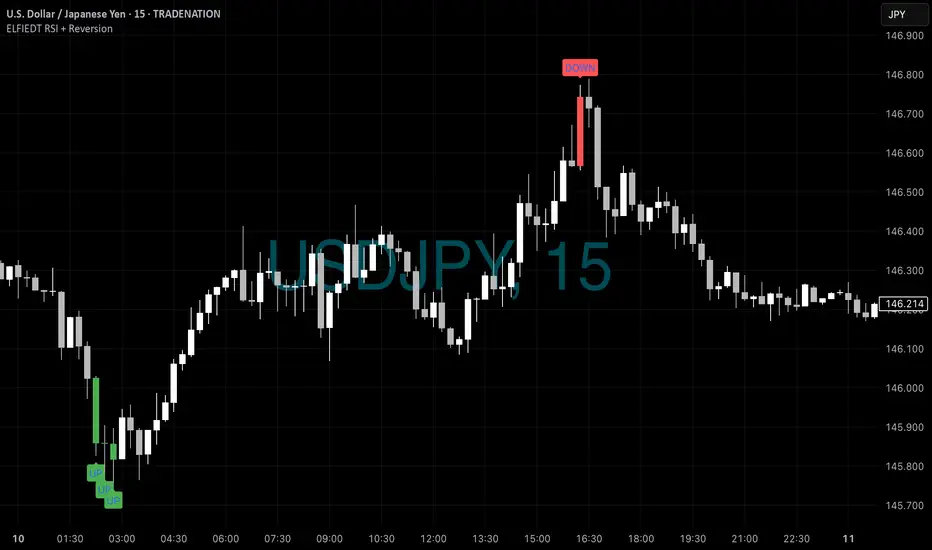
UJ - Long to Short📈 USDJPY 15min – ELFIEDT RSI + Reversion Signal Walkthrough
🧠 Precision Signals | High-Probability Reversals | Real Trades Visualized
This chart showcases how the ELFIEDT RSI + Reversion indicator identified actionable buy and sell opportunities on the 15-minute USDJPY chart.
🟩 Buy Signals: Triple Confluence at Session Lows
In the early hours, the indicator printed three consecutive UP signals around 02:30, marking a sharp reversion zone after a strong decline. This type of signal stack often suggests:
Oversold conditions aligning with broader momentum shifts
A high-probability reversal entry zone
🔹 Hypothetical trade:
Enter long at the close of the third UP signal.
📌 Stop-loss: Just below the swing low of the signal candle
🎯 Exit: On opposing signal (or trailing stop) – delivering a clean upward move from ~145.85 to ~146.90+
🟥 Sell Signal: Precise Top Call
Around 17:15, the indicator printed a DOWN signal at the exact high of the session. This marks exhaustion after an extended rally and primes for a mean reversion short.
🔹 Hypothetical trade:
Enter short at the signal close (~146.85–147.00 range)
📌 Stop-loss: Just above the session high
🎯 Exit: As price reverts to ~146.20 or based on trailing criteria
This single trade could have yielded over 60 pips.
✅ What Makes This Indicator Powerful?
ELFIEDT RSI + Reversion combines proprietary logic with time-tested reversal patterns. The signals are designed to be:
Fast-acting, yet filtered for noise
Non-repainting, and context-aware
Based on unique market conditions, not just raw RSI thresholds
🎁 Want access to more advanced versions?
This is just a public demo of what the ELFIEDT engine can do.
For access to exclusive multi-layered strategies (including divergence, trendline breaks, multi-timeframe filters), reach out directly.
📩 DM to get whitelisted for premium tools available only to select users.
#USDJPY #ReversionTrading #RSI #ForexSignals #ELFIEDT #SmartMoney #MeanReversion #TradingView #FXStrategy
USDJPY SWING BUY USDJPY is going to buy for a while... DYOR but according to my analysis...I'm riding the buy to those levels
USD-JPY Short From Resistance! Sell!
Hello,Traders!
USD-JPY keeps growing but
A strong horizontal resistance
Is ahead around 148.500
So after the retest we will
Be expecting a local
Bearish correction on Monday!
Sell!
Comment and subscribe to help us grow!
Check out other forecasts below too!
Disclosure: I am part of Trade Nation's Influencer program and receive a monthly fee for using their TradingView charts in my analysis.

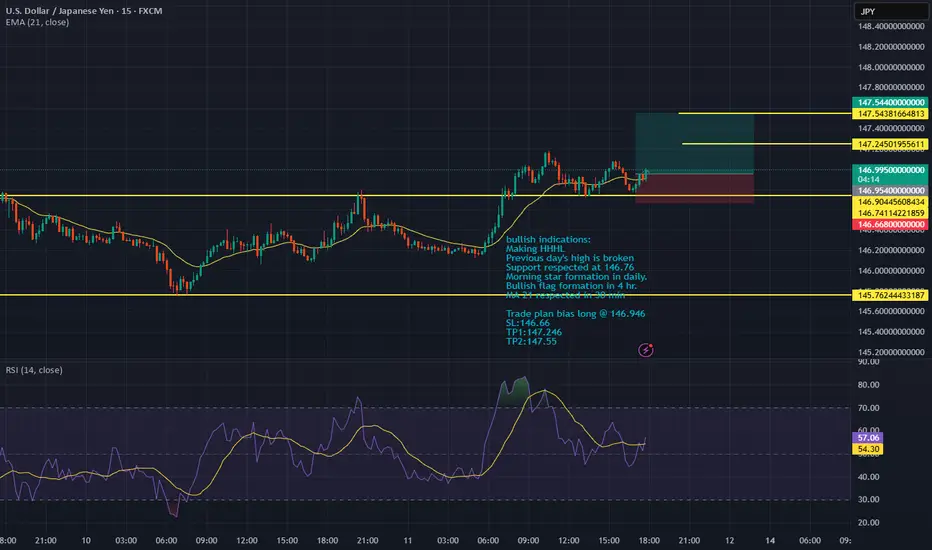
USDJPY-bias long bullish indications:
Making HHHL
Previous day's high is broken
Support respected at 146.76
Morning star formation in daily.
Bullish flag formation in 4 hr.
MA 21 respected in 30 min
Trade plan bias long @ 146.946
SL:146.66
TP1:147.246
TP2:147.55
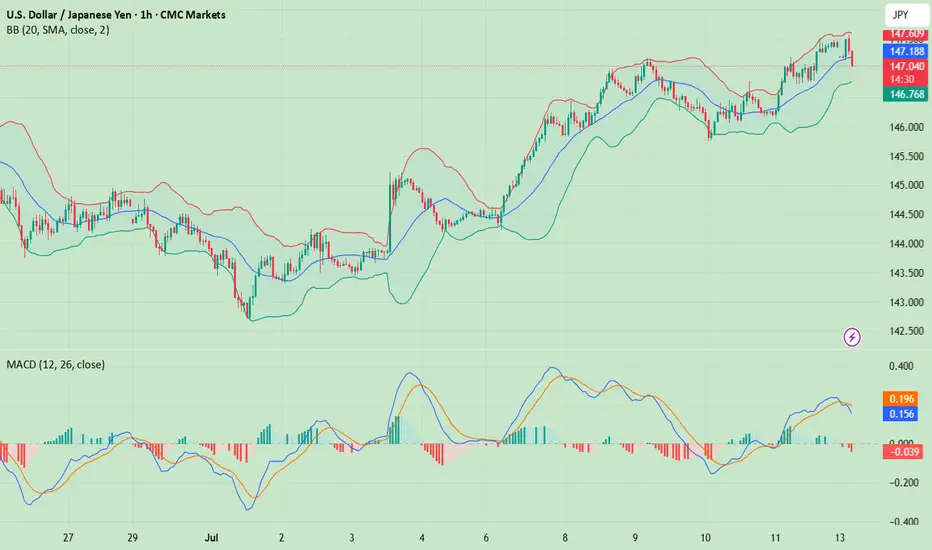
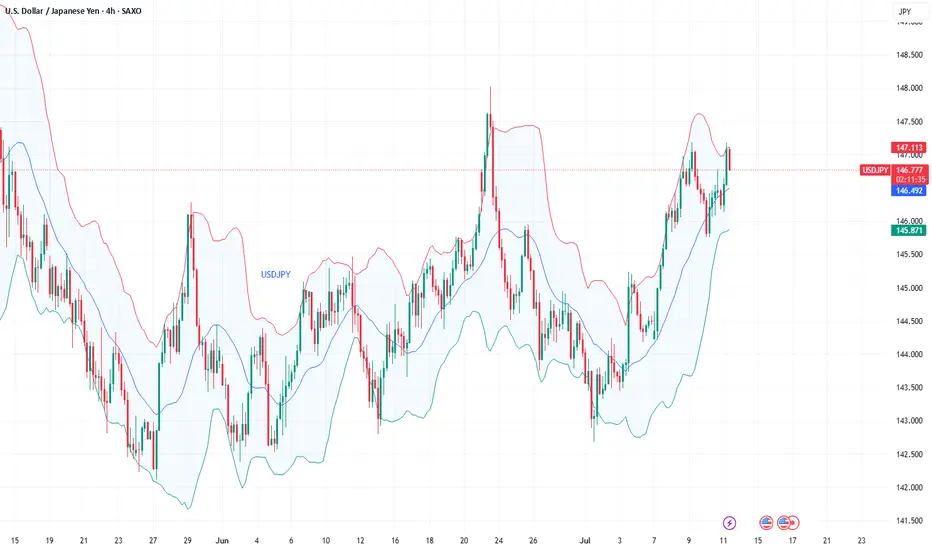
Fundamental Market Analysis for July 11, 2025 USDJPYThe dollar is holding steady at 146.500 against the yen: another rise in US yields and stable demand for safe US assets following comments from the Fed are fueling appetite for the USD, while demand for the JPY remains sluggish.
The tariff front exacerbates the imbalance: the White House has already imposed 25% tariffs on Japanese goods, and new ideas for “umbrella” tariffs are heightening fears of a trade war, forcing investors to flow into financing currencies. Reuters notes that the yen weakened to 146.400, recording a weekly decline of more than 1%.
At the same time, the Bank of Japan is not yet ready for aggressive tightening: a decline in inflation to 1.8% y/y and weak real wage dynamics make it difficult to raise rates above 0.5%. The divergence in monetary policy and expectations for Japanese macro data (machine tool orders, industrial production) until July 14 form the fundamental basis for the pair's growth to 147.500 and above, while the risks of correction are limited to the 145.900 zone.
Trading recommendation: BUY 146.500, SL 145.900, TP 147.500
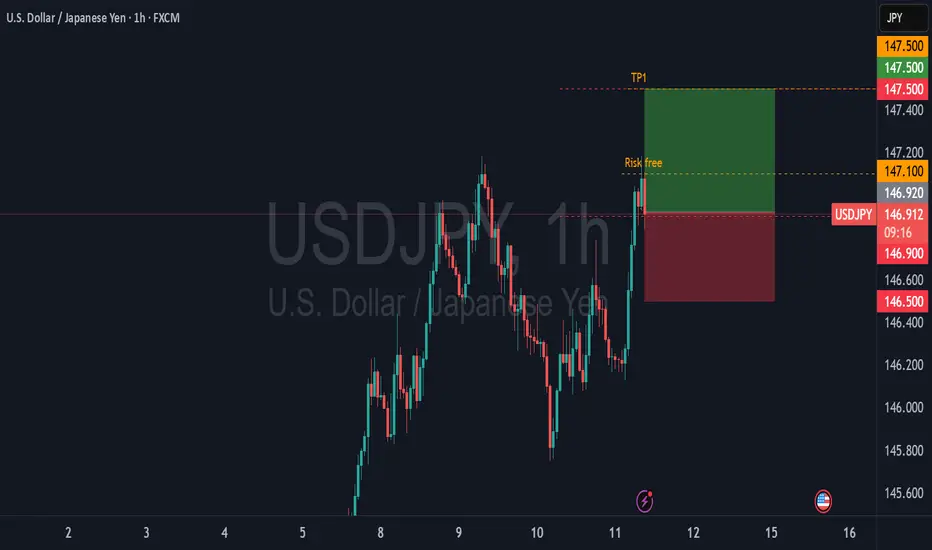
Let’s enter this position with **confidence and discipline**.✅ **The price has cleanly pulled back to 146.900**, which is exactly what we were waiting for.
We are in the **right zone, right signal, right timing.**
Let’s go. 💪📈
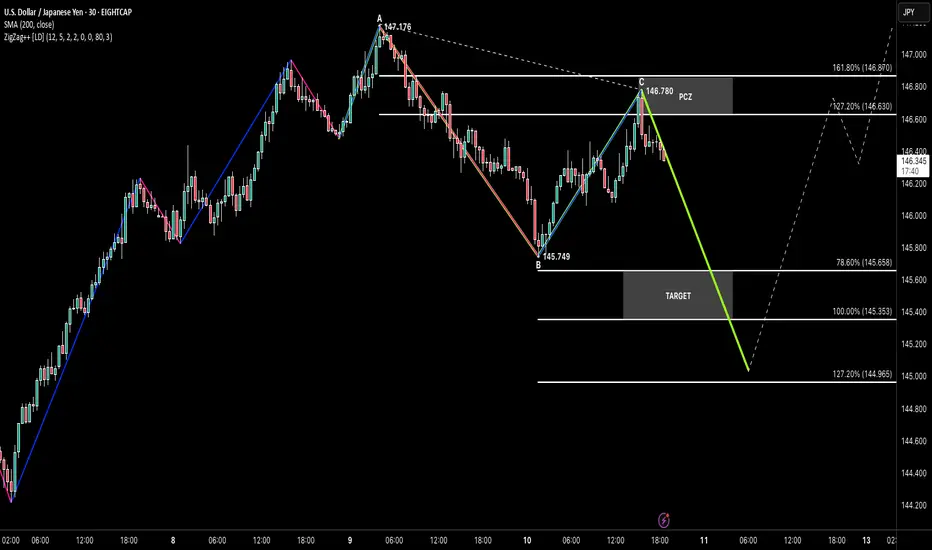
ABCHello traders! 👋
I hope you’re having a fantastic trading week so far. Let’s take a look at the USDJPY setup unfolding right now — and it’s all about classic symmetry.
📌 Setup Breakdown
We’re seeing a textbook ABC Bearish Continuation:
🔹 AB: Sharp move down
🔹 BC: Clean correction back into structure
🔹 CD (Projected): Symmetrical to AB, aiming toward the target zone
Price just tapped into the PCZ (Potential Completion Zone) around the 127.2%–161.8% fib projections — showing early rejection and setting up a potential move lower.
🎯 Target Zone
First Objective: 100% projection (~145.35)
Extended Target: 127.2% (~144.96)
With structure clear and risk above C, the symmetry is doing all the talking.
🧠 Key Factors
✅ Classic ABC symmetry
✅ Strong reaction at PCZ
✅ Risk well-defined
✅ Trend continuation potential
No guesswork — just measured movement within structure.
💬 Final Thoughts
If this plays out, it would be a clean continuation play in line with the overall flow. As always, let the chart guide you — not emotion.
📚 Pattern → Zone → Reaction → Follow-through
Wishing everyone smooth trades ahead. Let’s keep it simple and professional.
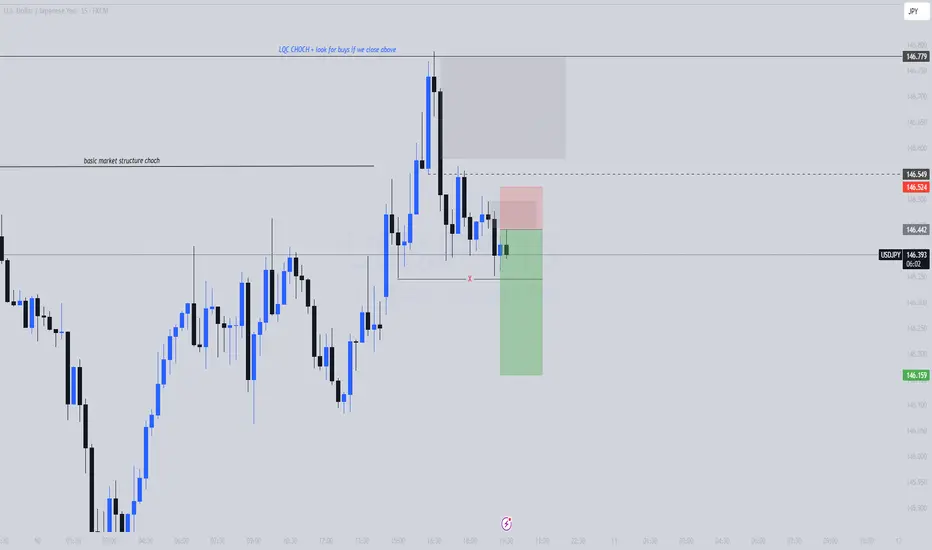
USDJPY| 15| Liquidity Grab + Choch reaction Price formed a basic CHoCH after sweeping sell-side liquidity and creating a temporary low. A short setup was taken from a lower timeframe supply zone, aligned with bearish order flow and rejection at imbalance.
🔹 Sell-side Liquidity Sweep
🔹 CHoCH Confirmation
🔹 Rejection from Supply
🔹 Expecting bearish continuation if price holds below 146.52
Invalidation: If price closes above the LQ CHoCH zone, I’ll shift bias to longs. Until then, I’m holding the short narrative.
#SMC #USDJPY #OrderFlow #LiquiditySweep #FXTradingClub #PriceAction #CHoCH