USDJPY; Heikin Ashi Trade IdeaOANDA:USDJPY
In this video, I’ll be sharing my analysis of USDJPY, using FXAN's proprietary algo indicators with my unique Heikin Ashi strategy. I’ll walk you through the reasoning behind my trade setup and highlight key areas where I’m anticipating potential opportunities.
I’m always happy to receive any feedback.
Like, share and comment! ❤️
Thank you for watching my videos! 🙏
JPYUSD trade ideas

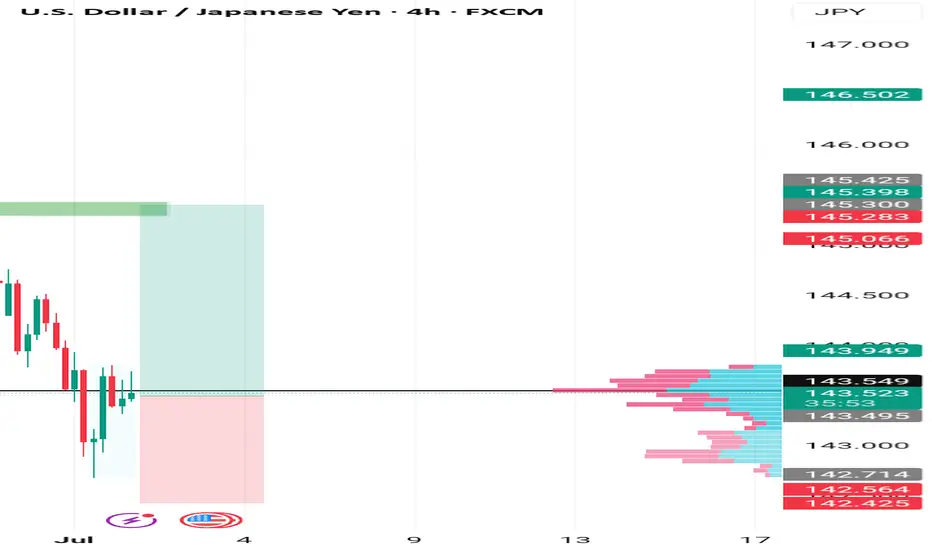
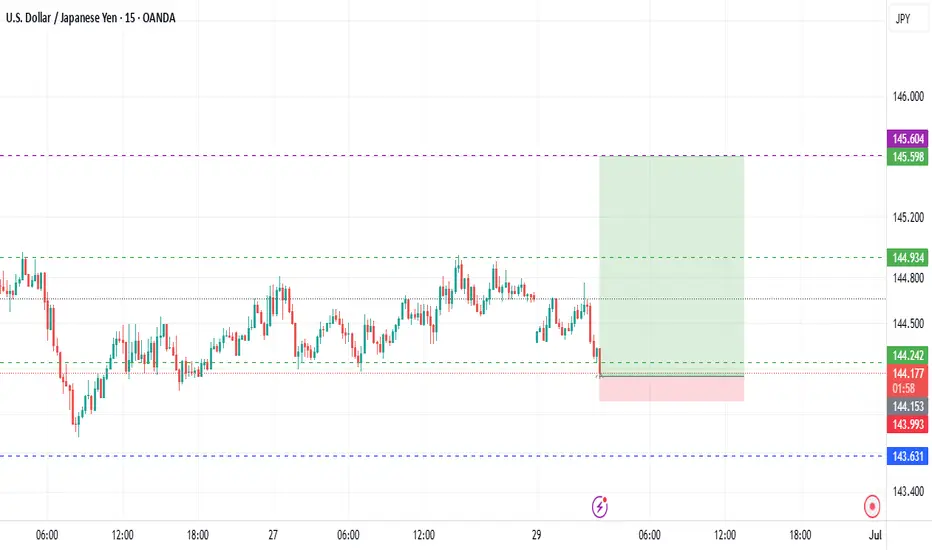
USDJPY-30 Min ChartSell the USDJPY
If rejection occurs here, the downtrend could resume towards the 143.0 support level.
Stop Loss 144.4
JPY Steadies, Trade Optimism Counters Dollar WeaknessThe Japanese yen held near 143.7 against the dollar on Thursday, stabilizing after recent losses, supported by improved trade sentiment and a weaker greenback.
Japan reiterated its aim for a fair trade deal with the US, though Trump raised pressure by threatening tariffs up to 35% on Japanese imports over low US rice and car sales. Meanwhile, a finalized US-Vietnam deal added to market optimism.
The yen also found support as investors awaited key US jobs data, which could increase the odds of a Fed rate cut.
Key levels: Resistance at 145.70; support at 143.55.
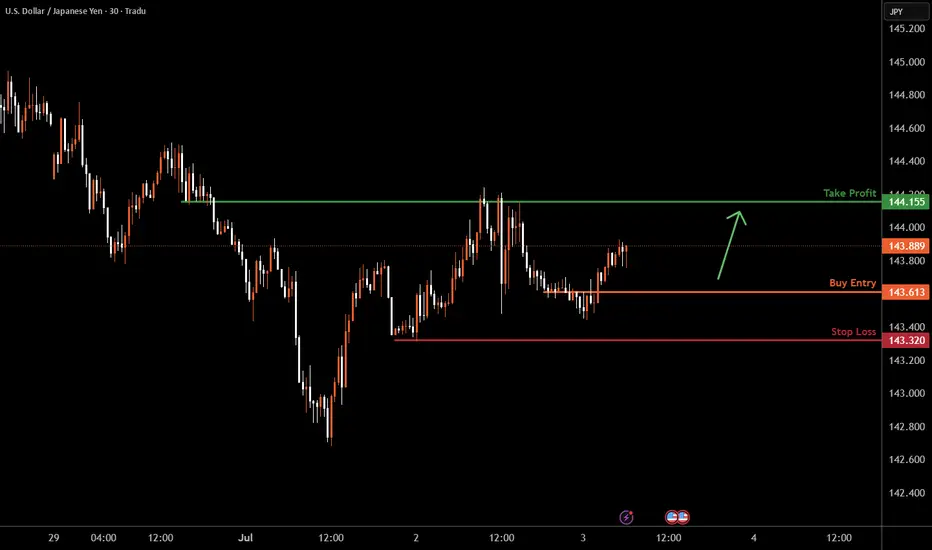
USDJPY M30 I Bullish Bounce Off Based on the M30 chart analysis, the price is falling our buy entry level at 143.61, a pullback support.
Our take profit is set at 144.15, a pullback resistance.
The stop loss is placed at 143.32, a swing low support.
High Risk Investment Warning
Trading Forex/CFDs on margin carries a high level of risk and may not be suitable for all investors. Leverage can work against you.
Stratos Markets Limited (tradu.com ):
CFDs are complex instruments and come with a high risk of losing money rapidly due to leverage. 63% of retail investor accounts lose money when trading CFDs with this provider. You should consider whether you understand how CFDs work and whether you can afford to take the high risk of losing your money.
Stratos Europe Ltd (tradu.com ):
CFDs are complex instruments and come with a high risk of losing money rapidly due to leverage. 63% of retail investor accounts lose money when trading CFDs with this provider. You should consider whether you understand how CFDs work and whether you can afford to take the high risk of losing your money.
Stratos Global LLC (tradu.com ):
Losses can exceed deposits.
Please be advised that the information presented on TradingView is provided to Tradu (‘Company’, ‘we’) by a third-party provider (‘TFA Global Pte Ltd’). Please be reminded that you are solely responsible for the trading decisions on your account. There is a very high degree of risk involved in trading. Any information and/or content is intended entirely for research, educational and informational purposes only and does not constitute investment or consultation advice or investment strategy. The information is not tailored to the investment needs of any specific person and therefore does not involve a consideration of any of the investment objectives, financial situation or needs of any viewer that may receive it. Kindly also note that past performance is not a reliable indicator of future results. Actual results may differ materially from those anticipated in forward-looking or past performance statements. We assume no liability as to the accuracy or completeness of any of the information and/or content provided herein and the Company cannot be held responsible for any omission, mistake nor for any loss or damage including without limitation to any loss of profit which may arise from reliance on any information supplied by TFA Global Pte Ltd.
The speaker(s) is neither an employee, agent nor representative of Tradu and is therefore acting independently. The opinions given are their own, constitute general market commentary, and do not constitute the opinion or advice of Tradu or any form of personal or investment advice. Tradu neither endorses nor guarantees offerings of third-party speakers, nor is Tradu responsible for the content, veracity or opinions of third-party speakers, presenters or participants.
usdjpy buy tradeThe Relative Strength Index (RSI) is showing an upward trend, indicating increasing momentum. Additionally, the Moving Average Convergence Divergence (MACD) is showing a bullish crossover, further supporting the potential for an upward move
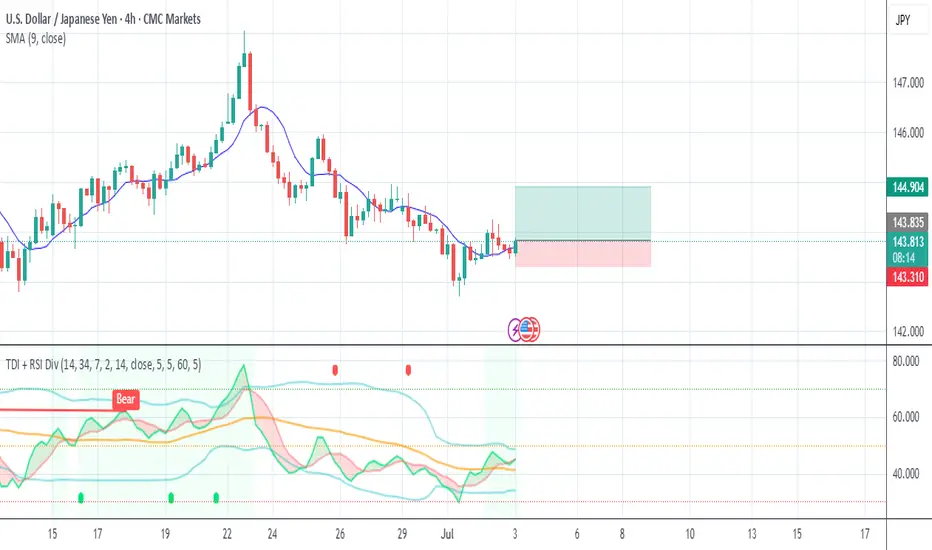
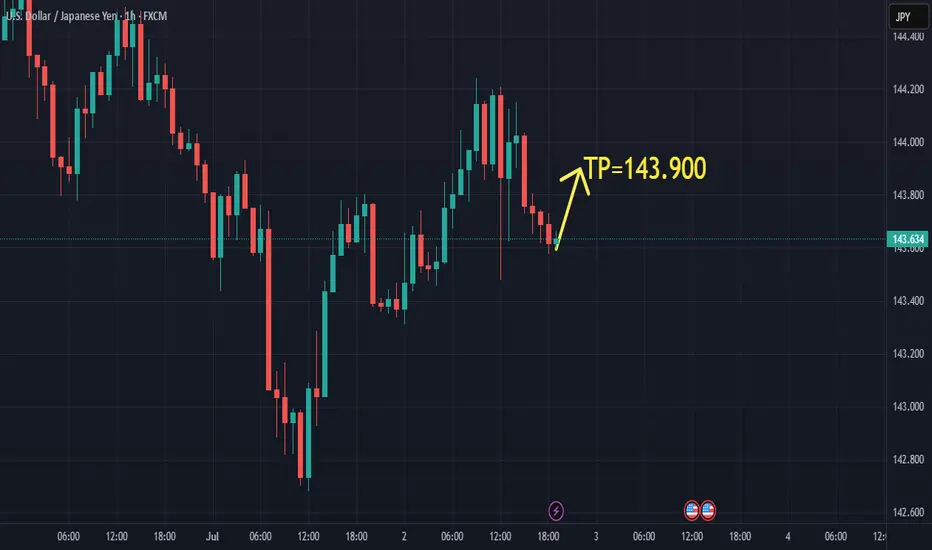
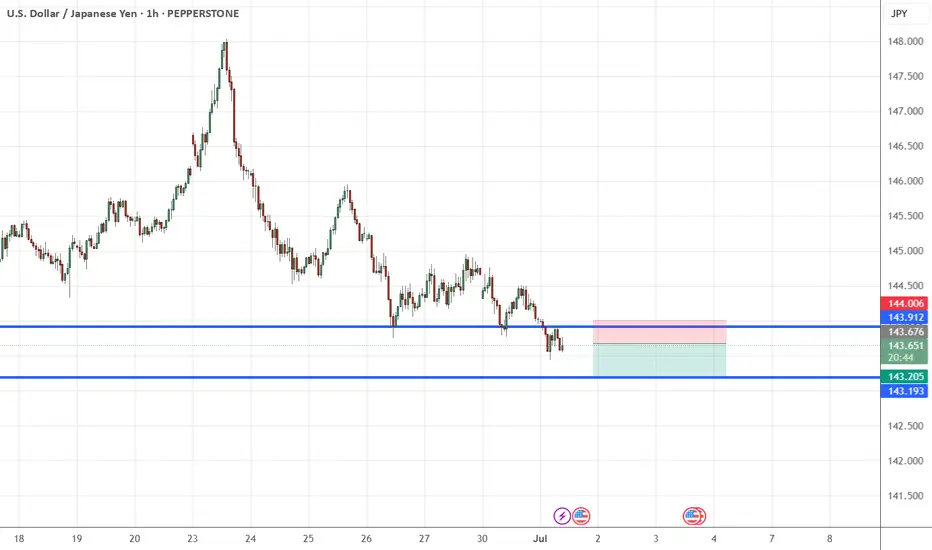
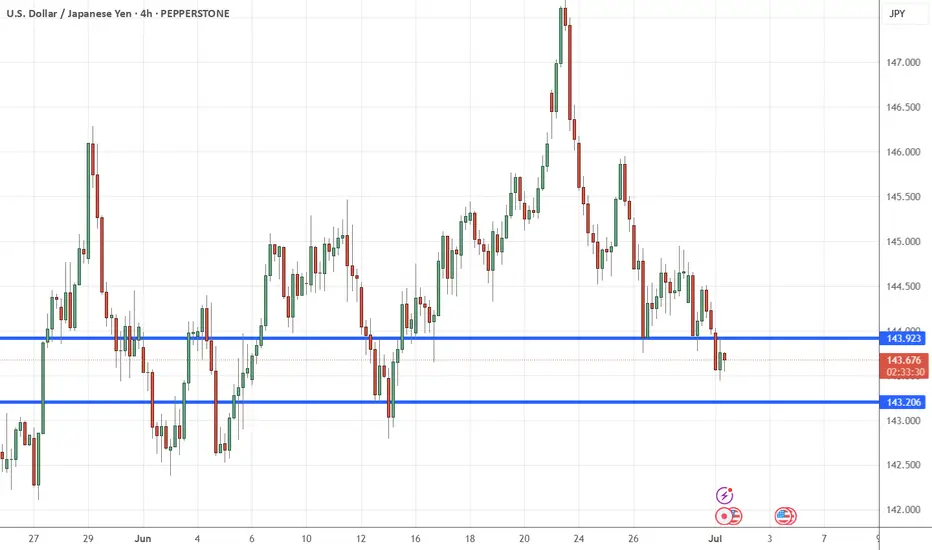
USD/JPY short-term longThe pair is currently trading at the 4H support area (143.500 - 143.700) and I expect the price to reach at least 143.900
Entry = 143.600
Take profit = 143.900
Trade safe!
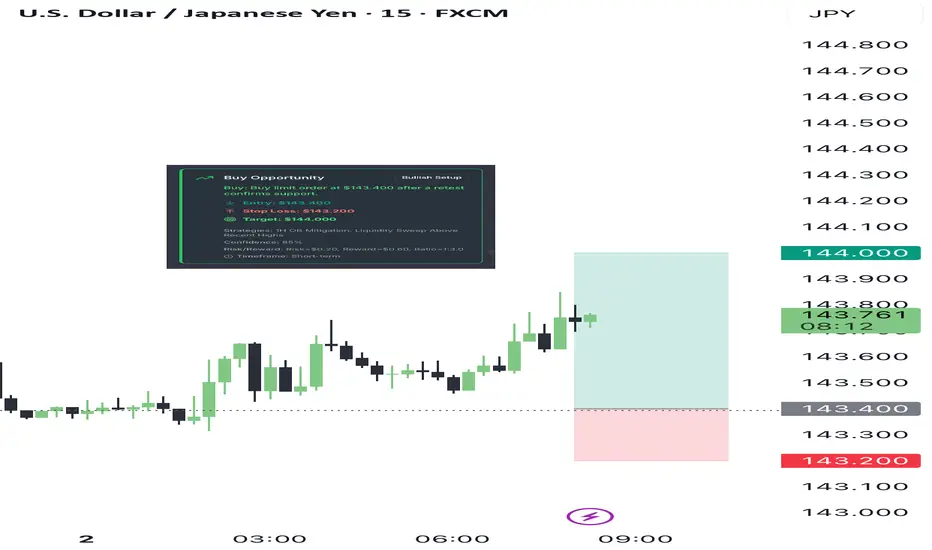
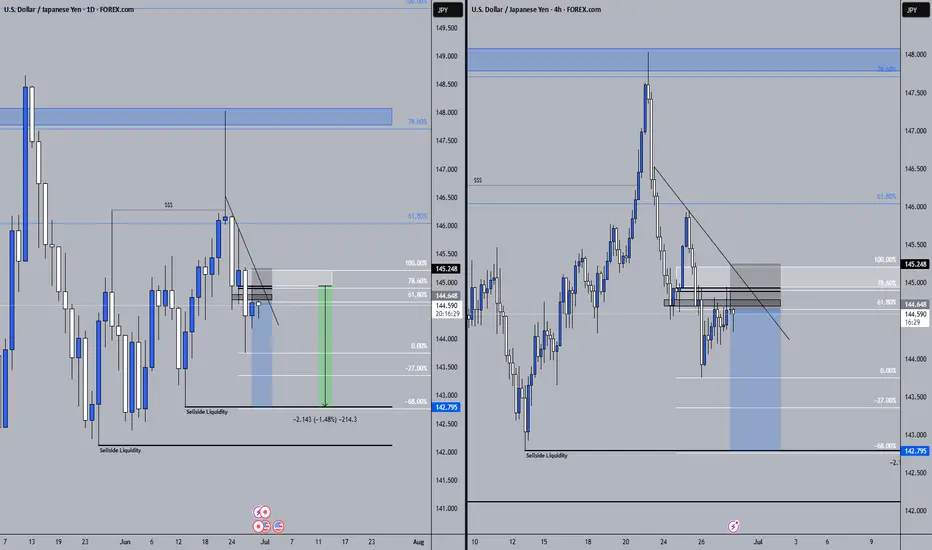
Buy limit order at $143.400 after a retest confirms supportAnalyzing the USD/JPY across multiple timeframes, we observe a consistent pattern of price recovery after a significant drop, indicating a potential phase of accumulation by institutional players. The daily chart shows a recent decline followed by a stabilization and slight upward movement, suggesting a possible change of character (CHoCH) from bearish to bullish momentum. The 4-hour and 1-hour charts confirm this with a series of higher lows and higher highs, indicative of a shift towards bullish sentiment.
The 15-minute, 5-minute, and 1-minute charts display more granular price action, with recent bullish candles suggesting an ongoing push for higher prices. This could be a response to retail selling pressure being absorbed by institutional buying, a common scenario during early stages of a bullish reversal.
INSTITUTIONAL THESIS:
Institutions appear to be in the early stages of an accumulation phase, targeting liquidity above recent highs to trigger stop losses and fuel further upward movement. The presence of unmitigated order blocks (OB) on the 1-hour chart around 143.400 provides a potential area for re-entry, suggesting that price may revisit this zone to balance before continuing upwards.
LEARNING POINT:
"1H Order Block mitigation after liquidity sweep" - This scenario highlights how institutions often retest key levels where significant orders were previously placed, confirming their commitment to driving the price in the intended direction.
SIGNAL: BUY
SYMBOL: USDJPY
ENTRY PRICE: $143.400
STOP LOSS: $143.200
TARGET PRICE: $144.000
CONDITION: Buy limit order at $143.400 after a retest confirms support.
RATIONALE: The setup aligns with a bullish CHoCH on multiple timeframes, presence of a 1H OB, and the anticipation of a liquidity sweep above recent highs.
STRATEGIES USED: 1H OB Mitigation, Liquidity Sweep Above Recent Highs
URGENCY: MEDIUM
TIMEFRAME: Short-term
CONFIDENCE SCORE: 85%
RISK/REWARD RATIO: Risk=$0.20, Reward=$0.60, Ratio=1:3.0
CRITICAL RULES:
The analysis strictly adheres to Smart Money Concepts, avoiding traditional retail indicators.
The decision is based on visible price action and institutional logic, ensuring a high probability of success.
The risk/reward ratio exceeds the minimum requirement of 2:1, enhancing the trade's viability.
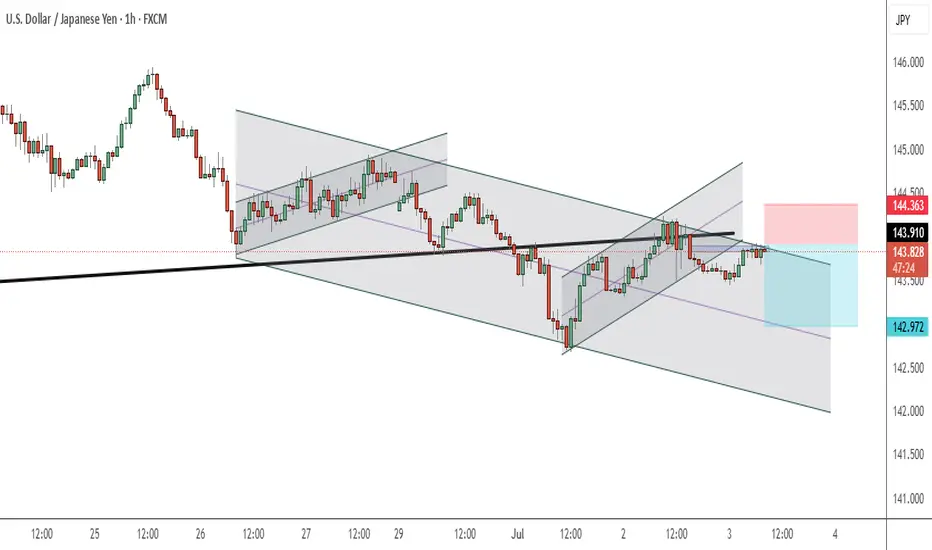
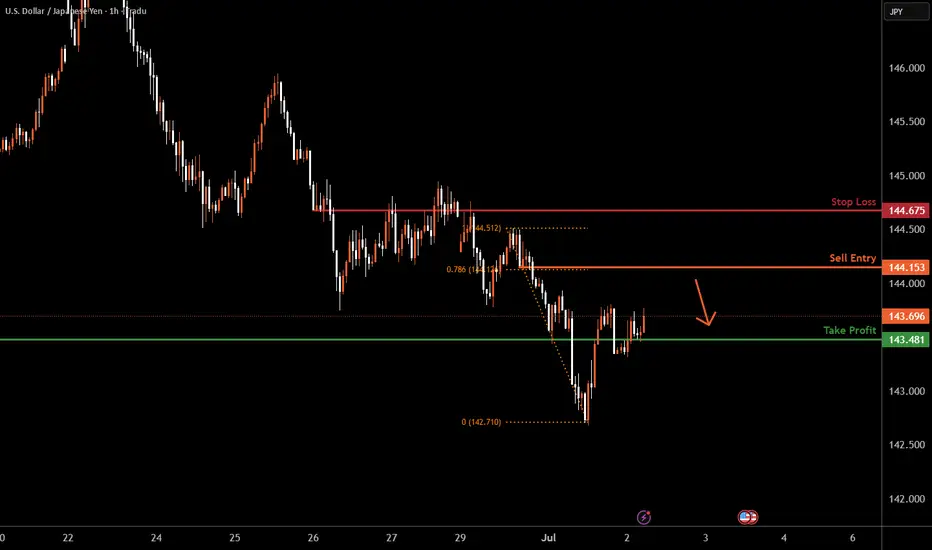
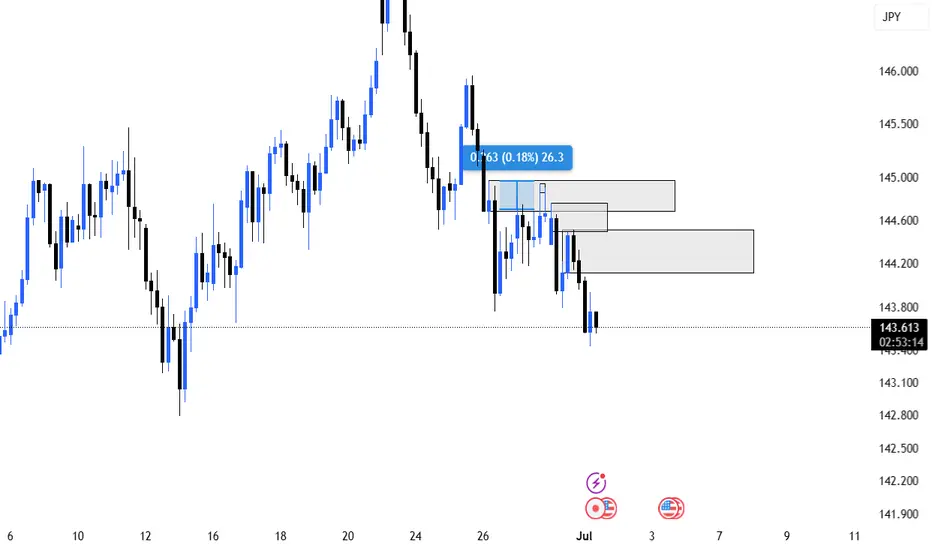
USDJPY H1 I Bearish ReversalBased on the H1 chart, the price is rising toward our sell entry level at 144.15, a pullback resistance that aligns with the 78.6% Fib retracement.
Our take profit is set at 143.48, an overlap support.
The stop loss is set at 144.67, an overlap resistance.
High Risk Investment Warning
Trading Forex/CFDs on margin carries a high level of risk and may not be suitable for all investors. Leverage can work against you.
Stratos Markets Limited (tradu.com ):
CFDs are complex instruments and come with a high risk of losing money rapidly due to leverage. 63% of retail investor accounts lose money when trading CFDs with this provider. You should consider whether you understand how CFDs work and whether you can afford to take the high risk of losing your money.
Stratos Europe Ltd (tradu.com ):
CFDs are complex instruments and come with a high risk of losing money rapidly due to leverage. 63% of retail investor accounts lose money when trading CFDs with this provider. You should consider whether you understand how CFDs work and whether you can afford to take the high risk of losing your money.
Stratos Global LLC (tradu.com ):
Losses can exceed deposits.
Please be advised that the information presented on TradingView is provided to Tradu (‘Company’, ‘we’) by a third-party provider (‘TFA Global Pte Ltd’). Please be reminded that you are solely responsible for the trading decisions on your account. There is a very high degree of risk involved in trading. Any information and/or content is intended entirely for research, educational and informational purposes only and does not constitute investment or consultation advice or investment strategy. The information is not tailored to the investment needs of any specific person and therefore does not involve a consideration of any of the investment objectives, financial situation or needs of any viewer that may receive it. Kindly also note that past performance is not a reliable indicator of future results. Actual results may differ materially from those anticipated in forward-looking or past performance statements. We assume no liability as to the accuracy or completeness of any of the information and/or content provided herein and the Company cannot be held responsible for any omission, mistake nor for any loss or damage including without limitation to any loss of profit which may arise from reliance on any information supplied by TFA Global Pte Ltd.
The speaker(s) is neither an employee, agent nor representative of Tradu and is therefore acting independently. The opinions given are their own, constitute general market commentary, and do not constitute the opinion or advice of Tradu or any form of personal or investment advice. Tradu neither endorses nor guarantees offerings of third-party speakers, nor is Tradu responsible for the content, veracity or opinions of third-party speakers, presenters or participants.
USDJPY buy TradeOpportunity to BuY on USDJPY
Entry: 143.500
Stop : 143.100
Take profit 📈: 145.400
Comment your opinion
For fund management. Contact me on X @shajudeakinoba1
USD/JPY weekly Analysis for June 30th - July 4th sell order
Weekly target 141.55
it is a possible chance to see 140.78 this week as well
stay cool calm collect and don't over leverage.
USDJPU 160PIP BAGED LIVE TRADE Japanese Yen sticks to intraday gains; USD/JPY seems vulnerable near multi-week low
The Japanese Yen retains its positive bias against a bearish US Dollar and currently trades near a three-week low touched during the Asian session earlier this Tuesday. The Bank of Japan's (BoJ) Tankan Survey showed that business confidence at large manufacturers in Japan improved for the first time in two quarters during the April-June period.

USDCAD H4 Solid ShortH4 trend down
Solid resistance entry for short
TP not far on next visible SR level
80% probability
USDJPY OVERVIEW I have been bearish on USDJPY Since last week i will be waiting for price to come to supply levels that have been left unmitigated.Looking for sells
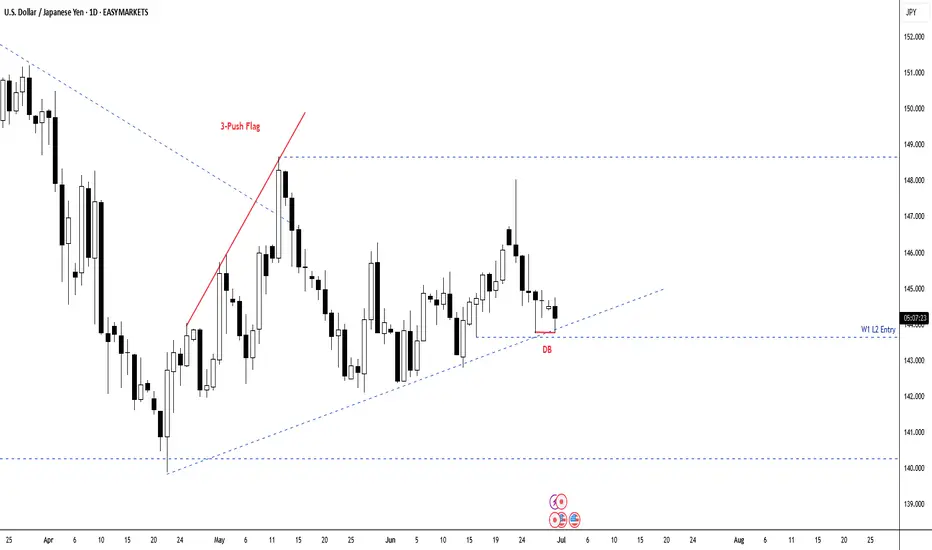
Potential Long ScalpUSDJPY tried multiple times to test the bear trend extreme after the 3-Push correction.
It seems like bears can't keep price below the EMA, with gaps getting smaller and smaller at each bear swing.
Now, it's forming sort of a Double Bottom at the bull Trend Line at the end of what seems to be a 2-legged bear move. Chances are that the bears are exhausted and if the current candle closes with a bull body or even a small bear body, there could be a good long scalp.
The problem is that it looks like a Barb Wire too, so any Breakout tend to fail. Still, there could be a good opportunity to enter in second leg after a bullish breakout out of the Double Bottom.
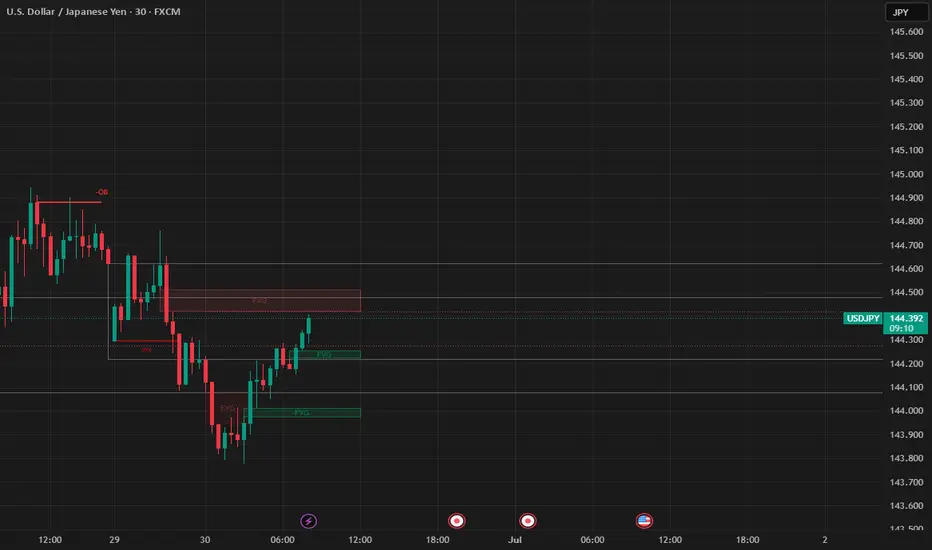
USD/JPY - bearish turning to bullish?4H bearish FVG has been mitigated
30min price action fast approaching bearish FVG above. If that is mitigated, this pair could fly upwards
Please share your thoughts
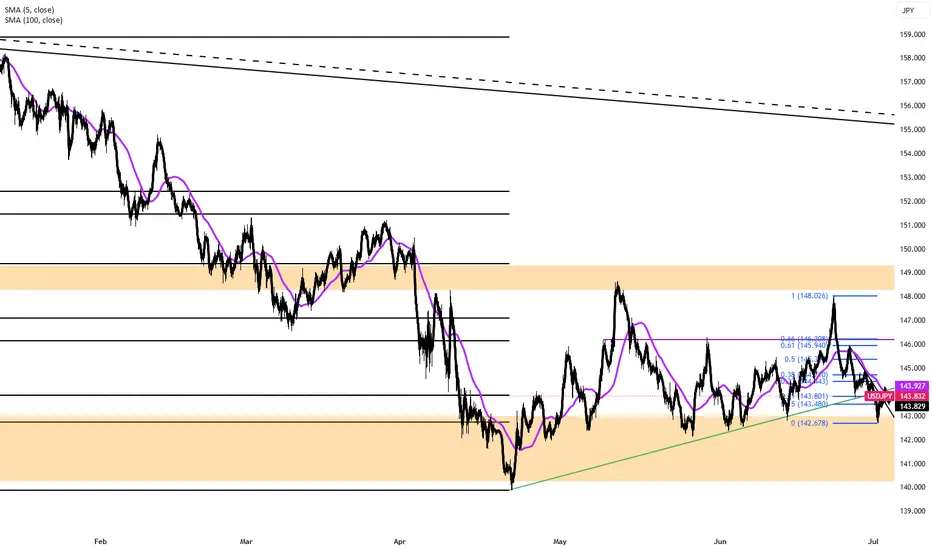
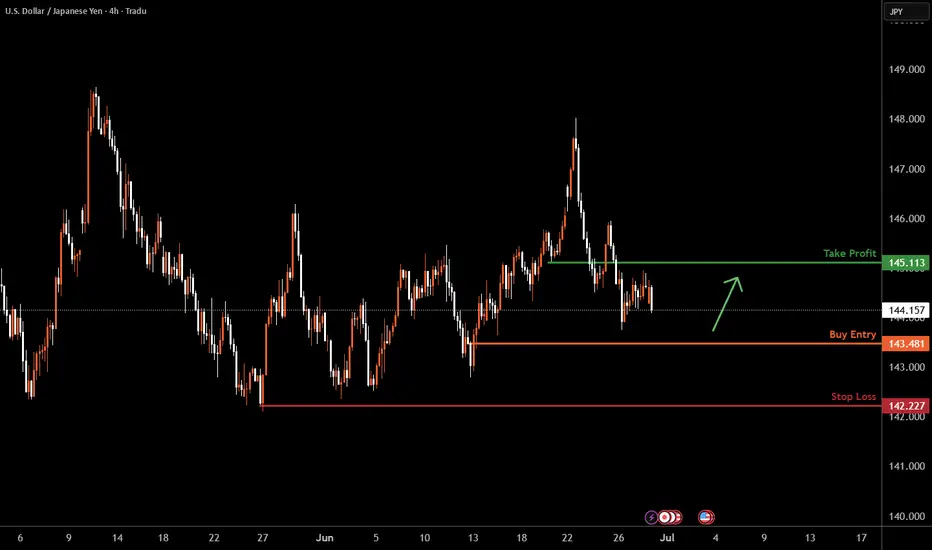
USDJPY H4 I Bullish Bounce Off Based on the H4 chart analysis, the price is approaching our buy entry level at 143.48, a pullback support.
Our take profit is set at 145.11 a pullback resistance.
The stop loss is placed at 142.22, a swing low support.
High Risk Investment Warning
Trading Forex/CFDs on margin carries a high level of risk and may not be suitable for all investors. Leverage can work against you.
Stratos Markets Limited (tradu.com ):
CFDs are complex instruments and come with a high risk of losing money rapidly due to leverage. 63% of retail investor accounts lose money when trading CFDs with this provider. You should consider whether you understand how CFDs work and whether you can afford to take the high risk of losing your money.
Stratos Europe Ltd (tradu.com ):
CFDs are complex instruments and come with a high risk of losing money rapidly due to leverage. 63% of retail investor accounts lose money when trading CFDs with this provider. You should consider whether you understand how CFDs work and whether you can afford to take the high risk of losing your money.
Stratos Global LLC (tradu.com ):
Losses can exceed deposits.
Please be advised that the information presented on TradingView is provided to Tradu (‘Company’, ‘we’) by a third-party provider (‘TFA Global Pte Ltd’). Please be reminded that you are solely responsible for the trading decisions on your account. There is a very high degree of risk involved in trading. Any information and/or content is intended entirely for research, educational and informational purposes only and does not constitute investment or consultation advice or investment strategy. The information is not tailored to the investment needs of any specific person and therefore does not involve a consideration of any of the investment objectives, financial situation or needs of any viewer that may receive it. Kindly also note that past performance is not a reliable indicator of future results. Actual results may differ materially from those anticipated in forward-looking or past performance statements. We assume no liability as to the accuracy or completeness of any of the information and/or content provided herein and the Company cannot be held responsible for any omission, mistake nor for any loss or damage including without limitation to any loss of profit which may arise from reliance on any information supplied by TFA Global Pte Ltd.
The speaker(s) is neither an employee, agent nor representative of Tradu and is therefore acting independently. The opinions given are their own, constitute general market commentary, and do not constitute the opinion or advice of Tradu or any form of personal or investment advice. Tradu neither endorses nor guarantees offerings of third-party speakers, nor is Tradu responsible for the content, veracity or opinions of third-party speakers, presenters or participants.
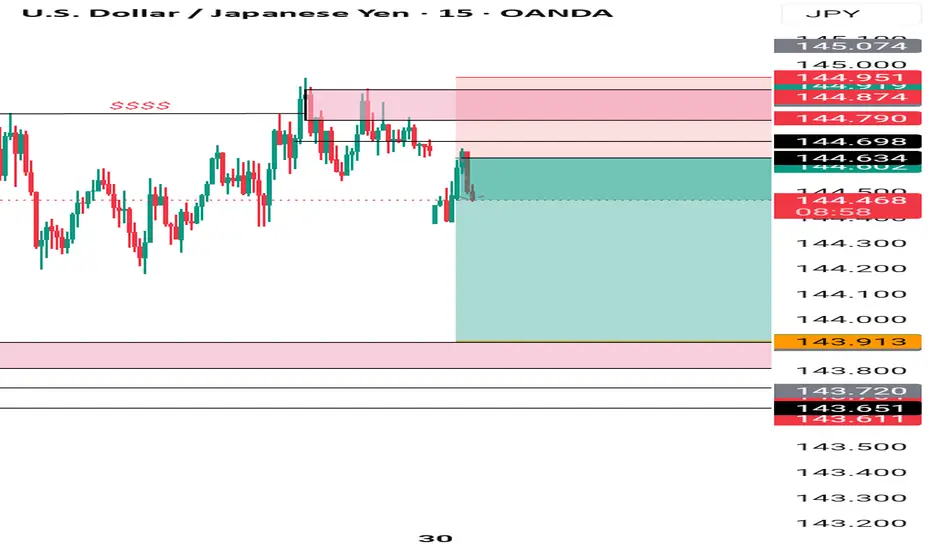
USDJPY 15M BUY OPPORTUNITYVery good area of SUPPORT/RESISTANCE that why i went in
Safer SL 143.73
I can see very BULLISH signs for UJ in this coming Month (long term)
Have a lovely week every body
USDJPY 29/06/2025Weekly:
-Bearish W pattern.
-Liquidity sweep.
-Expecting a bearish weekly candle.
Daily:
-Bearish W pattern.
-IC.
4H:
-Bearish W pattern.
-IC.
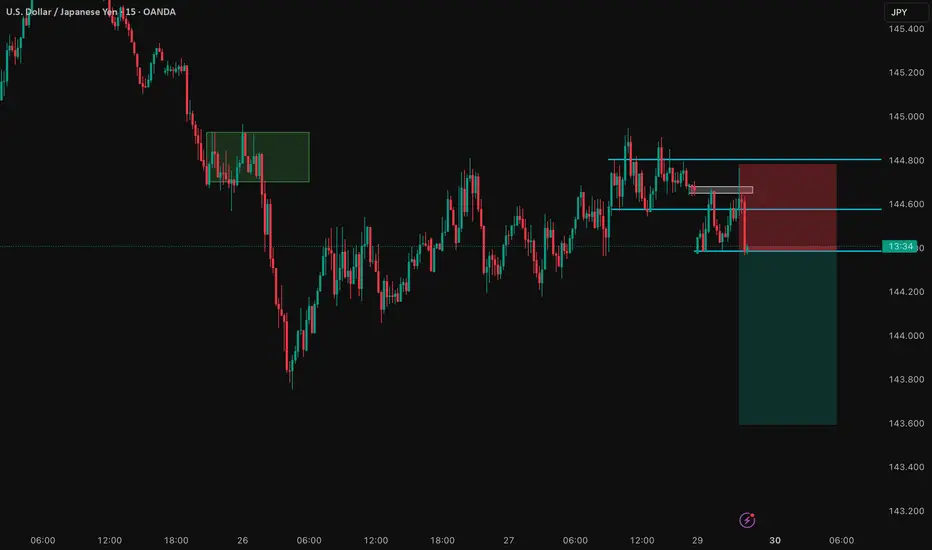
Uj bearish scenario Uj confirmed bearish
Bearish Momentum
Smc completely forms and
Confirmed with counter trade break
Good early entry
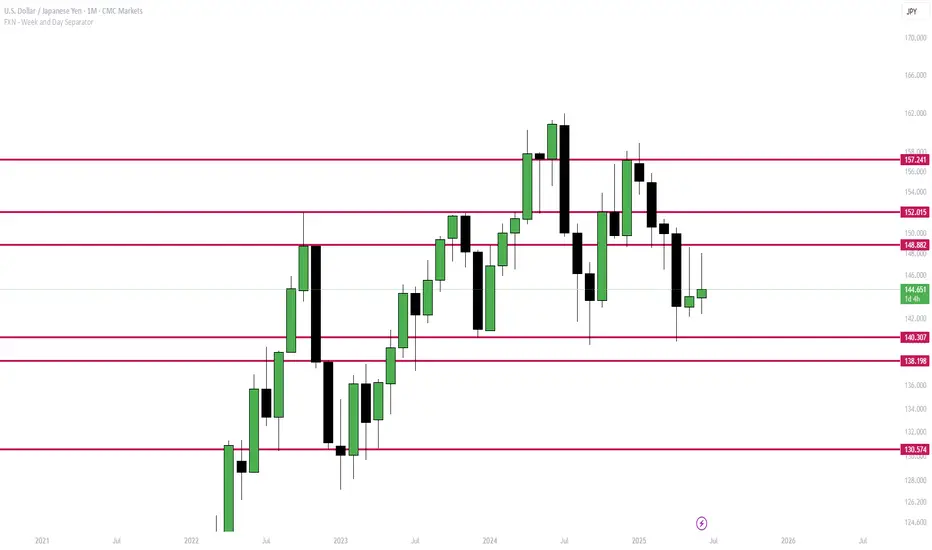
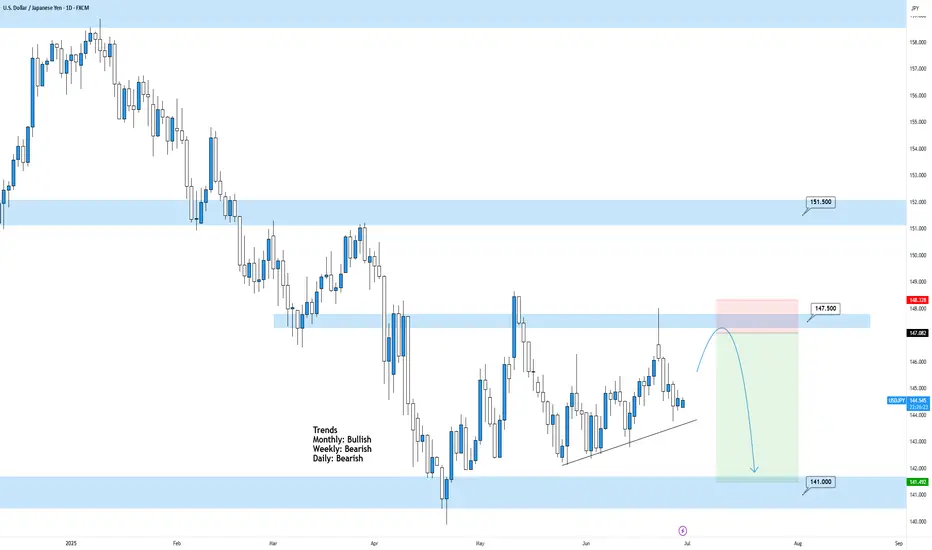
USDJPY Daily TF - June 29th, 2025USDJPY Daily Neutral Idea
Monthly - Bullish
Weekly - Bearish
Daily - Bearish
I’m looking at the Daily time frame here as this is the only clear picture for price action in terms of trends. The 4hour looks like price action can’t make a decision so we will wait for price action to get closer to some major zones.
Bearish Continuation - Ideally, we want to see price action touch 147.500 again followed by convincing bearish rejection. Look to target lower toward major support levels if this happens.
Aside from this potential setup we don’t have much to look at here on UJ.
USDJPY: On The Lookout For Clear DirectionSimply ranging... A breakout from the range will be a good start. I will just observe.