JPYUSD trade ideas
USDJPY: Bullish Forecast & Bullish Scenario
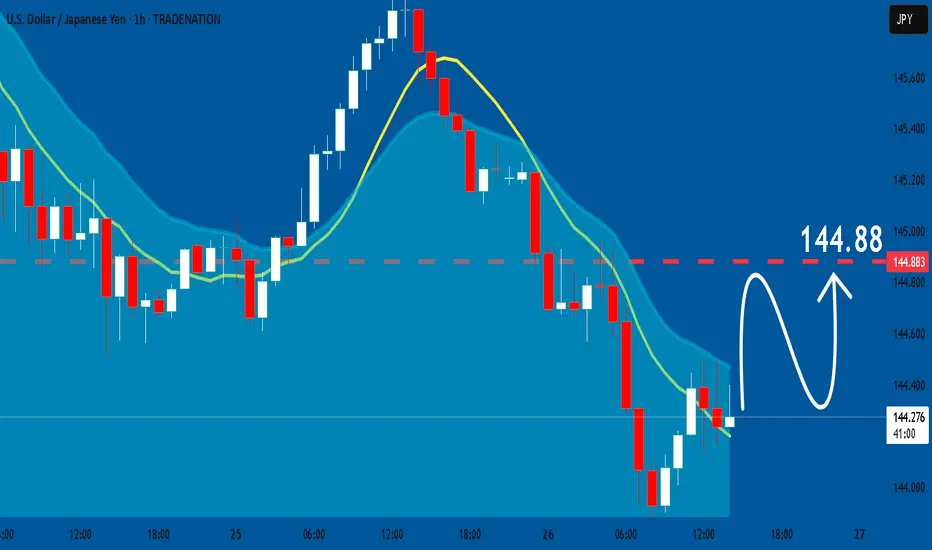
The recent price action on the USDJPY pair was keeping me on the fence, however, my bias is slowly but surely changing into the bullish one and I think we will see the price go up.
Disclosure: I am part of Trade Nation's Influencer program and receive a monthly fee for using their TradingView charts in my analysis.
❤️ Please, support our work with like & comment! ❤️
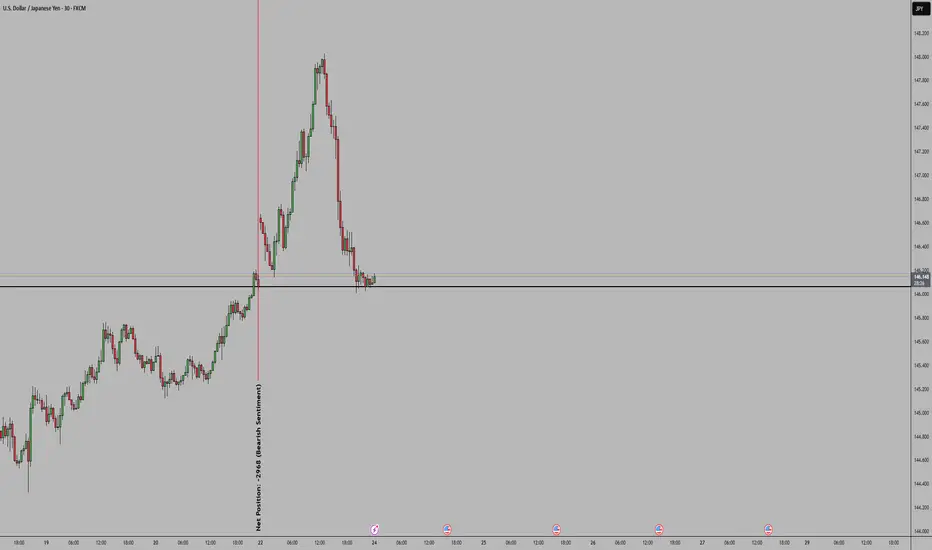
USDJPYCOT Report: Shows net shorts on the USD, suggesting a bearish outlook for USD/JPY as institutional traders expect the JPY to strengthen against the USD. Bias: A break below support
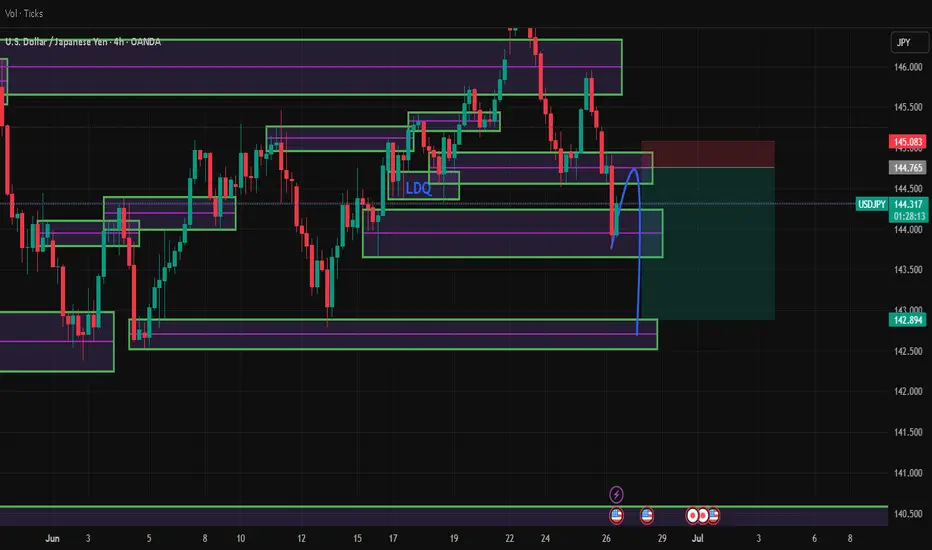
USDJPY Analysis – Bearish Retracement SetupPrice is currently hovering around 144.340, and I'm anticipating a short-term pullback into the 144.786 zone — a key area of interest that aligns with a premium supply zone and possible order block on the H1/H4 timeframe.
This retracement may serve as a liquidity grab before price resumes its bearish move toward 142.526, which sits near a higher timeframe demand zone or liquidity pool.
If bearish confirmation (e.g., M-formation, bearish engulfing, or break of internal structure) appears at 144.786, I’ll be looking to short down to 142.526.
🔹 Short-term bias: Bullish retracement
🔻 Mid-term bias: Bearish continuation
🔍 Key Levels:
Retracement zone: 144.786
Target zone: 142.526
Current price: 144.340
📌 Risk Management Note: This is not financial advice. Always use proper risk-to-reward (RR) setups, manage your lot size wisely, and never risk more than 1–2% of your account per trade. Trading involves risk — protect your capital first.
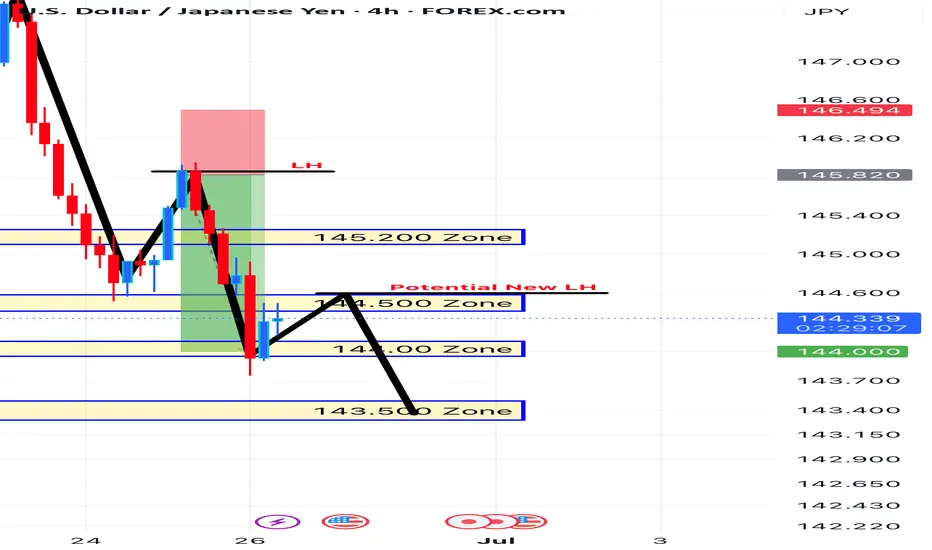
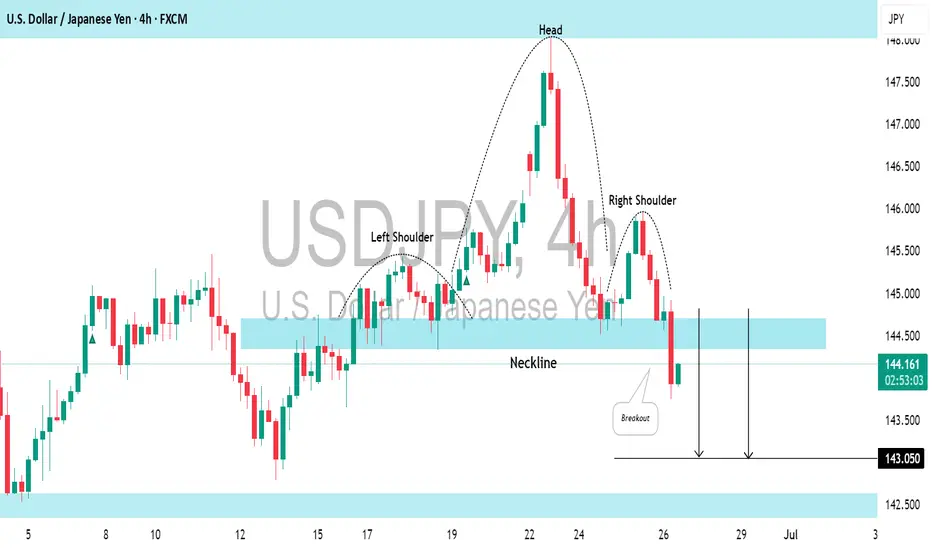
USDJPY: Classic Bearish PatternThe USDJPY has developed a significant head and shoulders pattern on the 4-hour time frame.
We see a confirmed breach of the neckline and an intraday candle closing below it.
The pair is likely to keep falling, with the next target at 143.05.
USD/JPY) bearish Trand analysis Read The captionSMC trading point update
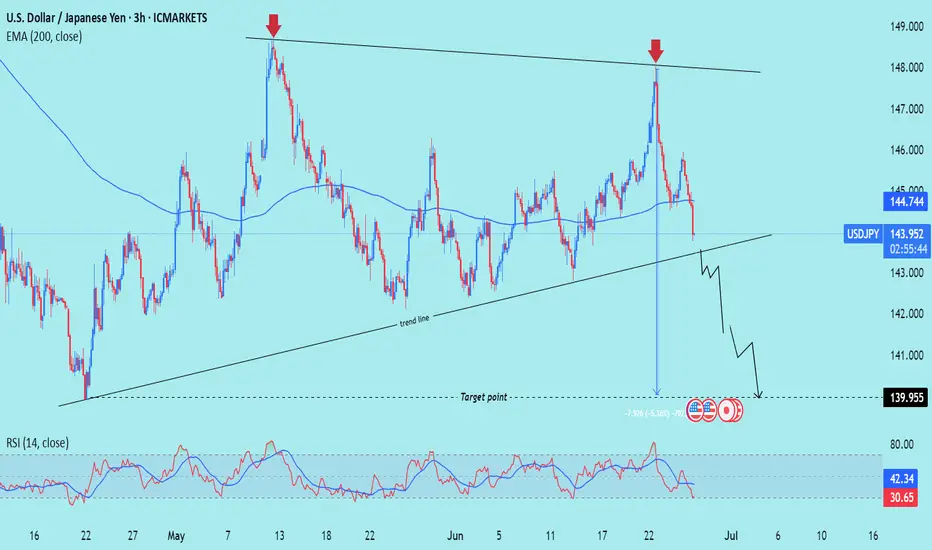
Technical analysis of USD/JPY on the 3-hour timeframe, highlighting a breakdown from trendline resistance and projecting a move toward a significant downside target.
---
Technical Breakdown
1. Trendline Rejection
Price sharply rejected from the descending resistance trendline near 148.00 (red arrow), forming a potential lower high.
This suggests continuation of the broader downtrend structure.
2. Break Below EMA 200
Price has broken below the 200 EMA (144.752), signaling a shift in momentum from bullish to bearish.
EMA is likely to act as dynamic resistance if price attempts a pullback.
3. Bearish Projection
The chart outlines a measured move downward toward the target point at 139.955, implying a drop of over 5.36% (approximately 770 pips).
The projected path shows lower highs and lower lows, confirming bearish structure.
4. RSI Confirmation
RSI (14) is currently at 29.98, indicating oversold conditions, but this often supports strong momentum in trending markets—suggesting a possible continuation lower after minor retracements.
Mr SMC Trading point
---
Conclusion / Idea Summary
Bias: Bearish
Entry: After trendline rejection and EMA 200 break (~144.75)
Target: 139.955
Invalidation: Break above 148.00 resistance trendline
---
Please support boost 🚀 this analysis)
* No bullish defense yet, and volume is not showing divergence.The probability of continuation **to the downside is still high**, especially if the price closes a strong bearish candle below **143.90** in the next few hours.
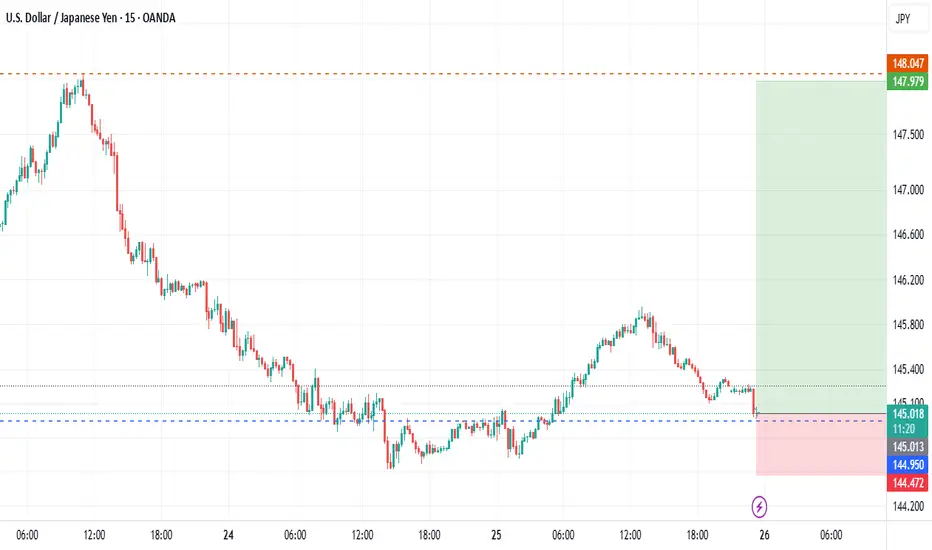
USDJPY LAST LIQUDITY GRAB BEFORE WE FLY TO THE MOONI took this 15m @ 144.623 i believe this is last LIQUIDITY GRAB before we fly
Risk reward is very good lets hope our probability works
I will hold this till main target or get decline formation
I will update either way, WIN/LOST
Wish me luck
Thanks
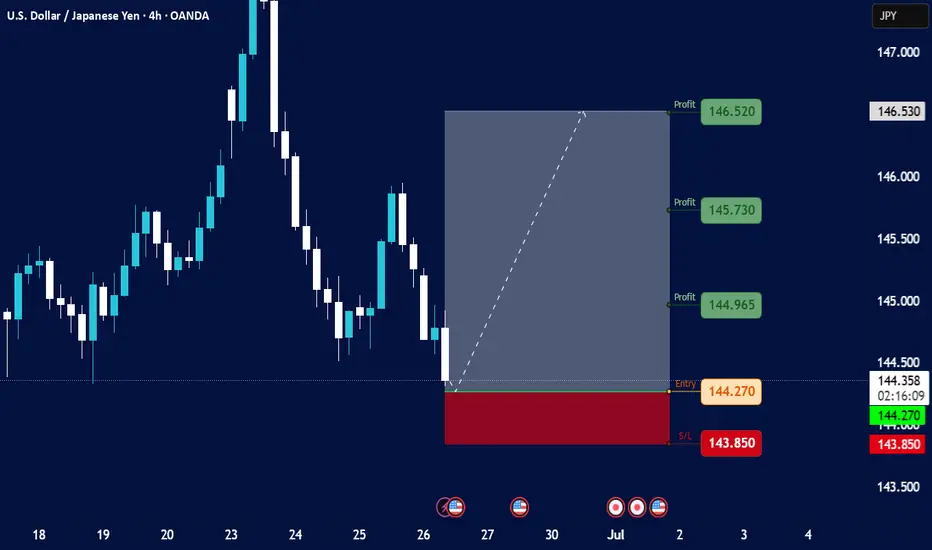
USDJPYCurrent Price Action:
The USD/JPY pair is trading at 144.414, down -0.842 (-0.588%).
The price is hovering near the 20-period BMA (144.384) and OXIDA level (141.784), suggesting a potential inflection point.
Support and Resistance Levels:
Immediate Resistance: 144.500, 145.000, 145.500.
Strong Resistance: 146.000, 146.530, 147.000 (profit target).
Immediate Support: 144.000, 143.850 (double-bottom level), 143.500.
Strong Support: 144.270 (near current price), 143.850 (critical).
Technical Indicators:
BMA (20-period): The price is slightly above the BMA at 144.384, indicating neutral momentum.
OXIDA: The OXIDA level at 141.784 is far below, acting as a long-term support.
Market Sentiment:
The downtrend is mild (-0.588%), but the proximity to key support (143.850-144.000) suggests potential consolidation or reversal if buyers step in.
A break below 143.500 could signal further downside, while a rebound above 145.000 may target 146.000-147.000.
Trading Strategy:
Bullish Scenario: If price holds above 144.000, consider longs with targets at 145.000, 145.500, and 146.000. Stop loss below 143.850.
Bearish Scenario: A break below 143.850 could lead to a test of 143.500. Shorts may target 143.000 with a stop above 144.270.
Conclusion:
The pair is in a short-term downtrend but near critical support. Watch for reactions at 144.000-144.500 to determine the next directional move. Risk management is key given the tight range.
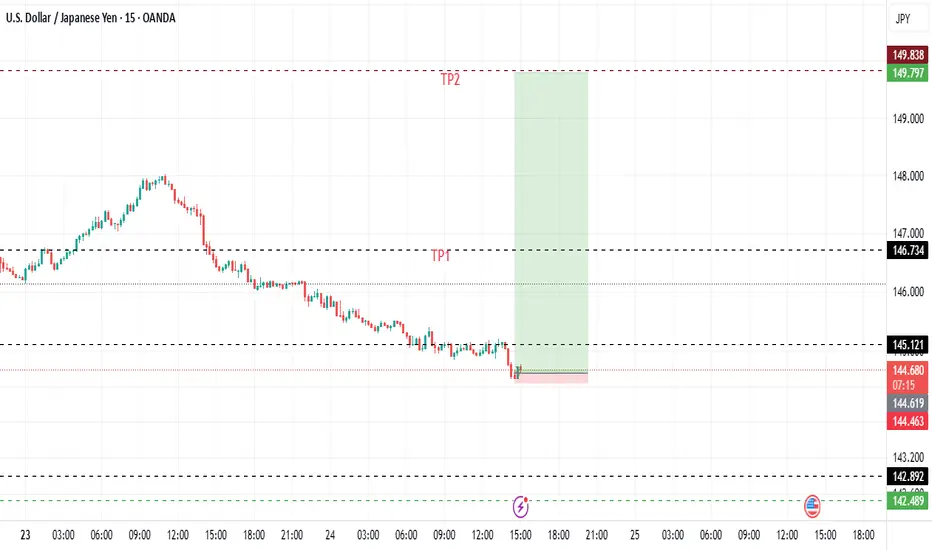
USDJPY 15M LAST OPPOTUNITY TO FLYHere where we re-invest THE HALF LOT we close earlier today on the trade that we took yesterday (THE REMAINING HALF STILL RUNNING {https://tradingview.sweetlogin.com/chart/USDJPY/vYQEgzZy-USDJPY-LAST-LIQUDITY-GRAB-BEFORE-WE-FLY-TO-THE-MOON/} LINK),
Same TARGET OF 149.79 But as usual will keep TAKING PROFIT along the way
Will update every time i change something
Please comment welcome and if you have any question just Halaa :)
All the best and good night
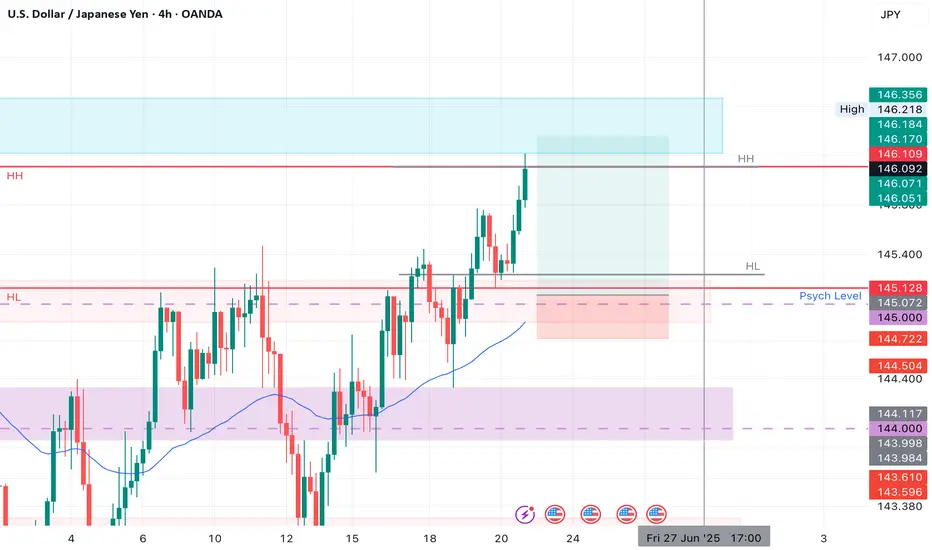
USDJPY LONG Market structure bullish on HTFs DH
Entry at Daily AOi
Weekly Rejection At AOi
Daily Rejection at AOi
Previous Daily Structure point
Daily EMA Retest
Around Psychological Level 145.000
H4 EMA Retest
H4 Candlestick rejection
Rejection from Previous structure
Levels 3.67
Entry 95%
REMEMBER : Trading is a Game Of Probability
: Manage Your Risk
: Be Patient
: Every Moment Is Unique
: Rinse, Wash, Repeat!
: Christ is King.
USD JPY --->>> SHORT!Sell on dollar against yen. Analysis based on the daily chart. Entry based on the hourly time frame.
Taking my trade in a USDJPY A bullish trend in the market of USDJPY chart after showing divergence I am taking my trade

BULLISH. Liquidity has been taken and has moved to the upside, if price comes back to the zone marked, i will lookout for entry to continue on the bullish side.

Downtrend Slowing – Recovery Opportunity After Correction?USD/JPY: Downtrend Slowing – Recovery Opportunity After Correction?
Hello TradingView community!
Today, let's focus on analyzing the USD/JPY pair, which is showing interesting developments after its recent correction.
🌍 Macro Overview: USD/JPY Under Current Pressures
The market is observing shifts in the dynamics of the USD/JPY pair:
UOB Group's 24-Hour View: The USD experienced a sharp decline from 148.02 on Monday to 144.49, despite being "oversold". This indicates a slowing in the downtrend, though caution remains.
Retest Expected: According to UOB Group, there's a likelihood of USD/JPY retesting the 144.50 level before a more sustained recovery can be expected.
Downside Limited: A drop below 144.50 cannot be ruled out, but based on current momentum, any further weakness is unlikely to reach 144.00.
Resistance Levels: On the upside, resistance levels are noted at 145.20 and 145.55.
Overall, USD/JPY is in a phase of seeking equilibrium after a significant decline.
📊 Technical Analysis & USD/JPY Trading Plan
Based on the USD/JPY chart (H4/M30) you provided:
Overall Trend: The pair has undergone a relatively deep corrective decline after reaching a local peak, but appears to be seeking a strong support zone.
Key Price Levels:
Crucial Resistance (SELL Zone): Clearly at 144.894 - 145.178. This is an confluence area of Fibonacci levels and local highs where selling pressure could emerge strongly.
Important Support (Potential BUY Zone): Around 143.800 - 143.500. This represents a potential bottoming area where demand might be strong enough to push the price higher.
Projected Price Action: After the sharp decline, USD/JPY might retest the 144.50 area. If it holds above key support levels, an upward move towards resistance zones is plausible, as indicated by the arrows on the chart.
🎯 USD/JPY Trading Plan:
BUY ZONE: 143.800 - 143.500
SL: 143.400
TP: 144.000 - 144.200 - 144.500 - 144.800 - 145.000 - 145.200 - 145.500
SELL ZONE: 144.894 - 145.178
SL: 145.300
TP: 144.700 - 144.500 - 144.200 - 144.000 - 143.800 - 143.500
⚠️ Key Factors to Monitor:
US and Japanese Economic Data: Upcoming reports on inflation and employment from both nations could significantly impact Fed and BoJ policy expectations.
BoJ Policy Decisions: Any shifts in the Bank of Japan's stance will create strong volatility for the JPY.
Global Risk Sentiment: Changes in overall market sentiment can also affect JPY crosses.
Trade smart and stay informed! Wishing everyone a successful USD/JPY trading day!
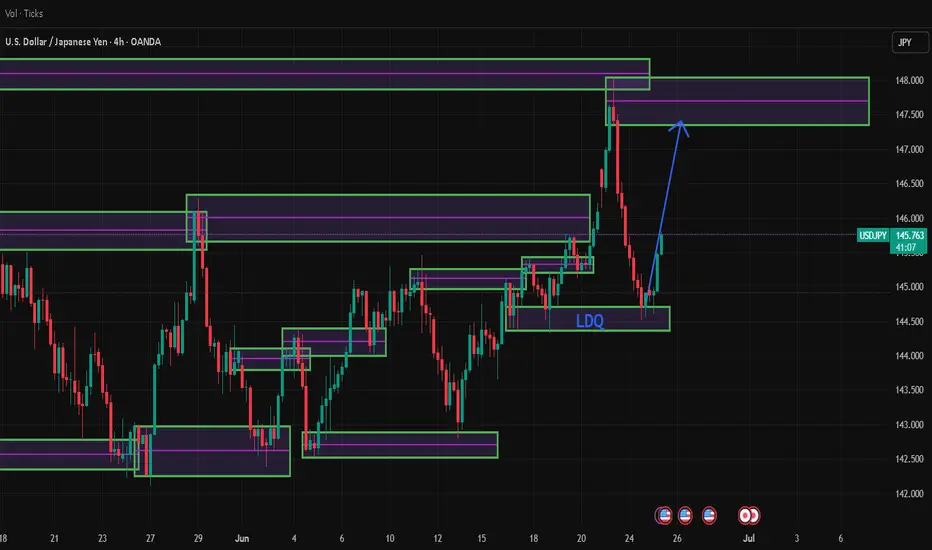
USD/JPY Long projection for the following days.After the sweep of liquidity, and a deeper mitigation of a weak, And of course our CH which is the strongest indication that enough buy orders are absorbed from the market, can indicate that we will see UJ in higher prices.

Dollar - Short term Bullish again (Mainly Bearish)Looks like Dollar wants to come back into the range we broke down from. I am still bearish dollar but no point getting into longer term "bearish" dollar trades yet

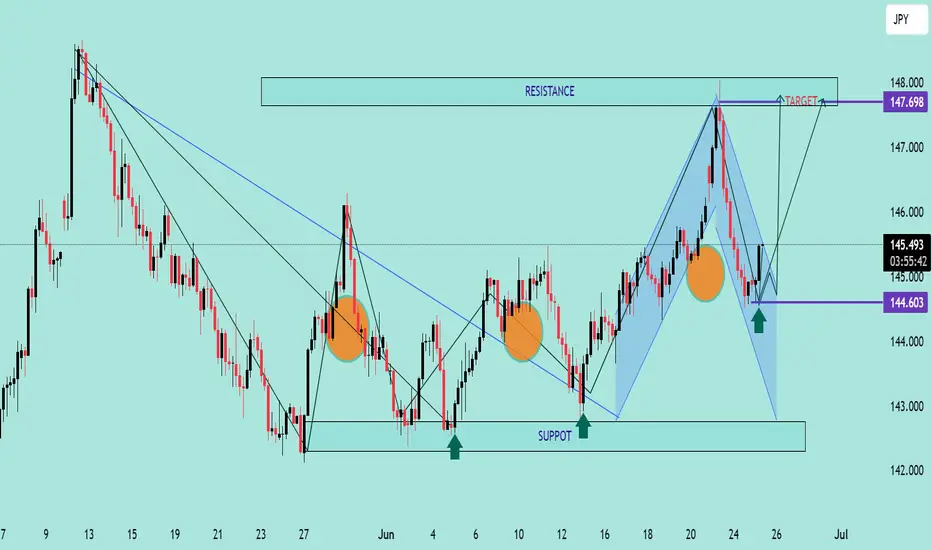
USD/JPY Bullish Reversal AnalysisUSD/JPY Bullish Reversal Analysis 📈💹
🔍 Technical Overview:
The chart illustrates a strong bullish reversal pattern forming on USD/JPY after price reacted from a key support zone at 144.600. This level has held firm multiple times, marked by green arrows, signaling strong buying interest.
📐 Chart Patterns & Structure:
✅ A bullish harmonic pattern (possibly a bullish Bat or Gartley) is completing near the 144.600 zone.
🔄 Multiple rejection wicks and bullish engulfing patterns indicate a potential upside reversal.
🔵 Descending trendlines have been broken, confirming momentum shift.
🔁 Previous resistance turned support (near 145.000) is acting as a possible launchpad for the next move.
🎯 Upside Target:
The projected move targets the resistance zone at 147.698, aligning with previous highs and a significant supply area.
If price breaks above 145.900 convincingly, continuation toward this resistance is expected.
🔻 Downside Risk:
A break below 144.600 would invalidate the bullish setup and expose price to the lower support range near 142.000–143.000.
📊 Conclusion:
USD/JPY is showing signs of bullish reversal from a strong demand zone. If price sustains above 145.000 and breaks the minor consolidation, the pair could rally toward 147.698 🎯.
Bias: Bullish ✅
Support: 144.600
Resistance: 147.698
USDJPY H4 Golden zone The USDJPY pair has finally reached the H4 golden Zone. M15 previous highs under threat. Are we bullish for the day
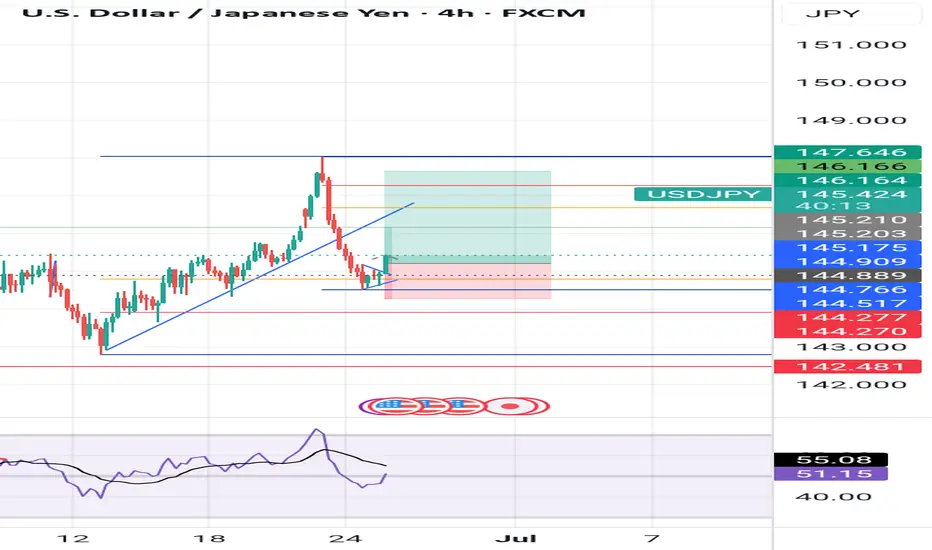
Ceasefire Supports Yen’s StrengthThe Japanese Yen stayed strong near a one-week high around 145.5 on Wednesday, supported by risk-off sentiment and dovish commentary from the Bank of Japan. Several BOJ members favored steady rates with concerns over U.S. tariffs and their impact on Japan’s economy.
May’s Services PPI remained above 3% yearly, strengthening speculation that the BOJ could still raise rates later this year. Meanwhile, lingering geopolitical uncertainty and expectations of Fed rate cuts continued to pressure the US Dollar.
The key resistance is at $146.20, and the major support is at $144.85.

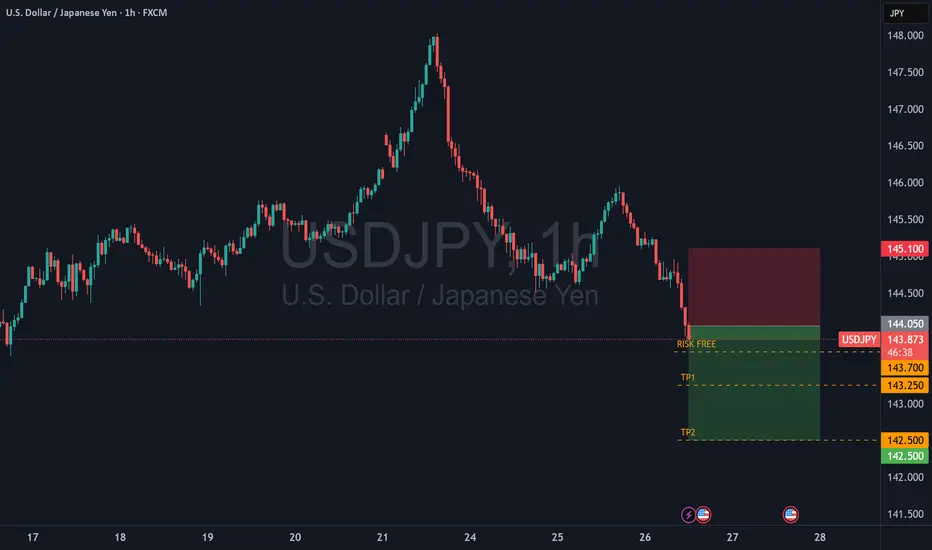
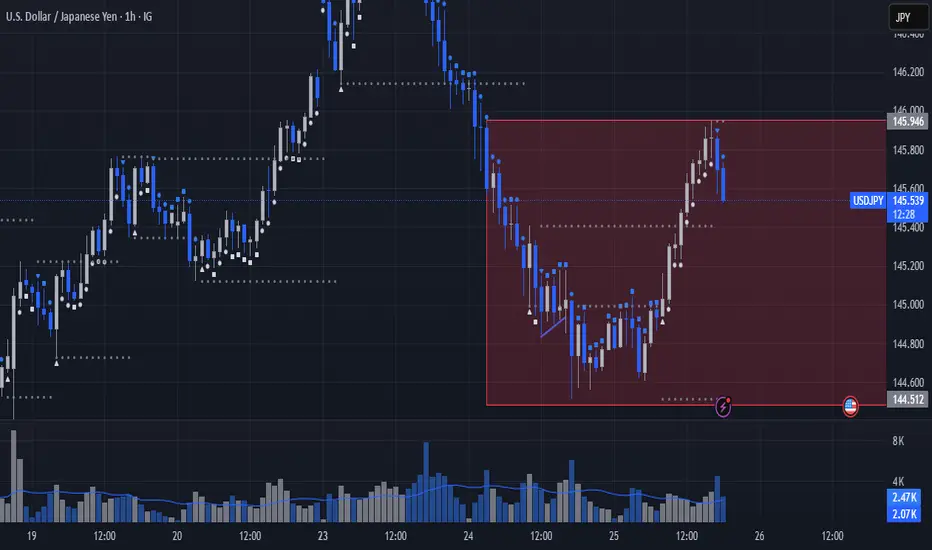
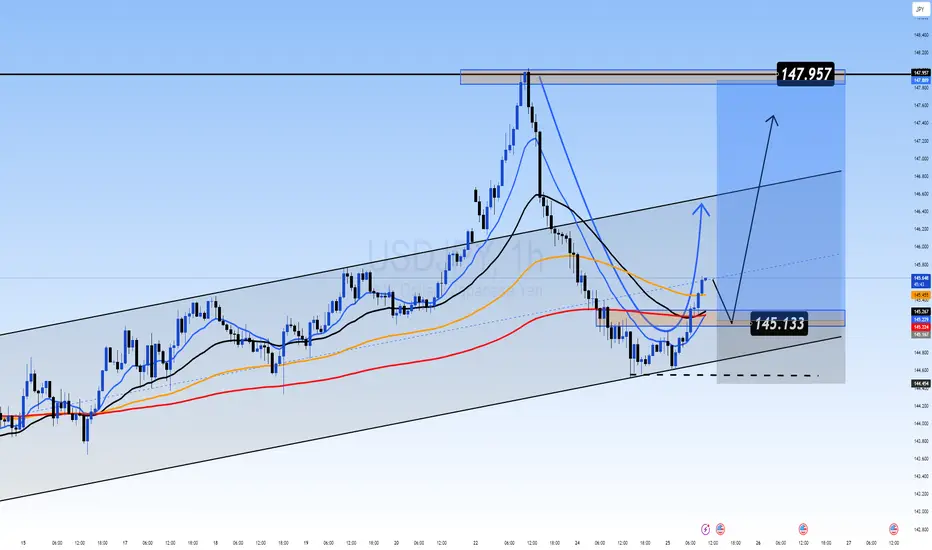
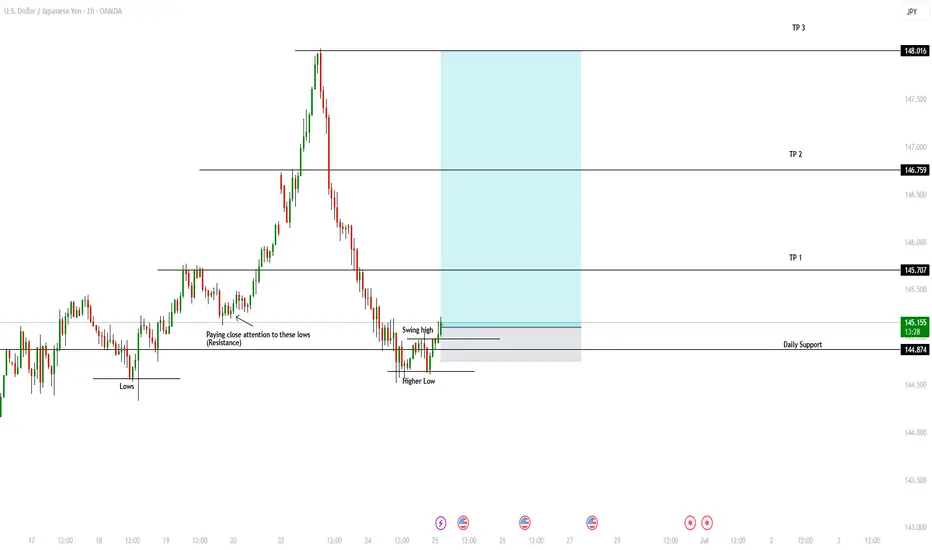
OANDA:USDJPY Buy SetupUSDJPY Buy Setup – Bullish Structure & Daily Rebound
USDJPY is showing signs of renewed bullish momentum after rejecting a significant daily low. Price action on the 1-hour timeframe has confirmed the formation of a higher low, followed by a clean break above a key daily support level—now turned support once again. This shift in market structure indicates a potential continuation of the uptrend, supported by higher highs and higher lows on the intraday chart.
Technical Highlights:
Strong rejection from a daily low zone
Bullish structure confirmed on the 1H timeframe
Price reclaiming a key support level and holding above it
Momentum suggests potential continuation toward higher targets
Trade Setup:
Entry: 145.110
Stop Loss: 144.754
Target Levels:
Take Profit 1: 145.709
Take Profit 2: 146.747
Take Profit 3: 148.014
This setup offers a favorable risk-to-reward ratio within a well-defined bullish context. Wait for a solid candle confirmation if not already entered, and always manage your risk according to your trading plan.
Drop your thoughts or questions in the comments, and if you found this valuable, hit boost and follow for more structured trade ideas. Wishing you precision and profits!
USDJPY shorts! It seems like Asia is winning the tariff war from my opinion. Not looking great for USA economy. USDJPY is a nice short for me.
