USDJPY TRADE SETUPMarket trend is broken i hope this week continue to up so let's see what happenned guys
JPYUSD trade ideas
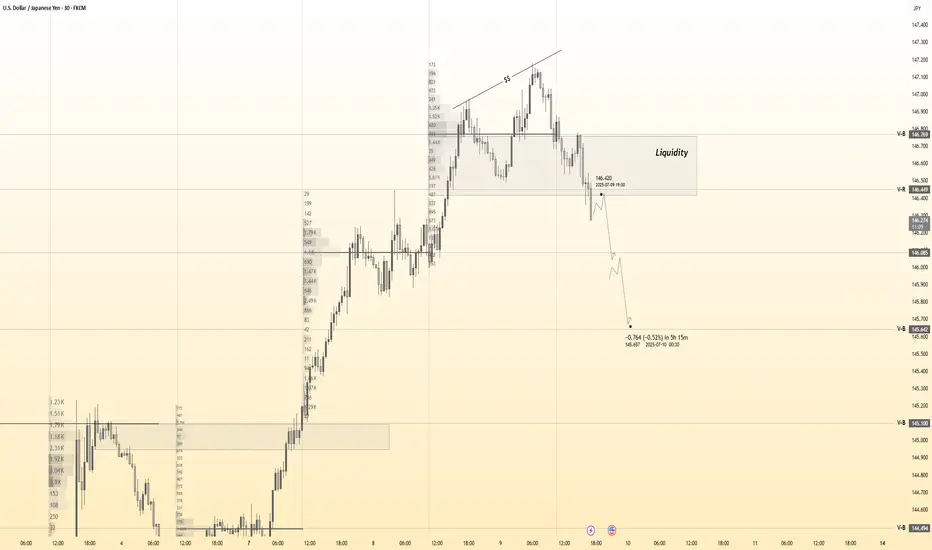
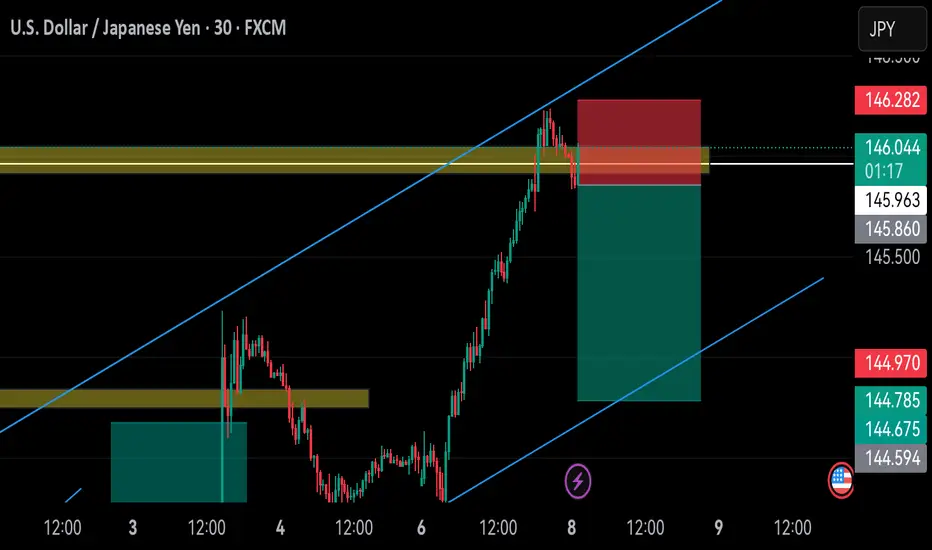
USDJPY 30Min Engaged (Bearish Reversal Entry Detected )➕ Objective: Precision Volume Execution
Time Frame: 30-Minute Warfare
Entry Protocol: Only after volume-verified breakout
🩸 Bearish Reversal From : 146.400
➗ Hanzo Protocol: Volume-Tiered Entry Authority
➕ Zone Activated: Dynamic market pressure detected.
The level isn’t just price — it’s a memory of where they moved size.
Volume is rising beneath the surface — not noise, but preparation.
🔥 Tactical Note:
We wait for the energy signature — when volume betrays intention.
The trap gets set. The weak follow. We execute.
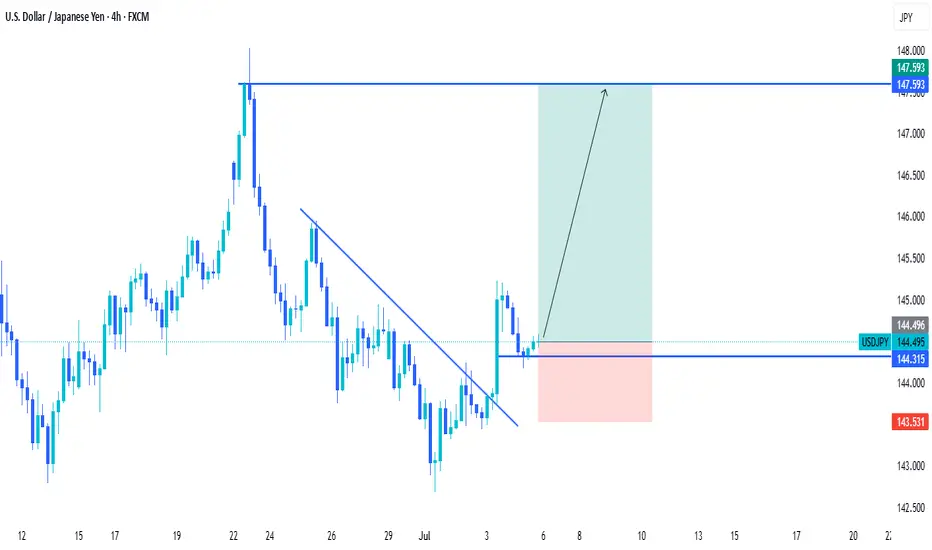
USDJPY 4HR Analysis on a bullish outlookUSDJPY - Short term bullish on DXY - I have my doubts on DXY still being bullish but I do like this scenario.
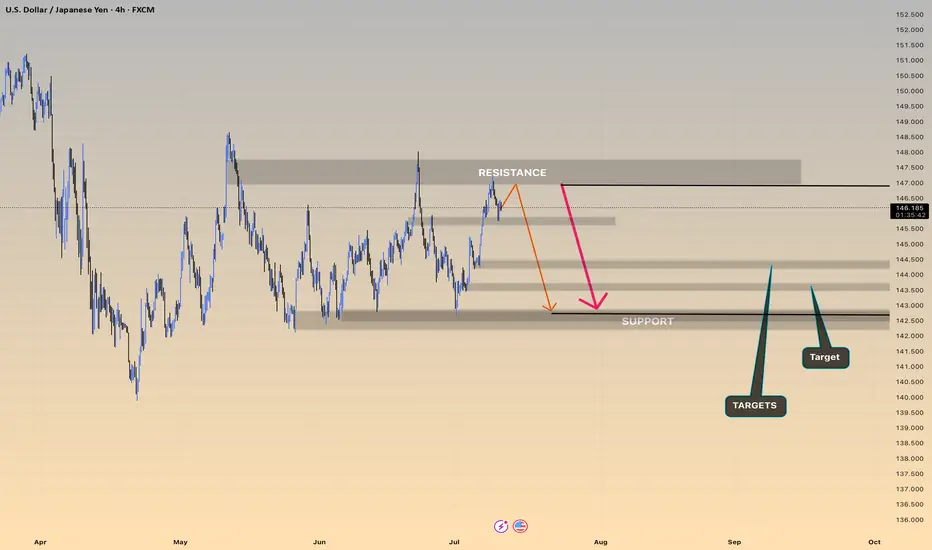
USDJPY Sell Idea Looking to sell between 146.800–147.180, targeting a move down to 145.000 with a stop loss at 147.400 to manage risk. This setup aims to catch a pullback from resistance after the recent rally, expecting the price to drop toward lower support.
As always, watch for bearish confirmation around the entry zone and trade with discipline.
Entry: 146.800 - 147.180
SL: 147.400
TP: 145.000

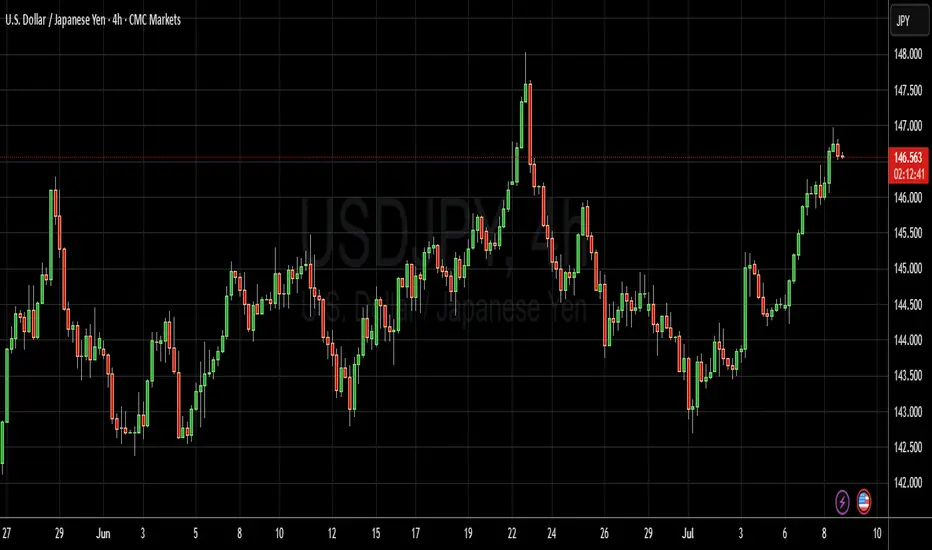
USDJPY IS THE ONLY FALLING h4Price dips below 143.000 support
Attracts breakout sellers
Sharp reversal back toward resistance at 146.500+
Target zone: 147.800 – 149.000
USD/JPY... Long/// 1:1 R:RHello. USD/JPY looks strong on daily time frame. RSI on 4h and 1h very high. GL
Forex Strategy: Long EUR/USD, Long USD/JPY, and Long USD/CHFForex Strategy: Long EUR/USD, Long USD/JPY, and Long USD/CHF
In my Forex strategy, I focus on going long on three key currency pairs: EUR/USD, USD/JPY, and USD/CHF. The core principle of this strategy lies in balancing these positions, with the total units of USD/CHF and USD/JPY equaling the total units of EUR/USD. This approach helps to hedge risks while capitalizing on favorable market conditions for the U.S. dollar.
The rationale behind going long on EUR/USD is based on expected strength in the Euro against the dollar, driven by economic indicators or geopolitical events in the Eurozone. Simultaneously, the USD/JPY long position is placed to benefit from any upward movement in the U.S. dollar against the Japanese yen, often influenced by U.S. interest rate changes or global risk sentiment.
The USD/CHF long position complements the other trades by maintaining a strong U.S. dollar exposure while mitigating potential volatility in other pairs. By ensuring the total units of USD/CHF and USD/JPY match the units in EUR/USD, I aim to maintain a balanced and diversified exposure to the market, minimizing risk while maximizing potential profit.
This strategy is dynamic and continuously adjusted based on market conditions and currency pair correlations.
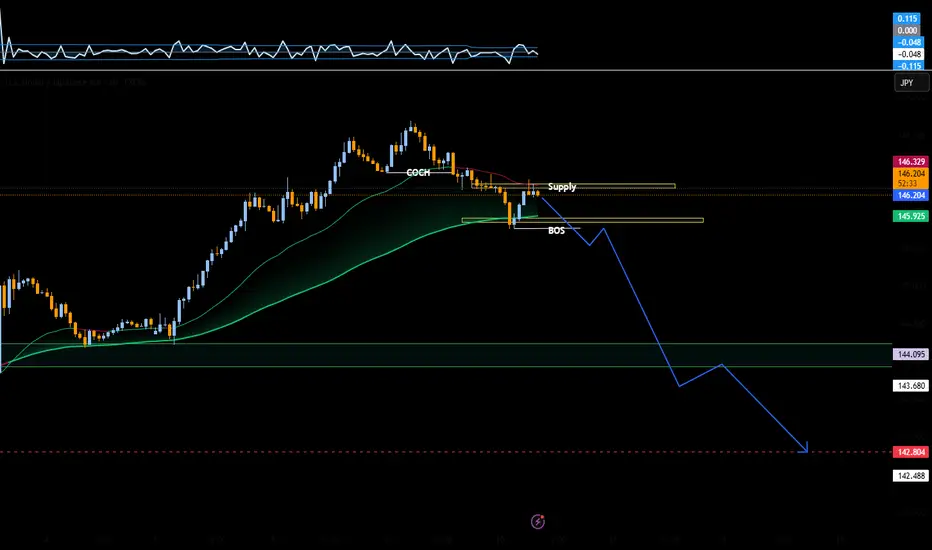
USDJPY Short Setup – Supply Zone Reaction After Structure Break After a clear break of structure (BOS) to the downside around the 145.92 level, USDJPY entered a retracement phase and is now retesting the supply zone created by the last bearish move. This area overlaps with the previous support turned resistance, as well as the dynamic resistance of the moving average, which strengthens the confluence.
We also had a Change of Character (CHOCH) earlier in the structure, marking a shift in momentum from bullish to bearish. The current price action has formed a lower high beneath the supply zone, suggesting that sellers are likely to defend this area.
I'm now watching for rejection signs from this 146.25–146.35 zone, which could confirm the bearish continuation. If price fails to break above this supply and shows weakness (e.g., bearish engulfing or long-wick rejections), I’ll look for entry opportunities to short.
Target:
The first short-term target is a move back to the BOS level at 145.92
A break below that could open the path to 144.09, the next significant support and previous demand zone
Summary:
This setup is based on classic smart money concepts: BOS, supply zone reaction, and a structural lower high. I’ll remain bearish unless the supply is broken cleanly with strong bullish momentum.
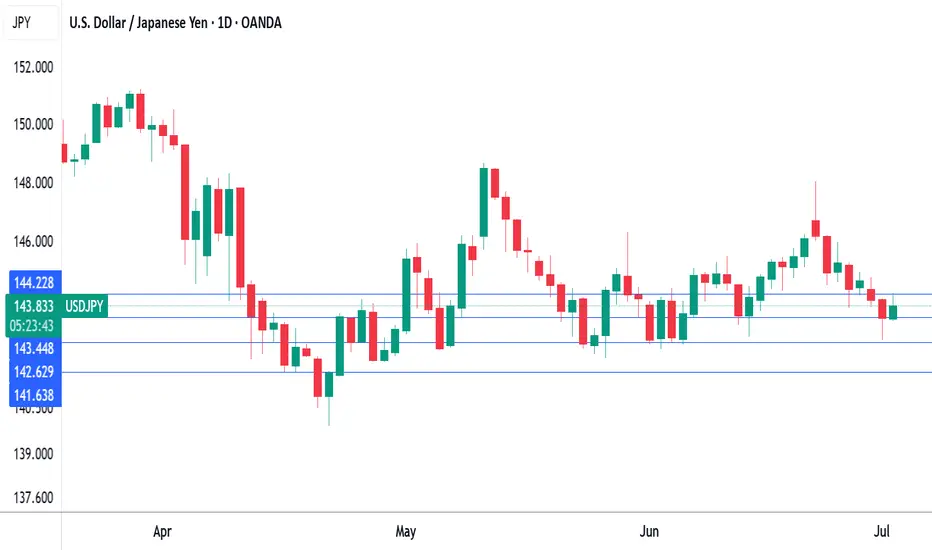
Japan Seeks US Deal as Tariff Deadline NearsThe yen hovered around 145 per dollar Friday after a nearly 1% drop in the previous session, pressured by trade uncertainties as Tokyo seeks a deal with Washington before next week’s deadline. Trump may announce new tariffs or extend deadlines today, having previously threatened tariffs up to 35% on Japanese goods over low US rice and car imports.
The yen also weakened as a stronger US dollar followed a better June jobs report, easing recession fears and reducing near-term Fed cut chances. In Japan, May household spending grew more than forecast, supported by government efforts to increase demand.
The key resistance is at $145.35, meanwhile the major support is located at $143.55.
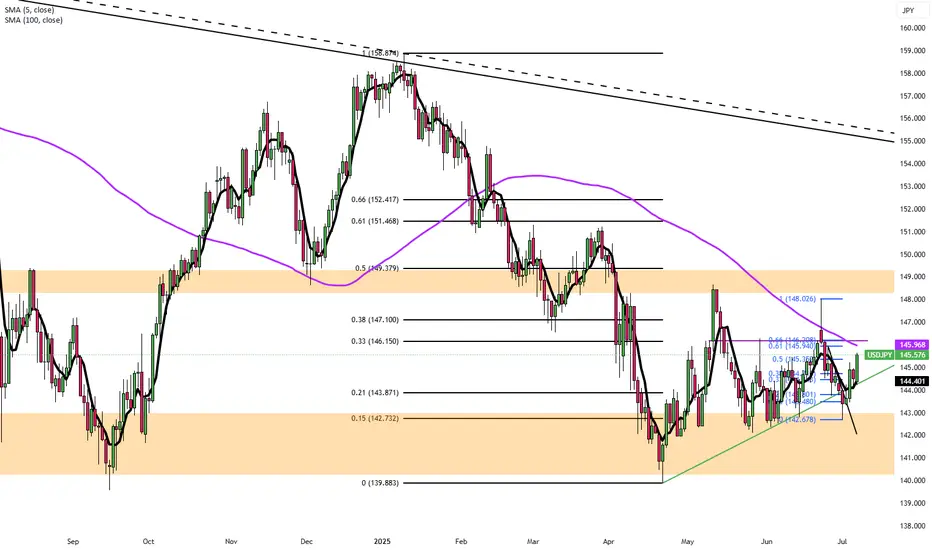
USD/JPY: Still a Safe-Haven Tug of WarUSD/JPY had surged past 147 on the back of Trump’s tariff letter to Japan—but quickly pulled back as risk appetite stabilized and Treasury yields softened. Price action now sits around the low-146s.
Technically, the 100-day SMA is providing key support just below 146.00. If bulls hold this level, we could see another push toward 147.20–148.00. On the downside, any surprise from upcoming Fed speakers or Japanese trade negotiations could send the pair testing the 144.00 zone again. Traders are watching Osaka closely, U.S. Treasury Secretary Scott Bessent is expected to meet Japanese officials at the World Expo, which could shape sentiment fast.
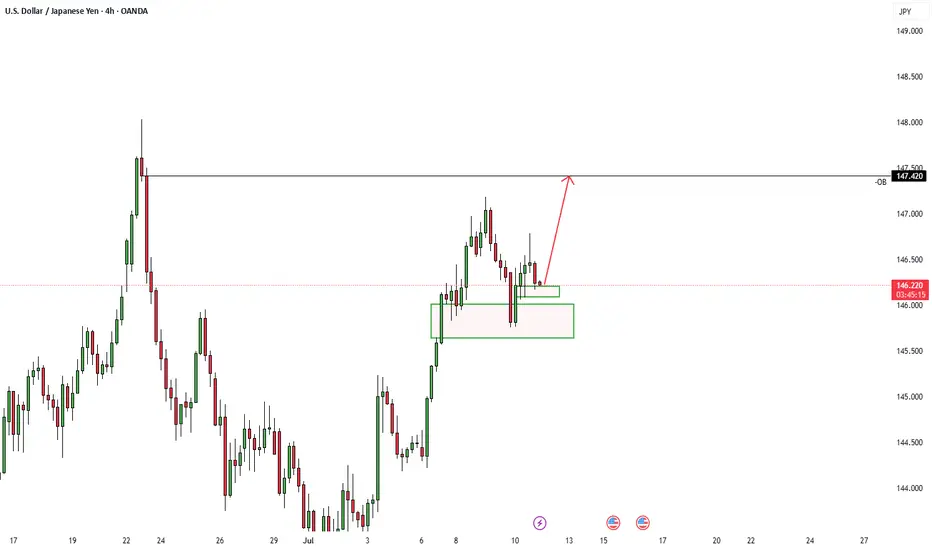
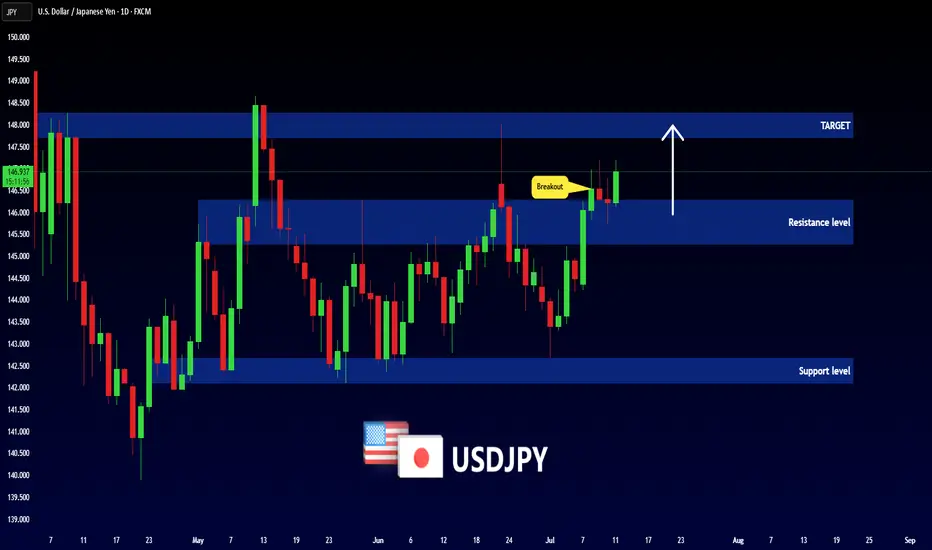
USDJPY - NEW BREAKOUT !Hello Traders !
After a huge bullish move,
The USDJPY broke the resistance level (146.285 - 145.280).
This key level becomes new support!
So, I expect a new bullish move🚀
_______________
TARGET: 147.700🎯
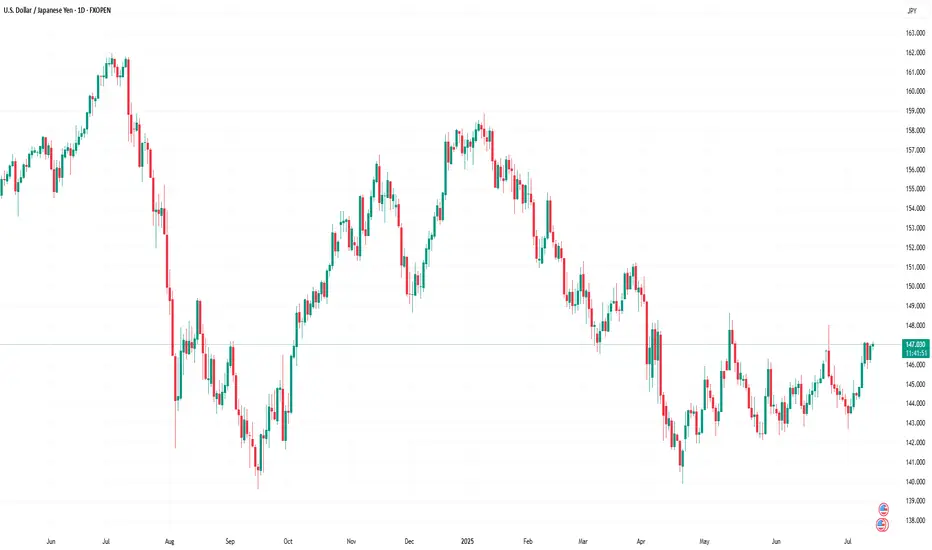
Forex Market Depth Analysis and Trading StrategiesForex Market Depth Analysis and Trading Strategies
Forex market depth analysis offers traders a deeper understanding of currency market dynamics. It reveals the real-time volume of buy and sell orders at different prices, which is crucial for assessing liquidity and trader sentiment. This article explores how to analyse and use market depth for trading, discussing various strategies and their limitations.
Forex Market Depth Explained
Market depth meaning is the volume of buy and sell orders at different price levels. It's a real-time snapshot of the pair’s liquidity and depth of supply (sell orders) and demand (buy orders). Traders use this information to gauge the strength and direction of a currency pair.
This depth is typically represented through an order book, displaying a currency pair’s existing orders at various price points. This book lists the number of units being bid or offered at each point, giving us insight into potential support and resistance levels. For instance, a large number of buy orders at a certain price level may indicate a strong support area, suggesting that many traders are willing to purchase the currency pair at this price.
Understanding market depth is crucial in assessing the likelihood of trades being executed at desired prices, especially in fast-moving currencies or when trading large volumes. It may help in identifying short-term price movements, offering a more nuanced view of an asset beyond just candlestick charts.
How to Analyse Market Depth
Analysing order flow is a fundamental aspect of market depth trading, providing traders with valuable insights into the supply and demand dynamics of forex pairs. Forex market depth can be assessed using various tools and indicators.
One key tool is the Depth of Market (DOM), which shows the number of buy and sell orders pending at different prices. DOM offers a visual representation of the currency pair’s order book, highlighting potential areas where large orders are placed. We can use such information to identify significant support and resistance levels where the pair might experience a turnaround.
Another essential tool is Level II quotes. These quotes provide detailed information about the price, volume, and direction of every trade executed in real-time. By analysing Level II quotes, traders may be able to identify the pair’s momentum and potential trend shifts. For example, if there is a sudden increase in sell orders at a particular price, it may indicate a potential downward movement, prompting us to adjust our positions accordingly.
Strategies Using Market Depth Analysis
In forex trading, market depth analysis is a crucial tool for understanding and executing a depth of market strategy. Here's how traders can leverage this type of analysis in their strategies:
Scalping Strategy
By closely observing the DOM, scalpers can identify minor price movements and liquidity gaps. For instance, if the DOM shows a large number of sell orders at a slightly higher price, a scalper might open a short position, anticipating a quick downturn. This strategy relies on fast, short-term trades, capitalising on small price changes.
Momentum Trading
Momentum traders use the order book to gauge the strength of a trend. By analysing the order flow and volume, they can determine if a trend is likely to continue or reverse. For example, a surge in buy orders at increasing prices may signal a strong upward momentum, prompting a trader to enter a long position. Conversely, a build-up of sell orders might indicate a potential downward trend.
Support and Resistance Trading
Depth analysis is invaluable for identifying key support and resistance levels. Clusters of orders often act as barriers, influencing price movements. Traders may use these levels to set entry and exit points. For example, a large number of buy orders at a specific price may indicate a strong support zone, reflecting a potentially good entry point for a long position.
Breakout Trading
Traders seeking breakout opportunities can use market depth to spot potential breakout points. A significant accumulation of orders just beyond a known resistance or support level may indicate a potential breakout. If the pair moves past these areas with high volume, it could signal the start of a new trend, potentially offering a lucrative trading opportunity.
Integrating Market Depth with Technical Analysis
Integrating a depth chart trading strategy with technical analysis may enhance decision-making, combining the real-time insights of depth charts with the power of technical indicators. For instance, we can use market depth to confirm signals from technical analysis tools.
If a moving average crossover suggests a bullish trend, a corresponding increase in buy orders in the depth chart may reinforce the signal. Similarly, a significant resistance level identified through technical analysis, such as a Fibonacci retracement level, might be substantiated if there’s a large accumulation of sell orders at that price point.
Risks and Limitations of Market Depth Analysis
While market depth analysis is a valuable tool in forex trading, it comes with certain risks and limitations:
- Dynamic and Fast-Changing Data: Order book data is highly dynamic, often changing within seconds, making it challenging to base long-term strategies solely on such information.
- Lack of Centralisation in Forex: Unlike stock exchanges, the forex market lacks a centralised exchange. This decentralisation means depth data might not represent the entire marketplace accurately.
- Susceptibility to 'Spoofing': Large players might place and quickly withdraw large orders to manipulate market depth perception, misleading other traders. It’s worth noting that spoofing is illegal in many jurisdictions.
- Limited Usefulness in Highly Liquid Markets: In highly liquid pairs, the depth of market data may become less relevant, as large orders are quickly absorbed without significantly impacting prices.
- Dependency on Broker's Data: The reliability of order book data depends on the broker's technology and the size of their client base, which can vary widely.
The Bottom Line
Market depth analysis provides critical insights for forex traders, though it's vital to recognise its dynamic nature and limitations. Integrating it with technical analysis may create robust trading strategies.
This article represents the opinion of the Companies operating under the FXOpen brand only. It is not to be construed as an offer, solicitation, or recommendation with respect to products and services provided by the Companies operating under the FXOpen brand, nor is it to be considered financial advice.
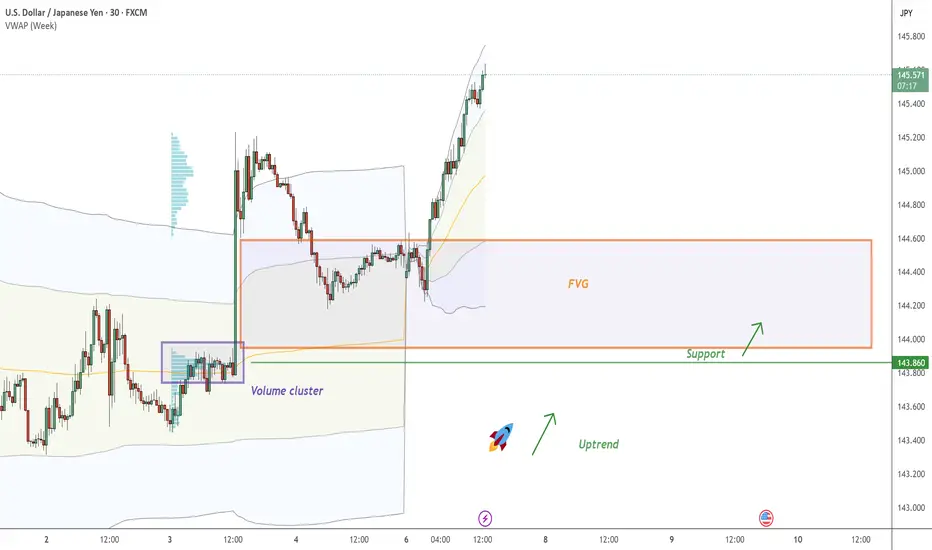
USD/JPY - continue with the UptrendOn USD/JPY , it's nice to see a strong buying reaction at the price of 143.860.
There's a significant accumulation of contracts in this area, indicating strong buyer interest. I believe that buyers who entered at this level will defend their long positions. If the price returns to this area, strong buyers will likely push the market up again.
(FVG) - Fair Value GAP and high volume cluster are the main reasons for my decision to go long on this trade.
Happy trading
Dale
USD/JPY Bearish Flag (30.06.2025)The USD/JPY Pair on the M30 timeframe presents a Potential Selling Opportunity due to a recent Formation of a Bearish Flag Breakout Pattern. This suggests a shift in momentum towards the downside in the coming hours.
Possible Short Trade:
Entry: Consider Entering A Short Position around Trendline Of The Pattern.
Target Levels:
1st Support – 143.40
2nd Support – 142.86
🎁 Please hit the like button and
🎁 Leave a comment to support for My Post !
Your likes and comments are incredibly motivating and will encourage me to share more analysis with you.
Best Regards, KABHI_TA_TRADING
Thank you.
Disclosure: I am part of Trade Nation's Influencer program and receive a monthly fee for using their TradingView charts in my analysis.

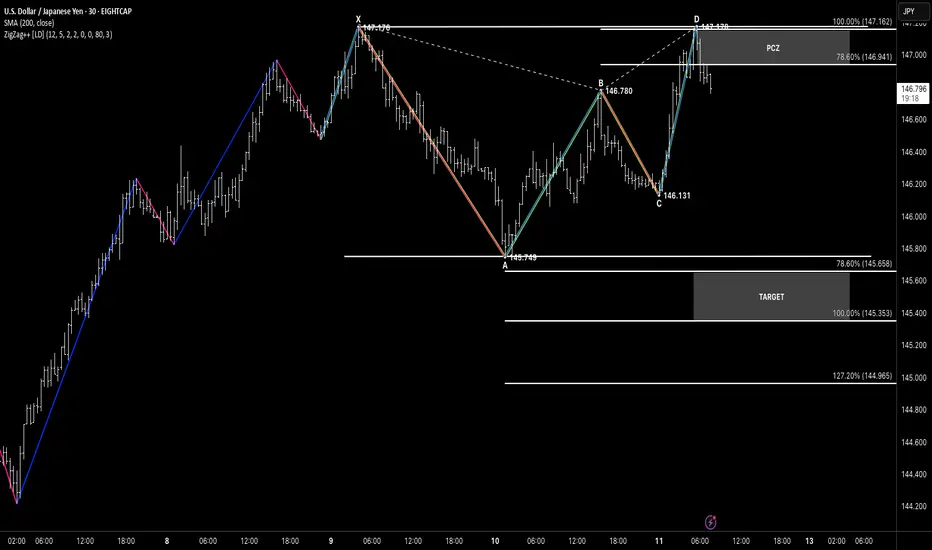
XABCD Double Top
Hello traders! I hope you’ve had a productive trading week.
Let’s take a look at USDJPY, where we’re wrapping up the week with a textbook XABCD Double Top formation.
📍 Structure Overview
Price action completed an extended XABCD formation, with D printing a perfect double top around the 147.17 level.
The move from C to D aligns closely with the prior XA leg, showing strong symmetry in price.
D terminates precisely within the PCZ (Potential Completion Zone), aligning with both 78.6% and 100% extensions.
🎯 Bearish Targets Below
If this Double Top confirms with bearish follow-through, the structure offers a clean setup with downside targets:
Target 1: 145.35 (100%)
Target 2: 144.96 (127.2%)
A break below point C (146.13) would further validate the bearish thesis.
🧠 Pattern Highlights
XABCD geometry
Strong price symmetry
Completion into previous high (resistance)
Clear target zone for risk-defined trades
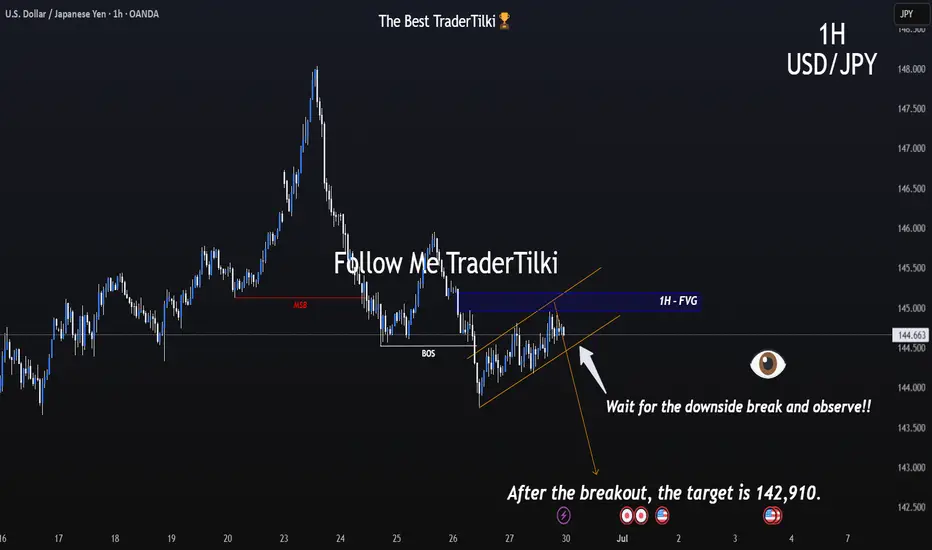
Critical Channel Watch Begins on the 1-Hour Chart of USDJPY.Hey everyone,
📉 My Latest USDJPY Analysis:
USDJPY is currently moving within a downtrend. If the price breaks below the lower boundary of the parallel channel, our first target level will be 142.910. The most crucial factor here is the downward breakout of that channel—don’t overlook it.
Also, keep a close eye on key economic data releases on the fundamental side, as they could significantly influence your strategy.
I meticulously prepare these analyses for you, and I sincerely appreciate your support through likes. Every like from you is my biggest motivation to continue sharing my analyses.
I’m truly grateful for each of you—love to all my followers💙💙💙
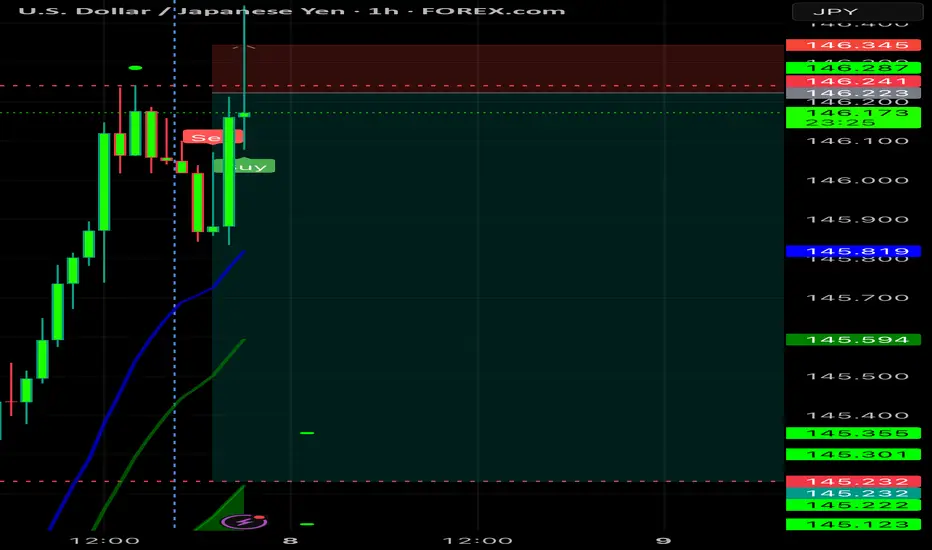
USDJPY 30Min Engaged ( Bullish Entry Detected )➕ Objective: Precision Volume Execution
Time Frame: 30-Minute Warfare
Entry Protocol: Only after volume-verified breakout
🩸 Bullish From now Price : 146.750
➗ Hanzo Protocol: Volume-Tiered Entry Authority
➕ Zone Activated: Dynamic market pressure detected.
The level isn’t just price — it’s a memory of where they moved size.
Volume is rising beneath the surface — not noise, but preparation.
🔥 Tactical Note:
We wait for the energy signature — when volume betrays intention.
The trap gets set. The weak follow. We execute.
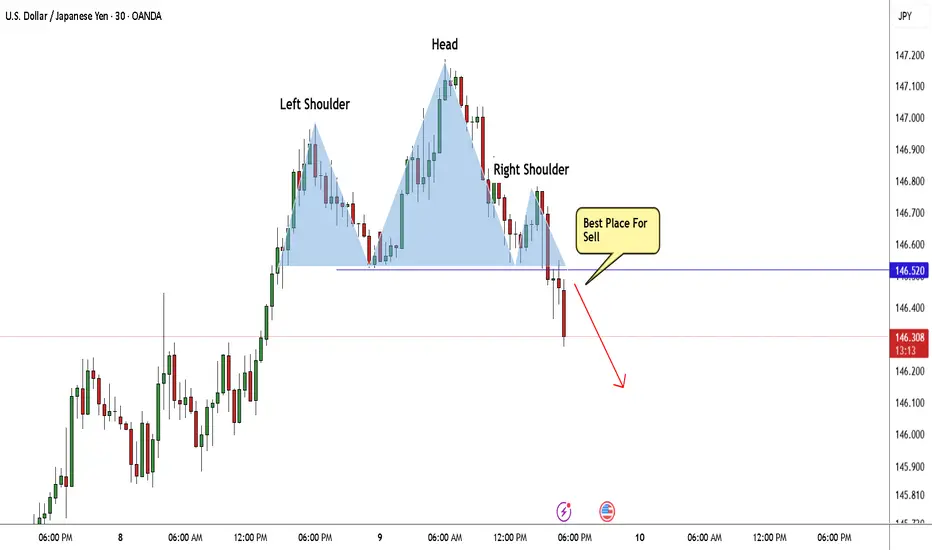
USD/JPY Made H&S Reversal Pattern , Short Setup Valid !Here is my 15 Mins Chart on USD/JPY , We have a very clear reversal pattern , head & shoulders pattern and we have a confirmation by closure below our neckline so we can enter direct now or waiting the price to go back and retest the neckline and this is my fav scenario .
USDJPY - Cypher Pattern Walkthrough & Continuation TradeA walkthrough of a potential Bearish Cypher pattern & a look at another opportunity that has recently popped up ahead of the potential pattern setup.
Questions or Comments - Leave them below!
Akil

Trump threatens tariff on Japan as deadline looms, yen dipsThe Japanese yen is negative ground on Thursday. In the North American session, USD/JPY is trading at 144.06, up 0.47%.
The US and Japan are racing to reach a trade deal before a deadline of July 9. There are some serious roadblocks to a deal, including the current US tariff of 25% on Japanese cars and opening Japan's agricultural sector, particularly rice. President Trump has insisted that Japan import American-grown rice, but the Japanese government says that is unacceptable.
Japan's Economy Minister Ryosei Akawaza said earlier this week that Japan would not "sacrifice the agricultural sector", while Farm Minister Shinjiro Koizumi said that foreign rice imports would threaten Japan's food security.
It's a shortened week in the US due to the Fourth of July holiday on Friday. The US will release the June employment report on Thursday, with all eyes on nonfarm payrolls.
Nonfarm payrolls eased slightly in May to 137 thousand from 147 thousand and the downward trend is expected to continue, with a consensus of 110 thousand for June. This would mark the weakest pace of job growth since 2020, with the exception of a meltdown in job growth in Oct. 2024.
The Federal Reserve will also be monitoring the nonfarm payroll report. The US labor market has been weakening and the Fed is concerned that the jobs market could show a sharp deterioration. Currently, the most likely date for the next Fed rare cut is September, but a soft NFP reading south of 90 thousand would boost the case for a cut at the July 30 meeting.
The Fed has maintained a wait-and-see stance since Nov. 2024 but that is expected to change in the fourth quarter, where we could see up three rate cuts.
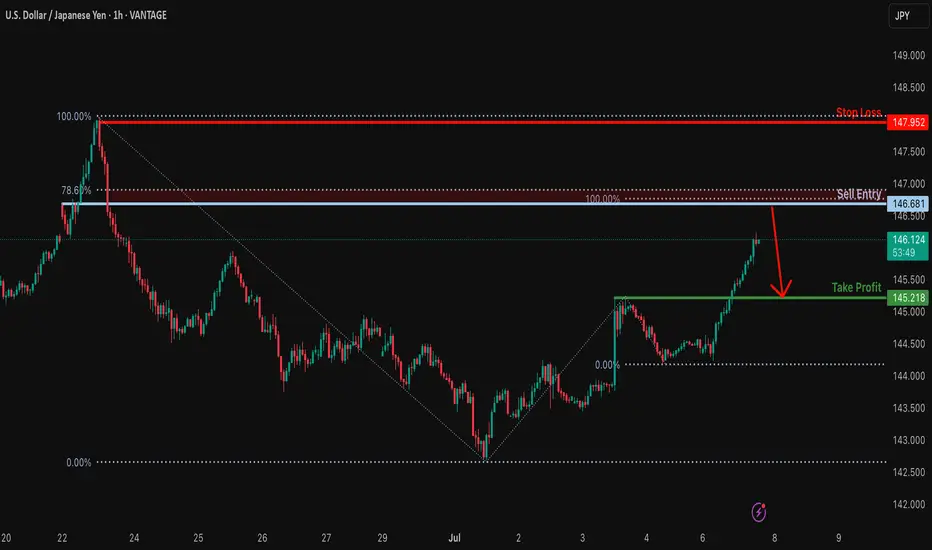
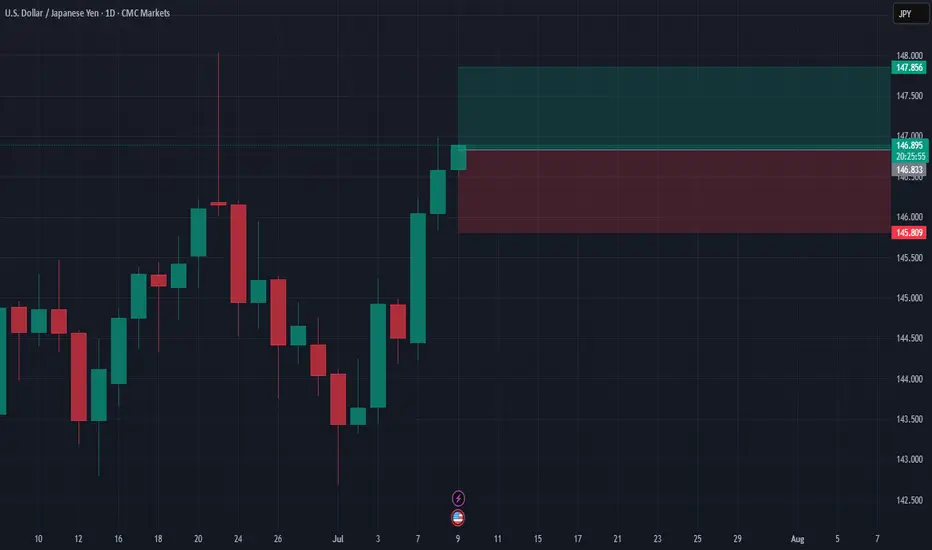
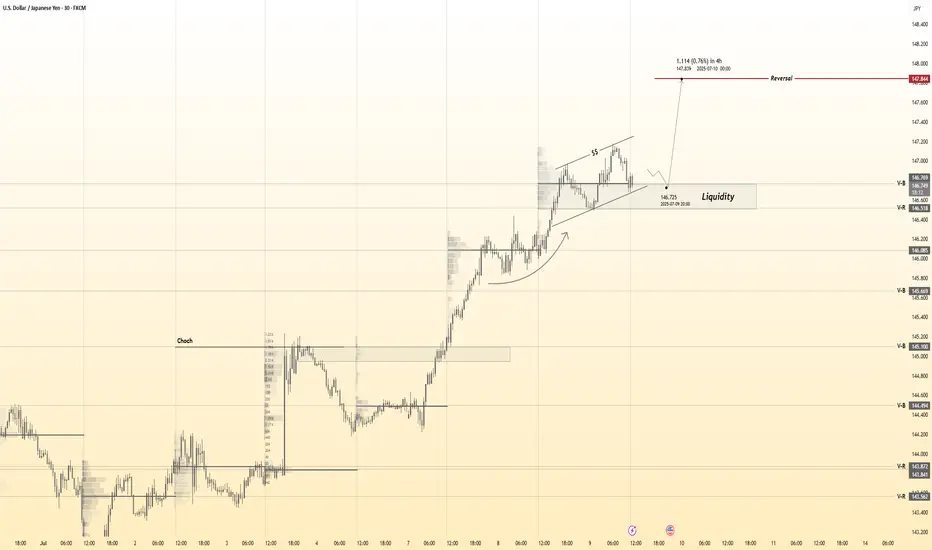
Bearish reversal?USD/JPY is rising towards the resistance level which lines up with 100% Fibonacci projection and also slightly below the 78.6% Fibonacci retracement and could reverse from this level too ur take profit.
Entry: 146.68
Why we like it:
There is a resistance level that lines up with the 100% Fibonacci projection and also slightly below the 78.6% Fibonacci retracement.
Stop loss: 147.95
Why we like it:
There is a swing high resistance.
Take profit: 145.21
Why we like it:
There is a pullback support level.
Enjoying your TradingView experience? Review us!
Please be advised that the information presented on TradingView is provided to Vantage (‘Vantage Global Limited’, ‘we’) by a third-party provider (‘Everest Fortune Group’). Please be reminded that you are solely responsible for the trading decisions on your account. There is a very high degree of risk involved in trading. Any information and/or content is intended entirely for research, educational and informational purposes only and does not constitute investment or consultation advice or investment strategy. The information is not tailored to the investment needs of any specific person and therefore does not involve a consideration of any of the investment objectives, financial situation or needs of any viewer that may receive it. Kindly also note that past performance is not a reliable indicator of future results. Actual results may differ materially from those anticipated in forward-looking or past performance statements. We assume no liability as to the accuracy or completeness of any of the information and/or content provided herein and the Company cannot be held responsible for any omission, mistake nor for any loss or damage including without limitation to any loss of profit which may arise from reliance on any information supplied by Everest Fortune Group.