USDJPY Potential DownsidesHey Traders, in today's trading session we are monitoringUSDJPY for a selling opportunity around 145.700 zone, USDJPY is trading in a downtrend and currently is in a correction phase in which it is approaching the trend at 145.700 support and resistance area.
Trade safe, Joe.
JPYUSD trade ideas
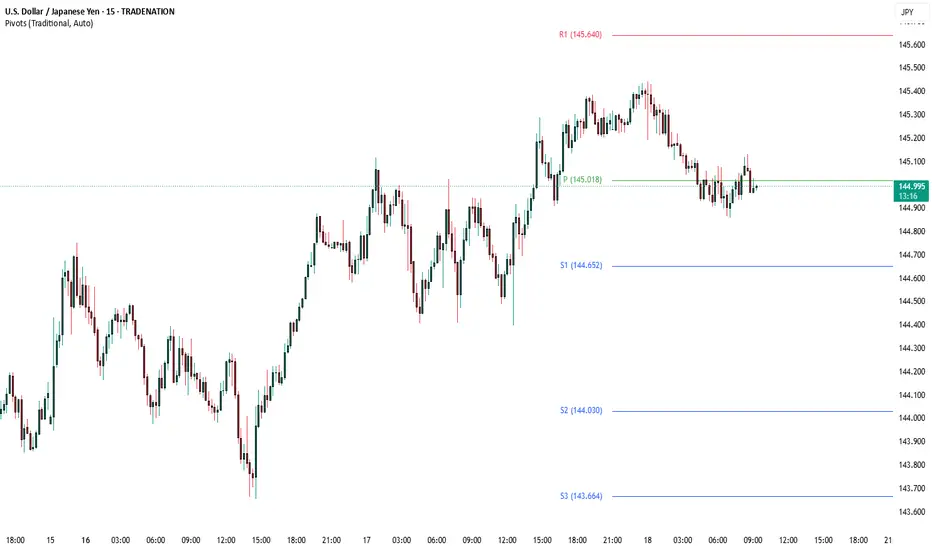
USDJPY Technical Analysis! SELL!
My dear friends,
Please, find my technical outlook for USDJPY below:
The price is coiling around a solid key level - 145.43
Bias - Bearish
Technical Indicators: Pivot Points Low anticipates a potential price reversal.
Super trend shows a clear sell, giving a perfect indicators' convergence.
Goal - 144.58
Safe Stop Loss - 145.90
About Used Indicators:
The pivot point itself is simply the average of the high, low and closing prices from the previous trading day.
Disclosure: I am part of Trade Nation's Influencer program and receive a monthly fee for using their TradingView charts in my analysis.
———————————
WISH YOU ALL LUCK

Possible Sells on USDJPY Patiently waiting for price to get into my M15 Order Block then I'll enter a sell
USDJPY 30M ChartUSDJPY is trading within an ascending triangle pattern on the 30-minute timeframe.
Price is testing a key horizontal resistance zone near 145.40, while maintaining higher lows — suggesting potential breakout pressure building.
🔍 Possible Scenarios:
🔺 Bullish Breakout: Above 145.40 — Expect a move towards 146.50/147.50 (TP marked).
🔻 Bearish Breakdown: Below 145.00 — Potential drop towards 143.00/142.50 (TP marked).
Both entry points and target levels are highlighted for clarity. Ichimoku Cloud supports this setup with a light trend indication.
Waiting for clear breakout confirmation before taking any position is advised.
— Not financial advice. For educational and analytical purposes only.

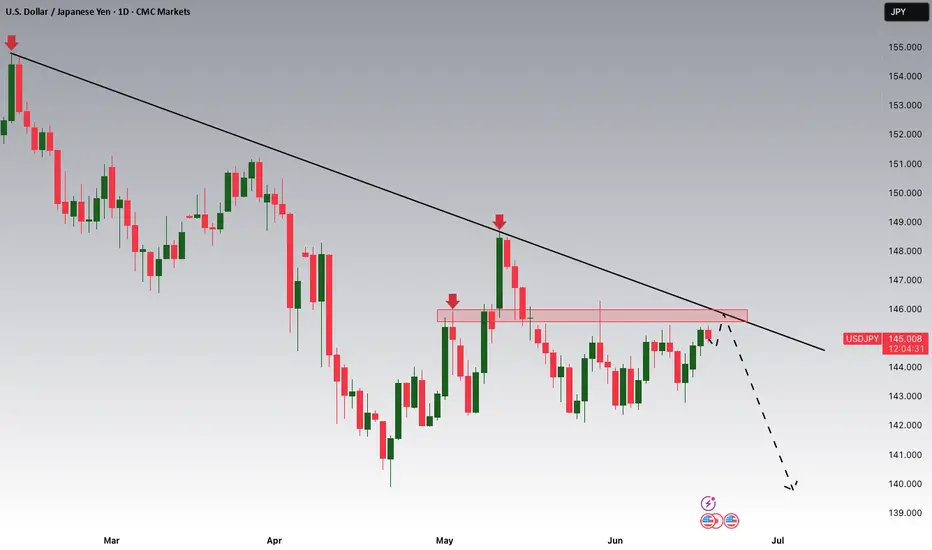
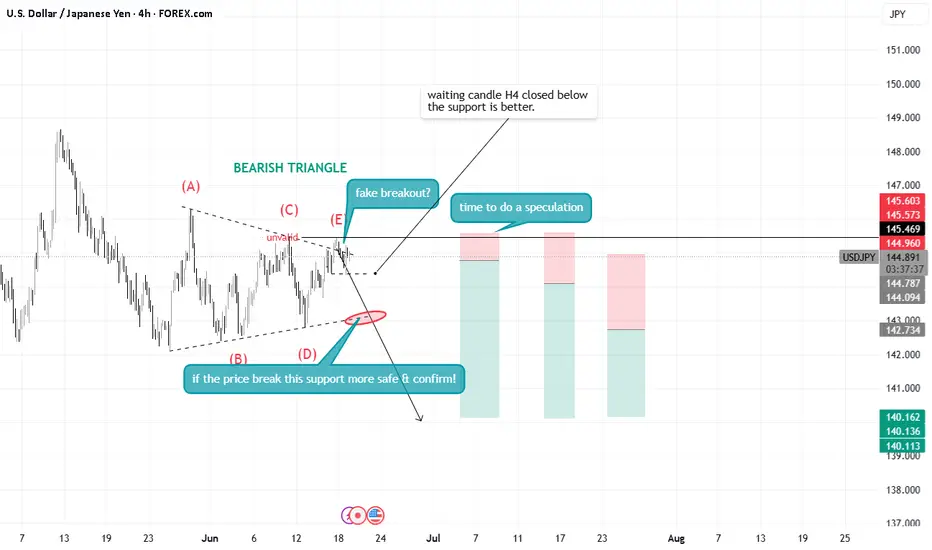
USDJPY sell IdeaTechnical analysis suggests a bearish pennant formation is emerging, potentially leading to a price breakout in the opposite direction of Wave E. Consequently, USD/JPY may experience a decline to at least $142.
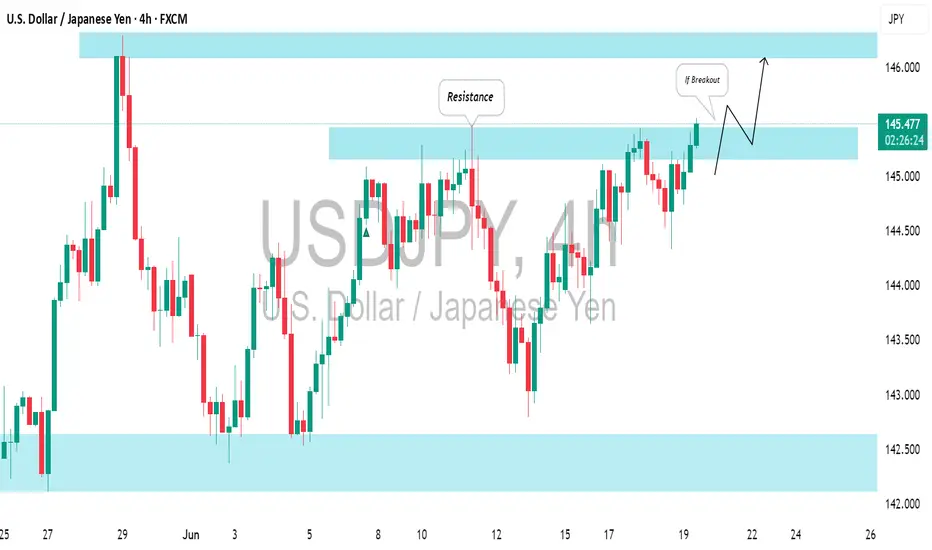
USDJPY: Waiting For a Breakout to Buy⚠️USDJPY is in a strong bullish trend on an intraday chart and is currently testing a significant horizontal resistance.
I'm looking for a breakout, specifically a 4-hour candle closing above it, to enter a buy position.
A bullish break of the highlighted blue area will provide a strong signal, potentially driving prices up to the 146.10 resistance level.
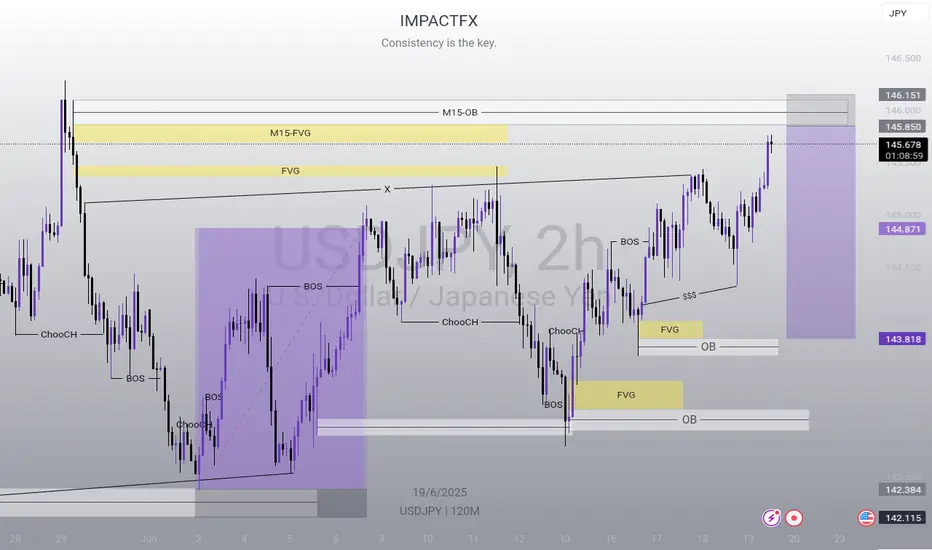
USDJPYUSDJPY Trading Plan.
"Now let’s look at the Smart Money Concept behind USD/JPY.
A classic liquidity grab took place in the 142.8 to 143.0 zone — triggering stop-losses and then sharply reversing upward. This is a textbook example of institutional accumulation after sweeping retail traders."
"We also see a bullish order block and a fair value gap forming in the same area on both the daily and H4 charts. That makes this zone a high-probability entry point for smart money traders."
"A change of character is clearly visible as the price structure on H4 and H1 shifts from bearish to a more consolidative and bullish tone — especially after a strong reversal candle near the FVG support."
"In summary, institutions are quietly building long positions around 142.8 to 143.0 — and it’s a highly favorable entry zone, with a logical stop-loss just below 142.3."

Yen Slips as Fed Holds and Risks MountThe yen weakened past 145 on Thursday, nearing a three-week low as the stronger U.S. dollar gained support from the Fed’s steady rate decision and cautious outlook. Concerns over Trump’s tariffs and Middle East tensions increased safe-haven demand for the dollar over the yen.
The BOJ also kept rates unchanged Tuesday and signaled a gradual asset reduction. Governor Ueda noted that rate hikes remain possible if inflation rises.
The key resistance is at $145.30 meanwhile the major support is located at $142.50.


DXY: STEP BY STEP.There was not much to yesterday as we awaited the FOMC minutes to know the Fed's rates decision.Interest rates remain unchanged so unless there are geopolitical catalysts I expect the dollar to rebound to 100.00 if there is successive break above 99.00. Subsequently leading to a higher price in dollar v yen. Patiently waiting to long this pair step by step. If London sessions fails then we wait for NY session.
#Happy Trading Y'all.


USDJPY - BEARISH TRIANGLE PATTERN ? hi everyone
this is just a information
not a signal
please be smart
here what i see , and i do 3 scenario :D
highrisk
medium
and
low risk
enjoy
please be smart
save your money
make a reset and do your own analysis
wish all get profit today
usd/jpyTRADE 1 im still running on this trade from yesterday but new entry level is here retracment on the fib is bang on 61% so could be looking to retrace to a new lower low lets see where this takes us tommorow

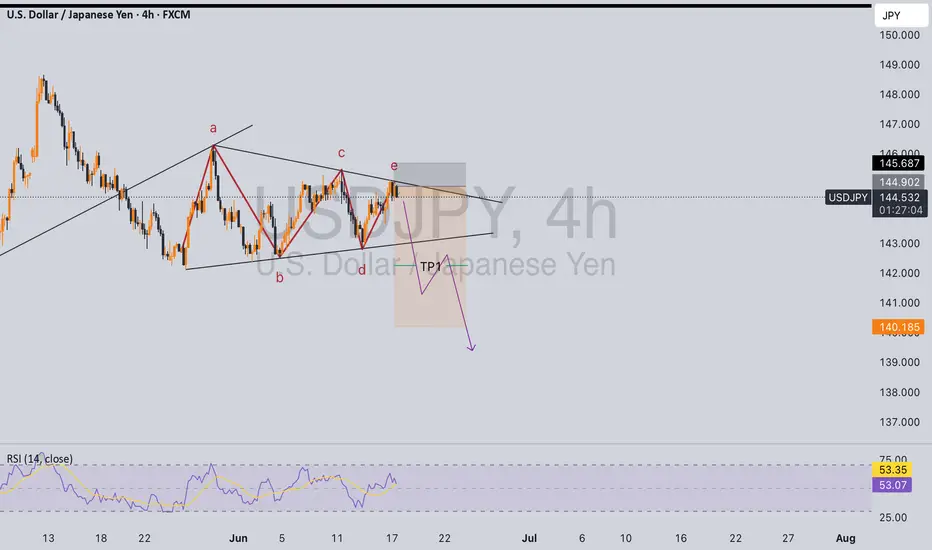
USD/JPY – Bearish Symmetrical Triangle Break Incoming?USD/JPY is currently consolidating within a well-defined symmetrical triangle, respecting both the ascending and descending trendlines with clean touches. This structure typically precedes a volatile breakout, and the technical confluence here favors a bearish resolution.
🔍 Technical Breakdown:
Price failed to hold above the 0.5 Fib level of the recent swing high at 145.377, getting rejected by both the 200 EMA and the triangle resistance zone.
Currently testing the 0.382 retracement (144.607) — a break here opens the door for a drop to the 0.236 level (143.653) and potentially deeper into previous demand.
Volume compression and EMA clustering further support an imminent breakout move.
📐 Bearish Confluences:
Rising wedge/symmetrical triangle pattern showing exhaustion.
Strong rejection at the equilibrium of the range.
EMAs acting as dynamic resistance.
Major fib cluster from previous bearish leg aligning with triangle apex.
🎯 Targets:
TP1: 143.653 (0.236 Fib)
TP2: 142.111 (local low)
TP3: 140.347 (-0.27 Fib extension, full measured move of triangle)
❌ Invalidation:
Clean break above 145.526 (mid-structure + fib zone) would neutralize the setup.
💬 Market Context: Watch closely for a breakout confirmation. Smart money may sweep short-term liquidity before a decisive drop. Stay nimble, and remember — structure always tells the story.

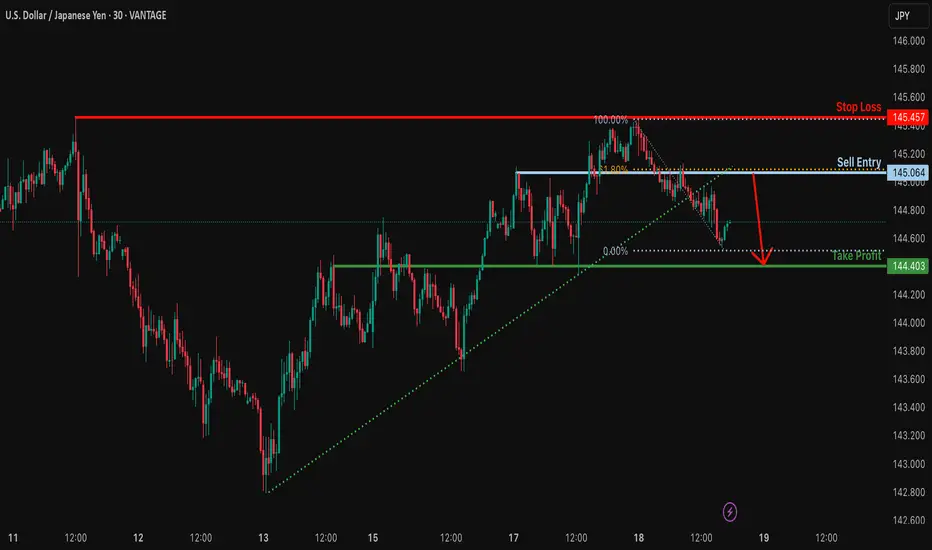
Bearish drop off 61.8% Fibonacci resistance?USD/JPY is rising towards the resistance level that lines up with the 61.8% Fibonacci retracement nds could reverse from this level to our take profit.
Entry: 145.06
Why we like it:
There is an overlap resistance level that lines up with the 61.8% Fibonacci retracement.
Stop loss: 145.45
Why we like it:
There is a pullback resistance level.
Take profit: 144.40
Why we like it:
There is an overlap support level.
Enjoying your TradingView experience? Review us!
Please be advised that the information presented on TradingView is provided to Vantage (‘Vantage Global Limited’, ‘we’) by a third-party provider (‘Everest Fortune Group’). Please be reminded that you are solely responsible for the trading decisions on your account. There is a very high degree of risk involved in trading. Any information and/or content is intended entirely for research, educational and informational purposes only and does not constitute investment or consultation advice or investment strategy. The information is not tailored to the investment needs of any specific person and therefore does not involve a consideration of any of the investment objectives, financial situation or needs of any viewer that may receive it. Kindly also note that past performance is not a reliable indicator of future results. Actual results may differ materially from those anticipated in forward-looking or past performance statements. We assume no liability as to the accuracy or completeness of any of the information and/or content provided herein and the Company cannot be held responsible for any omission, mistake nor for any loss or damage including without limitation to any loss of profit which may arise from reliance on any information supplied by Everest Fortune Group.
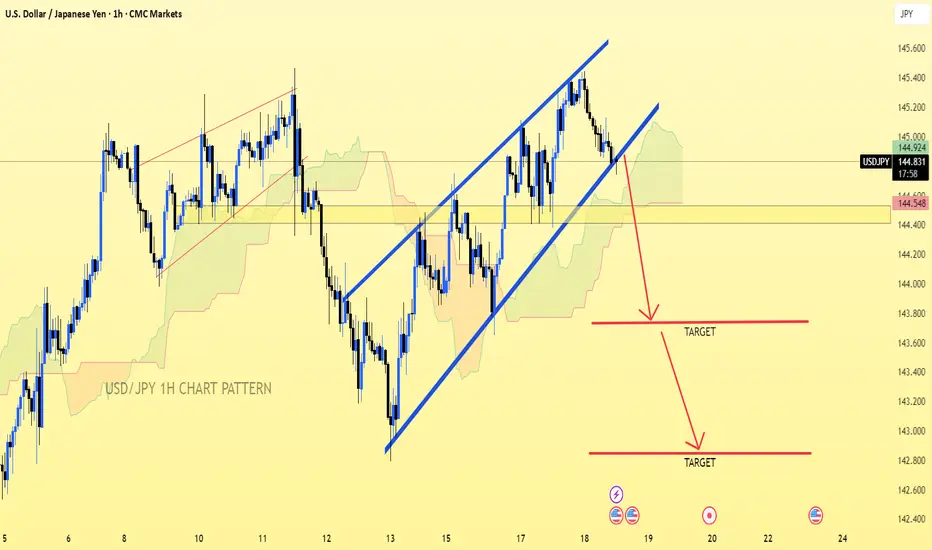
USD/JPY.1h chart pattern.(USD/JPY 1H), the price has broken below the rising channel, suggesting a bearish move ahead. Here are the two key target levels marked on My chart:
Targets:
1. First Target: Around 144.100
2. Second (Deeper) Target: Around 143.200
These levels align with previous support zones and measured moves from the channel breakdown.
Let me know if you’d like stop-loss or entry suggestions too.
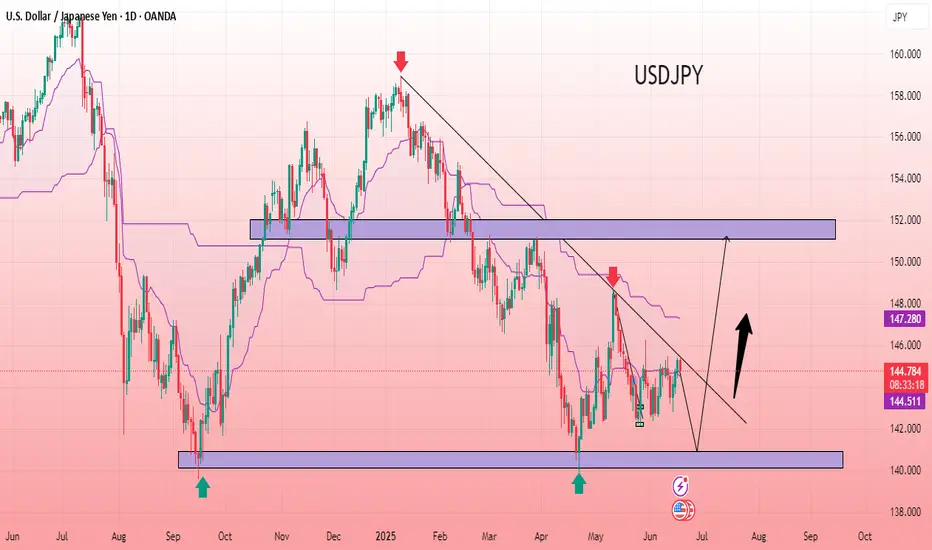
USD/JPY BULLISH SETUPThe USD/JPY daily chart indicates a potential bullish reversal setup. Price has been consolidating within a descending trendline and has recently bounced from a strong support zone around 140.000. The presence of multiple rejections from the lower support zone suggests buying interest. A breakout above the trendline confirms bullish momentum. The Ichimoku cloud is narrowing, indicating potential for trend shift. The market is eyeing a move towards the next resistance zone aligned near a previous supply area. Bullish confirmation with rising volume could fuel further upside. A break and hold above resistance may lead to further continuation in the coming sessions.
Entry Point: 142.100/141.000
Target Point: 151.110
If you found this analysis helpful, don’t forget to drop a like and comment. Your support keeps quality ideas flowing—let’s grow and win together! 💪📈
USDJPY – Fed Meeting Ahead With Range Highs In FocusYesterday’s Bank of Japan meeting saw the central bank act as expected. They kept interest rates unchanged and slowed the pace at which they will decrease monthly JGB purchases by half to help ensure market stability. This eventually assisted USDJPY to push higher and touch a peak early this morning at 145.44, matching a monthly high set on June 11th (145.46).
So far, this move to June range highs has been met with fresh selling, but there is still a lot for FX traders to consider moving into the Friday close, including an escalating conflict in the Middle East that has seen Israel and Iran exchange fire for six days in a row, and more importantly for wider financial markets, has drawn the full attention of President Trump and his national security team. How this situation evolves across the remainder of this week could influence the direction of USDJPY.
Also important could be the outcome later this evening of the Federal Reserve (Fed) Interest Rate Decision (1900 BST) and Press Conference (1930 BST). No change to interest rates is expected as policymakers, including Chairman Powell have been clear that they are currently in wait and see mode before making their next move, however their updated projections for US inflation, growth, and rate cuts may provide some extra volatility for USDJPY prices if these deviate from market expectations.
We shouldn’t forget it is also a holiday in the US tomorrow so liquidity could be reduced, so assessing the technical outlook, including relevant support and resistance levels may be useful.
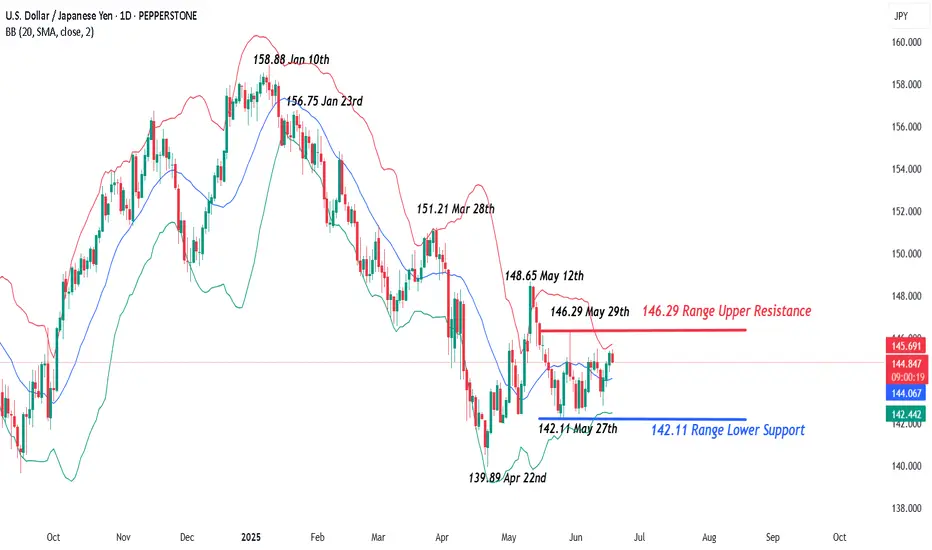
Technical Update: Balanced Range Extends into Fed Meeting
Little has changed in USDJPY price activity from a technical perspective following Tuesday’s Bank of Japan meeting, and the focus now shifts to Wednesday’s Fed meeting in the US as the next potential sentiment driver for price.
As the chart above shows, the latest USDJPY activity has been held within a sideways range marked by potential support at 142.11, the May 27th session low, and potential resistance at 146.29, the May 29th session high.
This latest price activity may be an indication of trader uncertainty as to the direction of the next move and possibly the need for prices to ‘breakout’ and establish where the next directional risks might lay.
Of course, nothing is guaranteed and a closing break above resistance or below support might not see a more sustained phase of price movement, however being prepared is important.
Let’s consider the potential levels traders might find useful to watch if a breakout from the current sideways range is seen.
Potential Resistance Levels:
Successful closing breaks above 146.29 might be viewed by some as opening scope to higher levels and may possibly lead to a more sustained phase of price strength.
It’s at this time that the focus for traders may shift to the next potential resistance which could be at 148.65, the May 12th session high, even 151.21, the March 28th peak.
Potential Support Levels:
Equally possible within the current more balanced sideways price activity, is that a closing break under support provided by the May 27th low at 142.11 might well develop and be viewed as a potential negative breakout from the current sideways price range.
If closes below support at 142.11 are seen over the coming sessions, it might reflect for moves to even lower levels in price, with traders potentially shifting their focus to the April 22nd low trade at 139.89 as the possible next support.
The material provided here has not been prepared
accordance with legal requirements designed to promote the independence of investment research and as such is considered to be a marketing communication. Whilst it is not subject to any prohibition on dealing ahead of the dissemination of investment research, we will not seek to take any advantage before providing it to our clients.
Pepperstone doesn’t represent that the material provided here is accurate, current or complete, and therefore shouldn’t be relied upon as such. The information, whether from a third party or not, isn’t to be considered as a recommendation; or an offer to buy or sell; or the solicitation of an offer to buy or sell any security, financial product or instrument; or to participate in any particular trading strategy. It does not take into account readers’ financial situation or investment objectives. We advise any readers of this content to seek their own advice. Without the approval of Pepperstone, reproduction or redistribution of this information isn’t permitted.
We will be a seller again.* **Key Level**: 144.500 is the trigger zone. If broken downward, a sell becomes high probability.

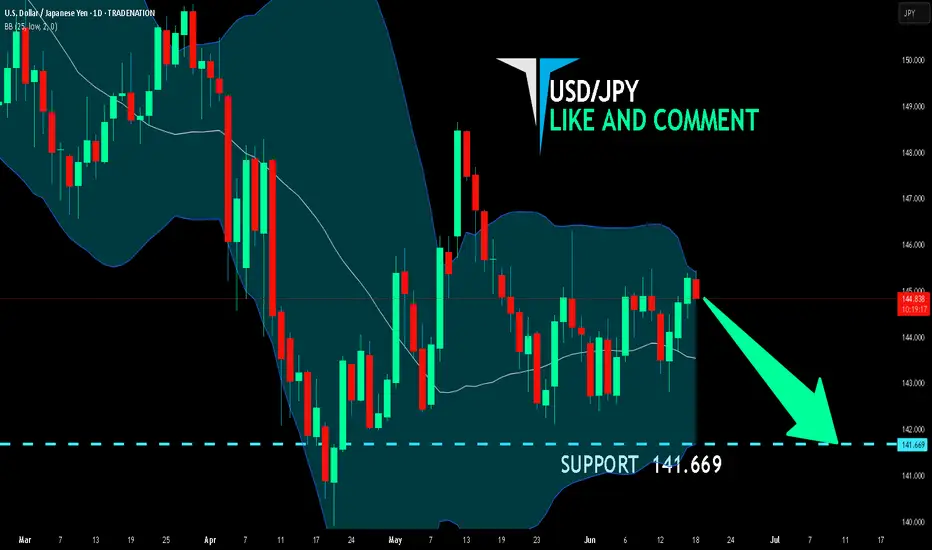
USD/JPY BEARS ARE GAINING STRENGTH|SHORT
Hello, Friends!
USD/JPY pair is in the uptrend because previous week’s candle is green, while the price is evidently rising on the 1D timeframe. And after the retest of the resistance line above I believe we will see a move down towards the target below at 141.669 because the pair overbought due to its proximity to the upper BB band and a bearish correction is likely.
Disclosure: I am part of Trade Nation's Influencer program and receive a monthly fee for using their TradingView charts in my analysis.
✅LIKE AND COMMENT MY IDEAS✅
USD/JPY Trade Setup – 1H Timeframe- Wk 9We are currently observing the USD/JPY pair on the 1-hour chart, and the trend remains strongly bullish. There is no divergence present, which confirms trend continuation. A bullish flag pattern has formed, suggesting a potential breakout to the upside.
The pair has recently completed a healthy retracement and tested the 0.5 Fibonacci level, which further supports our bullish bias. Based on this setup, we are executing an instant buy trade with a well-calculated risk-to-reward strategy.
🔹 Pair: USD/JPY
🔹 Trend: Bullish
🔹 Pattern: Bullish Flag
🔹 Fibonacci Level: 0.5 Tested
🔹 Entry Point: 144.942 (Instant Buy)
🔹 Stop Loss: 144.345
🔹 Take Profit 1: 145.539
🔹 Take Profit 2: 146.136
🔹 Lot Size: 0.24
🔹 Risk/Reward Ratio: 1:1 and 1:2
🔹 Risk: $200
🔹 Potential Reward: $300
🎯 Outlook: Expecting bullish continuation.
📌 #USDJPY #ForexSignals #BullishFlag #TechnicalAnalysis #PriceActionTrading #FibonacciRetracement #BreakoutSetup #ForexStrategy #RiskRewardRatio #ForexTradeIdea #1HChart #ForexMarket #FXTrading #SmartMoneyConcepts

Market Analysis: USD/JPY Recovers Above 145.00Market Analysis: USD/JPY Recovers Above 145.00
USD/JPY is rising and might gain pace above the 145.50 resistance.
Important Takeaways for USD/JPY Analysis Today
- USD/JPY climbed higher above the 144.00 and 145.00 levels.
- There is a key bullish trend line forming with support at 144.80 on the hourly chart at FXOpen.
USD/JPY Technical Analysis
On the hourly chart of USD/JPY at FXOpen, the pair started a fresh upward move from the 142.80 zone. The US Dollar gained bullish momentum above 143.40 against the Japanese Yen.
It even cleared the 50-hour simple moving average and 144.00. The pair climbed above 145.00 and traded as high as 145.43 before there was a downside correction. It is now moving lower toward the 23.6% Fib retracement level of the upward move from the 142.79 swing low to the 145.40 high.
The current price action above the 144.50 level is positive. There is also a key bullish trend line forming with support at 144.80. Immediate resistance on the USD/JPY chart is near 145.40.
The first major resistance is near 146.20. If there is a close above the 146.20 level and the RSI moves above 60, the pair could rise toward 147.50. The next major resistance is near 148.00, above which the pair could test 148.80 in the coming days.
On the downside, the first major support is 144.80 and the trend line. The next major support is visible near the 144.40 level. If there is a close below 144.40, the pair could decline steadily.
In the stated case, the pair might drop toward the 143.40 support zone and the 76.4% Fib retracement level of the upward move from the 142.79 swing low to the 145.40 high. The next stop for the bears may perhaps be near the 142.80 region.
This article represents the opinion of the Companies operating under the FXOpen brand only. It is not to be construed as an offer, solicitation, or recommendation with respect to products and services provided by the Companies operating under the FXOpen brand, nor is it to be considered financial advice.

The Day Ahead - Fed rate decision day 🇺🇸 US
Housing & Jobless Data: Signs of slowdown could boost rate cut bets and weaken the USD. Strong numbers may do the opposite.
TIC Flows: Shows foreign demand for US assets—important for long-term USD strength.
🇬🇧 UK
May Inflation (CPI): A hot reading could delay Bank of England rate cuts and strengthen the pound. A weak reading would do the opposite.
🇯🇵 Japan
Trade & Machinery Orders: Weak data could weaken the yen further.
🇳🇿 New Zealand
Q1 GDP: Poor growth could drag the NZD lower. A surprise beat might boost it.
🇸🇪 Sweden
Riksbank Rate Decision: No change expected, but any dovish hints may weaken the krona.
🇪🇺 Eurozone
ECB Speakers (Lane, Villeroy, etc.): Markets are watching for clues on whether more rate cuts are coming. Dovish talk could push the euro lower.
Trading Themes Today:
Watch UK inflation for big GBP moves.
US data could shift Fed expectations and USD direction.
NZD and JPY sensitive to economic data.
EUR direction depends on ECB tone.
This communication is for informational purposes only and should not be viewed as any form of recommendation as to a particular course of action or as investment advice. It is not intended as an offer or solicitation for the purchase or sale of any financial instrument or as an official confirmation of any transaction. Opinions, estimates and assumptions expressed herein are made as of the date of this communication and are subject to change without notice. This communication has been prepared based upon information, including market prices, data and other information, believed to be reliable; however, Trade Nation does not warrant its completeness or accuracy. All market prices and market data contained in or attached to this communication are indicative and subject to change without notice.