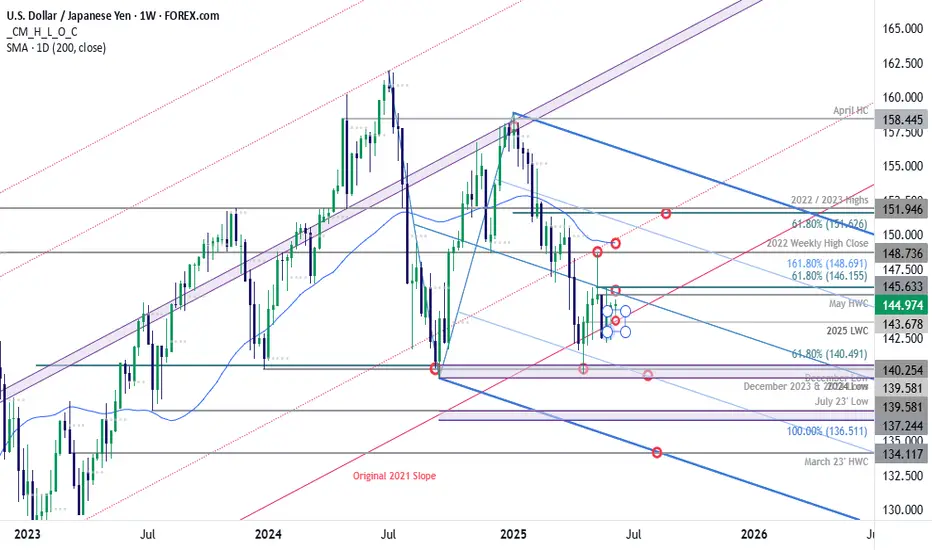
USD/JPY Battle Lines Drawn at Key Support- CPI on TapUSD/JPY plunged 4.4% into the close of May- The bears have been unable to break the 2021 original slope line, and the immediate focus is on a breakout of near-term range above support.
Initial weekly resistance is now eyed with the May high-week close (HWC) / 61.8% retracement of the May decline at 145.63-146.15- a breach / weekly close above this level would be needed to suggest a larger rebound is underway. Subsequent resistance objectives eyed at the December low / May high at 148.65 and the 52-week moving average (currently ~150.08). Ultimately a weekly close above the 61.8% retracement of the yearly range / 2022 & 2023 highs at 151.62/95 would be needed o threaten resumption of the broader multi-year uptrend in USD/JPY.
Weekly support rests with the yearly low-week close (LWC) at 143.68 with a close below the 2021 slope needed to fuel another run at key support (multi-year bullish invalidation) at the yearly lows near 139.58-140.49- a region defined by the December 2023 & 2024 lows and the 61.8% retracement of the 2023 advance. Look for a larger reaction there IF reached. Subsequent support objective seen at the 100% extension of the 2024 decline / July 2023 swing low around 136.51-137.24.
Bottom line: USD/JPY is trading just above multi-year uptrend support with a tight-range in view early in the month. From a trading standpoint, the immediate focus is on a breakout of the 143.68-146.15 range for guidance here with the yearly downtrend vulnerable while above the 2021 trendline. Look for the breakout in the days ahead.
-MB
JPYUSD trade ideas
USDJPY higher bullish for exepct
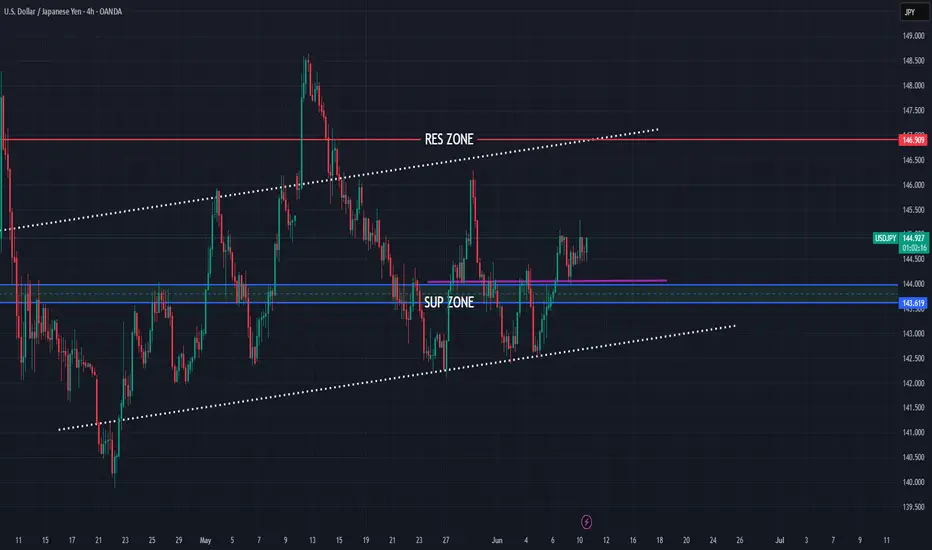
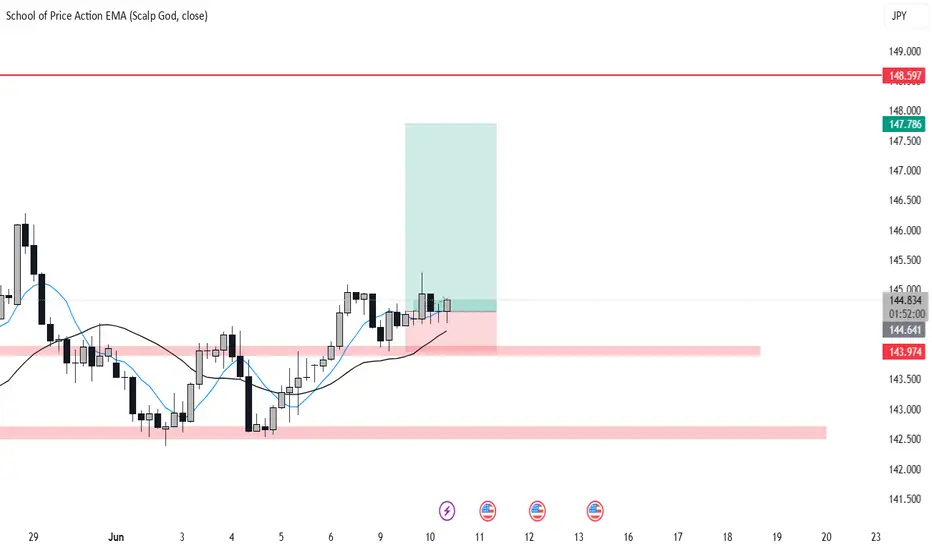
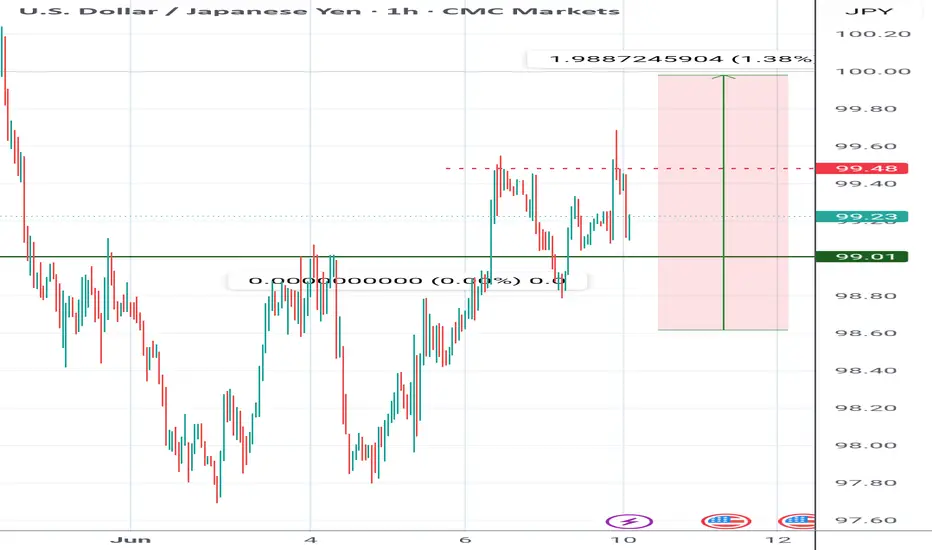
FX:USDJPY PA based analysis, price is bounce few times on bottom line of PA, last we have bullish push with short revers till zone 144.000, which taking here for sup zone from which expecting higher bullish continuation.
Technicalls are here same strong bullish for expect
SUP zone: 144.000
RES zone: 146.900
Investors Await Tariff Negotiation News with Bated BreathThe USD/JPY has lacked a clear direction for the second consecutive day, with a doji pattern on the daily chart highlighting investor indecision. As Sino-US representatives are currently negotiating a trade agreement, the market is temporarily reluctant to bet on a directional move. So long as prices remain within the Kumo cloud, a sideways trend is expected in the short term, as Monday's strong rebound from intraday lows and today's failed upside attempt both support this scenario. A clear break of either boundary of the daily Kumo cloud would unleash a more definitive directional signal. Although optimism over Sino-US trade talks is supporting the US dollar, the current momentum is insufficient to drive a stronger rally.
Humans need to breathe, and perfect trading is like breathing—maintaining flexibility without needing to trade every market swing. The secret to profitable trading lies in implementing simple rules: repeating simple tasks consistently and enforcing them strictly over the long term.
Storm Ahead? Key Level Breakout or Dangerous Reversal!USD/JPY: Storm Ahead? Key Level Breakout or Dangerous Reversal!
Overview:
The USD/JPY pair stands at a crucial crossroads, with technical signals indicating the potential for significant volatility in the near term. Will the Yen regain its footing, or will pressure from the USD continue to push the pair to new highs? This analysis delves into technical, fundamental, and macroeconomic factors to outline potential scenarios and identify key trading zones.
Detailed Technical Analysis:
Primary Trend: The USD/JPY chart clearly shows a short-term uptrend, supported by an ascending trendline (dashed line on the chart) and upward-sloping moving averages (MA). Trend analysis is considered the most important area of technical analysis, and is key to determining the general direction of a security. However, the price is approaching strong resistance zones, suggesting potential selling pressure. Technical analysis is a trading tool used to evaluate stocks and attempt to predict their future movements by analyzing statistical data obtained from trading activity.
Key Price Levels:
Crucial Resistance Zone (SELL Zone): Around 144.894 - 145.178. This is a significant Fibonacci Extension zone (1.13 and 1.236), where the price has reacted in the past and could attract strong selling pressure. If the price breaks and holds above this zone, the uptrend will be confirmed.
Crucial Support Zone (BUY Zone): Around 143.600 - 143.750. This support zone is formed by previous lows and the ascending trendline. If the price corrects to this zone and shows reversal signals, it could be a good buying opportunity. The next support zone is around 142.800. The goal of technical analysis is to determine the buy and sell points of a stock.
Technical Indicators: The MAs (blue, orange, red) maintain a relatively consistent distance and are sloping upwards, supporting the uptrend. However, the convergence of MAs near resistance zones could signal a weakening of upward momentum.
Price Patterns: Currently, the price is forming a pattern similar to a bull flag or an ascending triangle, suggesting a potential continuation of the uptrend if it breaks upwards. Conversely, if the price fails to overcome resistance and breaks the uptrend line, a bearish reversal pattern could form. Wave analysis is a technique based on the observation that markets move in specific patterns called waves.
Relevant Fundamental and Economic Factors:
Macroeconomic Analysis (Japan): The Bank of Japan (BOJ) continues to maintain ultra-loose monetary policy, with negative interest rates and yield curve control. This exerts continuous downward pressure on the Yen. Any signal of change from the BOJ regarding policy will have a significant impact on USD/JPY.
Macroeconomic Analysis (United States): The U.S. Federal Reserve (FED) is still in an aggressive monetary tightening cycle to combat inflation. Inflation reports (CPI, PPI), employment data (NFP), and statements from FED officials will be key drivers for the USD. If U.S. inflation remains high, the FED may continue to raise interest rates, pushing USD/JPY higher. Fundamental analysis focuses on evaluating economic, political, and social factors affecting the value of a currency pair.
Upcoming Economic Events: Closely monitor inflation reports from both the U.S. and Japan, GDP data, unemployment rates, and policy meetings of the BOJ and FED. These events will act as catalysts for sharp movements.
Conclusion and Trading Recommendations:
USD/JPY is in an uptrend but approaching crucial resistance zones.
BUY
Entry: When the price breaks and closes above 145.178, confirming the uptrend continuation. Or when the price corrects to the 143.600 - 143.750 zone and shows bullish reversal candles (e.g., bullish engulfing, hammer).
Take Profit: Higher Fibonacci levels (e.g., 1.382 at 145.491 or 1.5 at 145.918).
Stop Loss: Below the nearest support zone, e.g., below 143.500 if buying at support, or below 144.800 if buying after a resistance breakout.
SELL Scenario:
Entry: When the price approaches the 144.894 - 145.178 zone and strong bearish reversal signals appear (e.g., Gravestone Doji, bearish engulfing, double top pattern).
Take Profit: Lower support levels, e.g., 143.700, 142.800.
Stop Loss: Above the resistance zone, e.g., above 145.300.
Risk Disclaimer: Financial markets always involve high risks. Always manage your capital carefully and never trade with money you cannot afford to lose. This analysis is for informational purposes only and not investment advice.

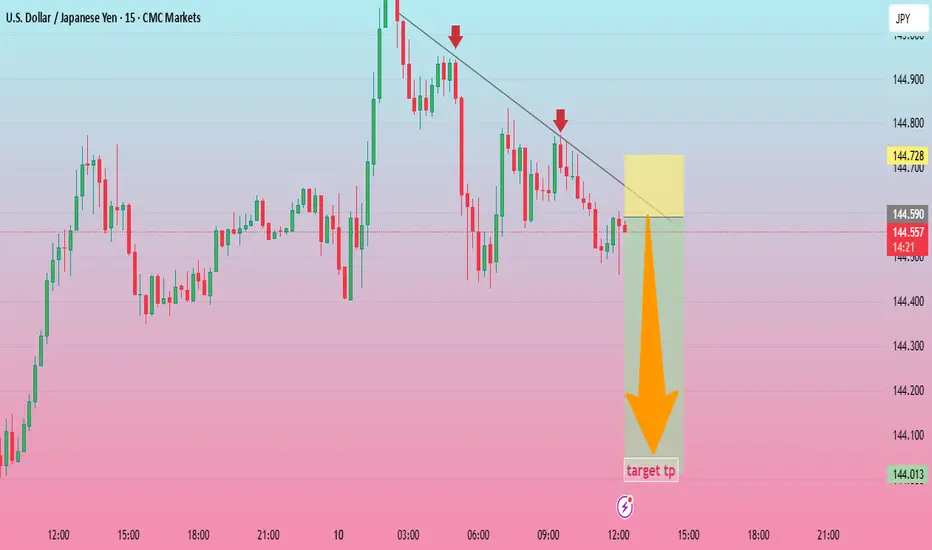
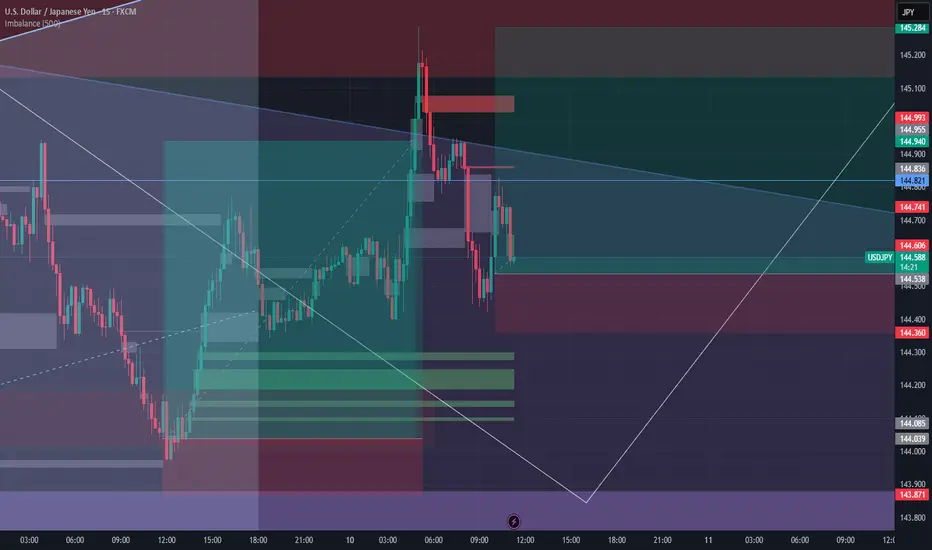
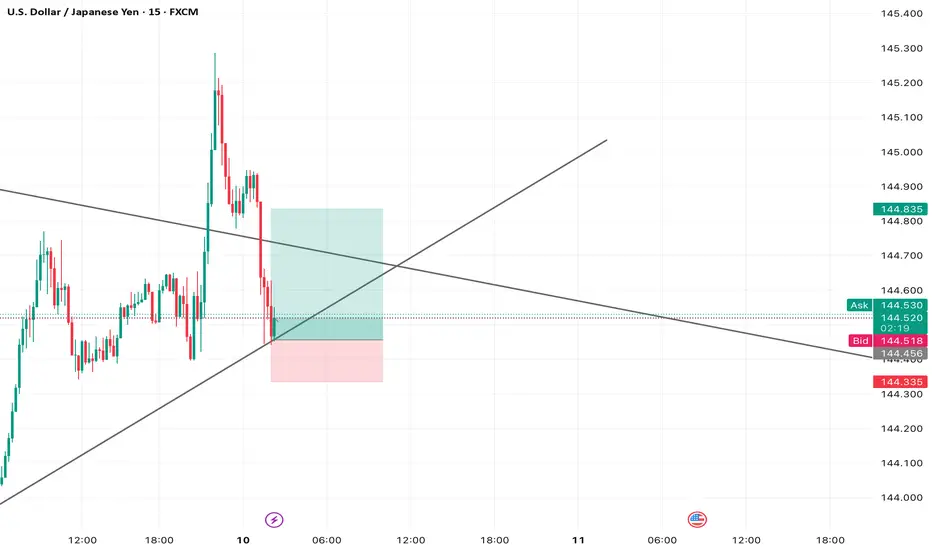
USDJPY 15MIt seems you've uploaded a chart image. This is a TradingView chart showing the U.S. Dollar/Japanese Yen (USD/JPY) pair on a 15-minute timeframe. The chart includes a potential sell setup based on a descending trendline and shows a target price zone with a directional arrow indicating a potential price drop.
Would you like to discuss this chart in more detail, or do you have specific questions about it?
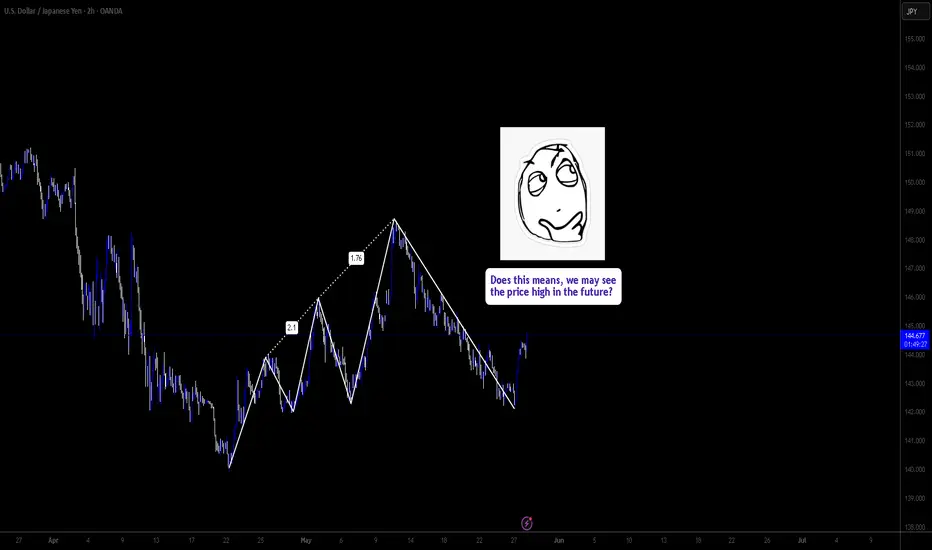
USDJPY - MR.GRINGO ThinkingsHello everybody.
Today, we have some discussion about this pair but only with using Technical ways.
The pair right now is very long, maybe 80 days' time period in trouble situation. I mean, the bears have the market of it...
As we see, this 80 day was so strong bearish range, but it's great try for bulls now!
We may have a hope, the price will go up with this next side of the acceding triangular figures.
We may open long position on the price 143.603 or Just make entry for long now.
If you will follow this trading idea, there we will have "the main" resistance levels.
They are...
1. 145.735
2. 146.892
3. 148.048 yes. so I recommend this price levels, because the market will check it maybe later... For sure if you think buy.
Have a profit maker day! :) ^)
USDJPY: Strong Intraday Bullish Price Action 🇺🇸🇯🇵
On the today's live stream, we discussed a very bullish setup
on USDJPY.
The price retested a recently broken horizontal resistance.
A resistance line of a falling wedge pattern was violated with
a strong bullish movement then.
We see its retest at the moment.
I think that the price will resume growth soon and reach 145.25 level.
❤️Please, support my work with like, thank you!❤️
I am part of Trade Nation's Influencer program and receive a monthly fee for using their TradingView charts in my analysis.

#USDJPY: +2000 PIPS Big Swing Move! Do not miss outThe cryptocurrency’s price is currently experiencing bearish pressure, and the current trading price is pivotal for determining its future trajectory. A smooth downtrend is anticipated, potentially propelling the price to 124 in the long term. The US dollar is likely to remain bearish, potentially reaching 95 in the US currency index. Three potential target sets are envisaged, and further updates will be provided based on price developments.
Best of luck and ensure safe trading practices.
Team Setupsfx_
USDJPY BREAKDOWNUSDJPY has a potential fail of H4 structure and probably building volume for an M style structure. Now I'm looking for H1 2 touch with 15M IE LONG. Unless it respect the 123 on h1 and give a short term sell/ go further down invalidating a potential pre M style long.

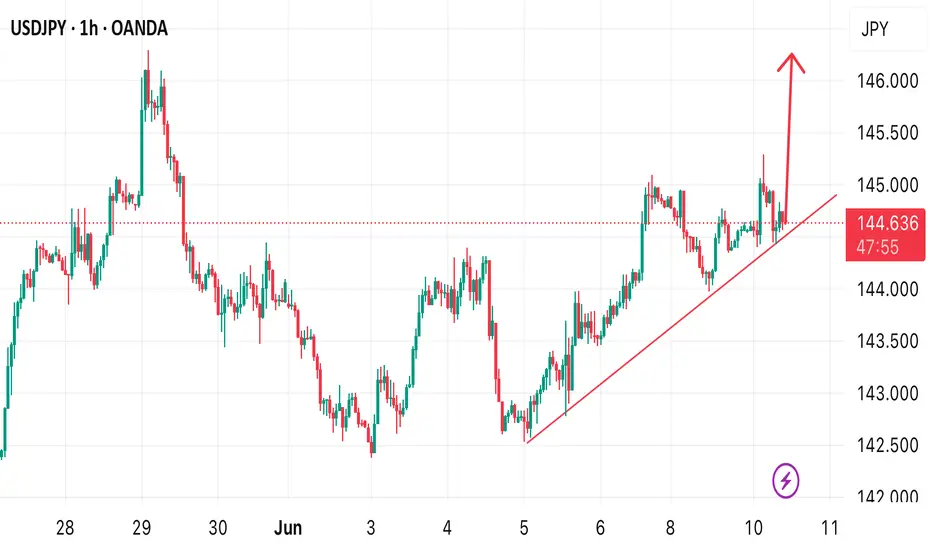
USDJPY BUY OPPORTUNITY Price is trending bullish on the H1 timeframe. We can clearly tell that price is moving and respecting the trendline. I anticipate bullish price action to develop away from the current price. Target profit level is at 146.000
Take advantage of this opportunity
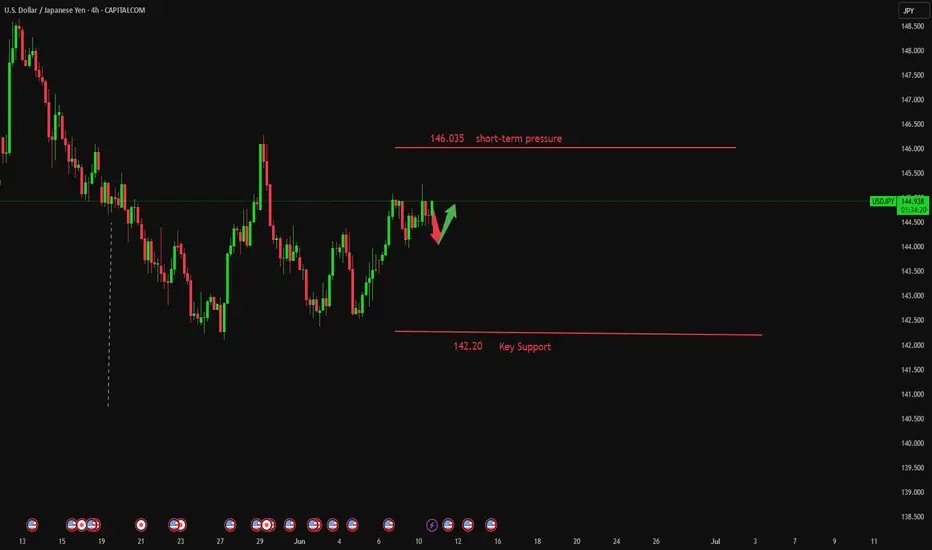
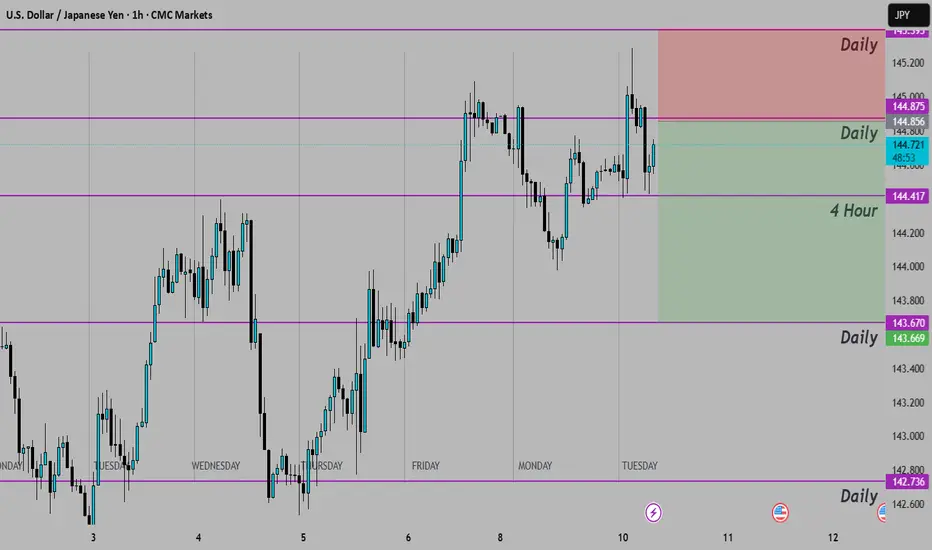
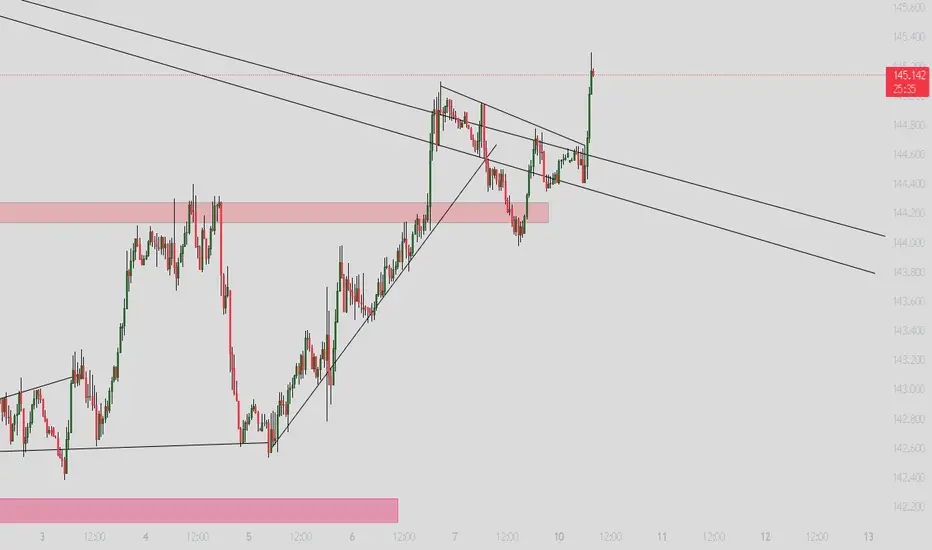
Usd/Jpy intra-day Analysis 10-Jun-25Sharing the possible scenarios we could have on Usd/Jpy.
Keeping in mind that the Volume is still slow since start of the week, and investors are waiting for the next set of important economic data which is starting tomorrow with the US CPI (inflation number).
Disclaimer: easyMarkets Account on TradingView allows you to combine easyMarkets industry leading conditions, regulated trading and tight fixed spreads with TradingView's powerful social network for traders, advanced charting and analytics. Access no slippage on limit orders, tight fixed spreads, negative balance protection, no hidden fees or commission, and seamless integration.
Any opinions, news, research, analyses, prices, other information, or links to third-party sites contained on this website are provided on an "as-is" basis, are intended only to be informative, is not an advice nor a recommendation, nor research, or a record of our trading prices, or an offer of, or solicitation for a transaction in any financial instrument and thus should not be treated as such. The information provided does not involve any specific investment objectives, financial situation and needs of any specific person who may receive it. Please be aware, that past performance is not a reliable indicator of future performance and/or results. Past Performance or Forward-looking scenarios based upon the reasonable beliefs of the third-party provider are not a guarantee of future performance. Actual results may differ materially from those anticipated in forward-looking or past performance statements. easyMarkets makes no representation or warranty and assumes no liability as to the accuracy or completeness of the information provided, nor any loss arising from any investment based on a recommendation, forecast or any information supplied by any third-par ty.

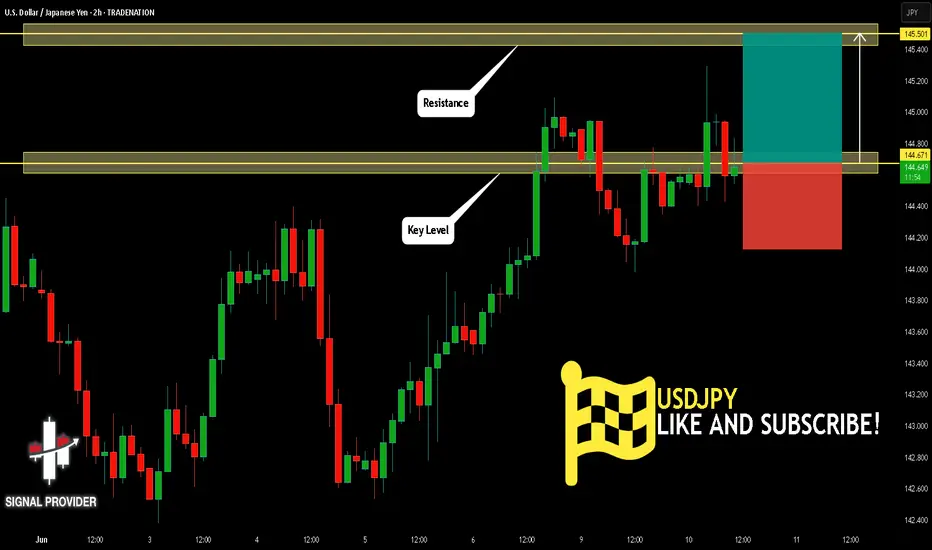
USDJPY Is Going Up! Long!
Here is our detailed technical review for USDJPY.
Time Frame: 2h
Current Trend: Bullish
Sentiment: Oversold (based on 7-period RSI)
Forecast: Bullish
The market is approaching a significant support area 144.671.
The underlined horizontal cluster clearly indicates a highly probable bullish movement with target 145.501 level.
P.S
The term oversold refers to a condition where an asset has traded lower in price and has the potential for a price bounce.
Overbought refers to market scenarios where the instrument is traded considerably higher than its fair value. Overvaluation is caused by market sentiments when there is positive news.
Disclosure: I am part of Trade Nation's Influencer program and receive a monthly fee for using their TradingView charts in my analysis.
Like and subscribe and comment my ideas if you enjoy them!
Loong 1Hwe be are bullish in major structure this was a corretion mmove confirmed criterial for long demand tap on the 5min sniper entry
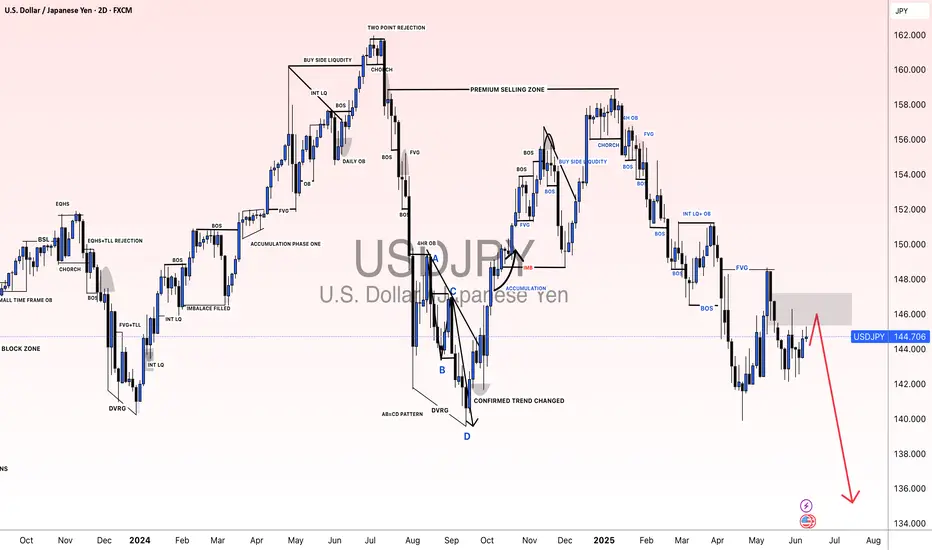
USDJPY Analysis: MMC Resistance vs Major BOS (Technical View)🔍 Chart Summary:
The USDJPY pair is currently trading around 144.58, showing strong signs of structural buildup as it approaches a critical inflection point. This analysis leverages MMC (Market Mapping Concept) and price action structure to identify two possible directional outcomes — each grounded in key technical levels.
🧠 Key Technical Highlights:
📌 1. Expanding Wedge Pattern:
Price previously formed an expanding structure, signaling volatility and accumulation.
Expansion typically precedes major directional breakouts — either trend continuation or reversal.
📌 2. Downtrend Break Test:
A long-standing descending trendline has now been tested multiple times.
A confirmed breakout would be significant, indicating a major shift in market momentum.
📌 3. Resistance Zones:
Minor Resistance Zone around 158.00–160.00 marks a key supply area.
Watch for price action behavior if this level is tested — possible rejection or breakout continuation.
📌 4. Major Support Zone:
Support near 139.00–140.00, where price previously bounced, represents a solid floor and demand zone.
📌 5. BOS (Break of Structure):
Two BOS levels are marked:
Minor BOS (Around 146.00): Immediate reaction level to watch.
Major BOS (Around 149.00–150.00): If broken, could lead to sharp bullish continuation.
🔮 MMC Forecast Scenarios:
✅ Condition 1: Bullish Breakout Scenario
Price breaks above the descending trendline and clears the Minor BOS.
Target zone: 158.00–160.00 resistance.
Structure confirms bullish dominance if Major BOS is cleanly broken and retested.
⚠️ Condition 2: Bearish Rejection Scenario
Price rejects from current trendline or Minor BOS and reverses.
Potential drop toward Major Support around 140.00.
Watch for reversal confirmation with bearish engulfing candles or re-entry into expanding zone.
🧭 MMC Outlook Summary:
The chart is setting up for a key decision point. The market will either validate a bullish breakout structure or revert back into bearish continuation. These scenarios align with the MMC mapping method, providing clear conditions for traders to follow without bias.

Price action This usdjpy might be a bit tricky since the liquidity below and a break of structure with the order block but it's bound to push up either way
USDJPY Long then Short: inverse H&SThis is a follow-up to the USDJPY idea that I posted yesterday. I am seeing an inverse H&S setup that is broken as the video is being recorded.

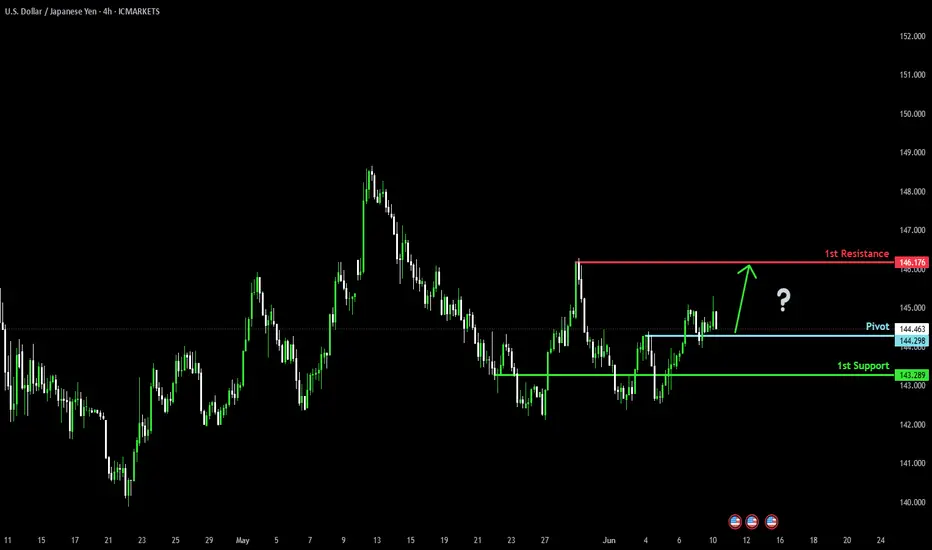
Potential bullish rise?USD/JPY has bounced off the pivot and could rise to the 1st resistance, which acts as a pullback resistance.
Pivot: 144.29
1st Support: 143.28
1st Resistance: 146.17
Risk Warning:
Trading Forex and CFDs carries a high level of risk to your capital and you should only trade with money you can afford to lose. Trading Forex and CFDs may not be suitable for all investors, so please ensure that you fully understand the risks involved and seek independent advice if necessary.
Disclaimer:
The above opinions given constitute general market commentary, and do not constitute the opinion or advice of IC Markets or any form of personal or investment advice.
Any opinions, news, research, analyses, prices, other information, or links to third-party sites contained on this website are provided on an "as-is" basis, are intended only to be informative, is not an advice nor a recommendation, nor research, or a record of our trading prices, or an offer of, or solicitation for a transaction in any financial instrument and thus should not be treated as such. The information provided does not involve any specific investment objectives, financial situation and needs of any specific person who may receive it. Please be aware, that past performance is not a reliable indicator of future performance and/or results. Past Performance or Forward-looking scenarios based upon the reasonable beliefs of the third-party provider are not a guarantee of future performance. Actual results may differ materially from those anticipated in forward-looking or past performance statements. IC Markets makes no representation or warranty and assumes no liability as to the accuracy or completeness of the information provided, nor any loss arising from any investment based on a recommendation, forecast or any information supplied by any third-party.
Complete Market Structure: Order Flow and Multiple TimeframesUnderstanding Market Structure: A Simplified Breakdown
Market structure can seem complex at first glance. But when you break it down piece by piece, it becomes much simpler to understand. At its core, price action is a visual representation of human emotion and logistic balance. It’s both calculated and unpredictable. To truly grasp price action, we must begin by understanding the foundations of the market.
1. Sentiment
In the beginning, there was just a single bar — whether on the 1-minute, 1-hour, 1-day, or 1-week chart. That one bar only had one defining trait: direction. At this early point, there was no trend, no supply or demand zones — only bullish or bearish sentiment. Over time, as more bars formed, sentiment shifted. What was once bullish became bearish, or vice versa. This shift gave rise to a new phenomenon: engulfment .
2. Engulfment
An engulfment occurs when one candle overtakes the previous one, signifying a strong shift in sentiment. When this happened for the first time, it created what we now call an order block around the engulfed candle. The engulfment generated a gap, which led to an imbalance in the market. Naturally, price tends to return to fill this gap to regain balance. Often, price will later engulf back in the original direction, continuing the cycle.
3. Order Flow / Sequence
As more bars appeared, patterns began to form. Series of bullish bars created bullish order flow, and bearish sequences formed bearish order flow. These sequences, when viewed on higher timeframes, appeared as single candles. As these larger candles began to engulf each other, it triggered a new surface-level event: bullish sequences began overtaking bearish ones, and vice versa. This is what I call internal shifting .
4. Internal Shifting
Through internal shifting — where sequences start overtaking each other — the chart begins to display more defined highs and lows. These fluctuations deepen as order flow keeps switching back and forth. Eventually, the structure is no longer just internal. Highs and lows start breaking, and broader, more visible structures form.
5. Highs, Lows, and Breaks of Structure (BoS)
As this cycle continues, the external structure of a timeframe emerges. Highs get higher, then lower, and this alternation continues. The result is a zigzag pattern — the hallmark of market structure. But this structure is not random. It’s the collective output of sentiment shifts, engulfments, sequences, internal shifts, and breaks of structure, all working together to create the full picture.
6. Multi-Timeframe Principles
In simple terms, the external structure of a smaller timeframe is just a more detailed (fractal) version of its higher timeframe. Likewise, the internal structure of a given timeframe is the external structure of its lower timeframe. This creates multiple perspectives of the same phenomena, depending on scale.
7. Same Concepts, Different Scales
What’s called an order block on a higher timeframe may be known as a supply or demand zone on a lower timeframe. An engulfment on a higher timeframe can appear as a sequential engulfment on a lower one. An internal shift on a lower timeframe might just be a pullback when viewed from above. If you go two timeframes apart — say, from low to medium to high — you’ll notice even more complexity. For instance, a higher timeframe order block becomes a premium/discount zone in the lowest of those three timeframes.
8. Low, Medium, and High Timeframes: The Complete Picture
By analyzing the market using three timeframes in unison, you can establish a complete view of market structure. When you truly understand this approach, trading becomes more strategic. Your setups gain better risk-to-reward ratios, and consistent profitability becomes more achievable.
Market structure is both logically and emotionally driven — simple, yet intricate. And while we’ve covered the logical side, the emotional side lies in trading psychology — a topic I’ll be exploring in detail next.
Want to apply this concept using indicators?
I've developed custom indicators that reflect the principles explained above. If you'd like to see how this theory works in practice, check out my TradingView page : The_Forex_Steward , where you can access these tools.
pattern breakoutThe pattern got broken, so look for the correction, then if any bullish candlestick comes can aim for the long position
USDJPY InsightHello to all our subscribers!
Please feel free to share your personal thoughts in the comments. Don’t forget to hit the boost button and subscribe!
Key Points
- The Bank of Japan has decided to maintain its policy of reducing government bond purchases beyond April next year. It is expected to officially announce the extension of its bond-buying plan during the Monetary Policy Meeting scheduled for June 16–17.
- The United States and China concluded the first day of trade talks in London. U.S. Treasury Secretary Scott Besant described the talks as “positive,” while Commerce Secretary Howard Lutnick said they were “productive.”
- According to the New York Federal Reserve, 1-year inflation expectations fell by 0.4% to 3.2% from the previous month. Expectations for 3-year and 5-year inflation also showed signs of easing, further fueling hopes of interest rate cuts.
Key Economic Events This Week
+ June 11: U.S. May Consumer Price Index (CPI)
+ June 12: U.K. April GDP, U.S. May Producer Price Index (PPI)
+ June 13: Germany May Consumer Price Index (CPI)
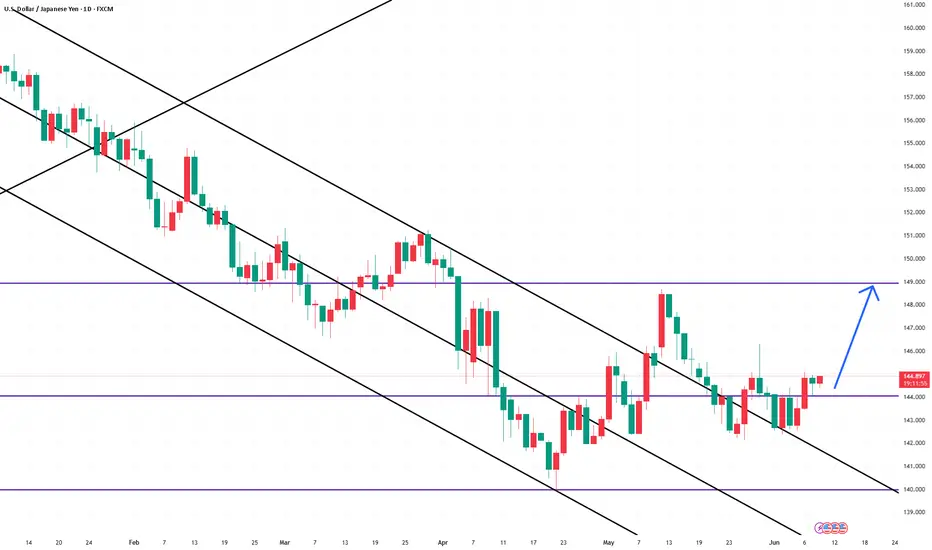
USDJPY Chart Analysis
The 142 level has consistently provided strong support, and the pair has since climbed to the upper range around 144. However, resistance near the 146 level remains, making it difficult to confirm a full bullish trend. While we may anticipate a potential rise toward the 149 level, we’ll be keeping a close watch on how the price behaves around 146.