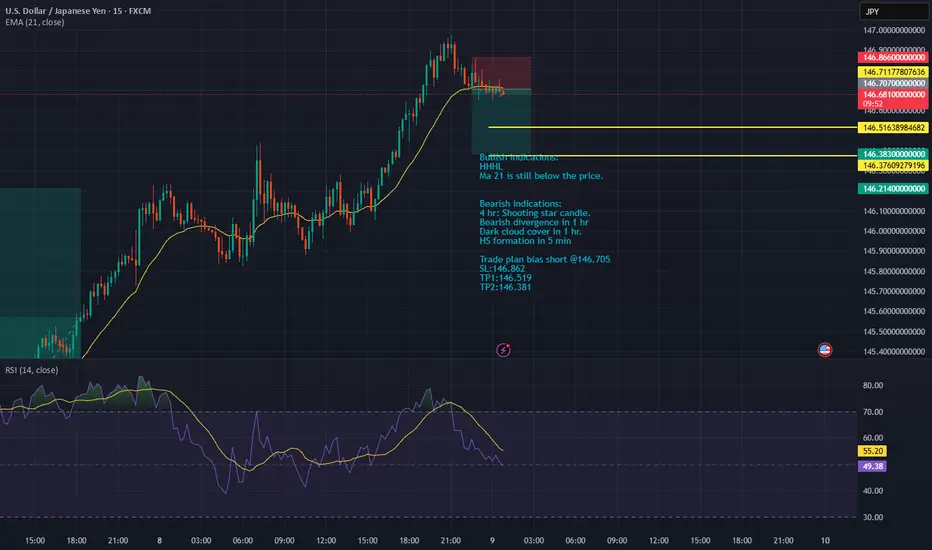
USDJPY-bias short Bullish indications:
HHHL
Ma 21 is still below the price.
Bearish indications:
4 hr: Shooting star candle.
Bearish divergence in 1 hr
Dark cloud cover in 1 hr.
HS formation in 5 min
Trade plan bias short @146.705
SL:146.862
TP1:146.519
TP2:146.381
JPYUSD trade ideas
Daily USDJPY analysisHi everyone hope this video helps on why i take my trades and how i find secure trades. Note nothing is 100% this is all highest probability. refer to the video for all details.
happy trading everyone

UJ LongsLooking for today's daily bullish candle to make new high into NY session
I drew the CTL for clarity of what I am looking for my entry.
Need a break close above 4hr resistance
usd jpy possible scenariousd jpy possible scenario seems like a pattern is emerging lets see hope you good luck

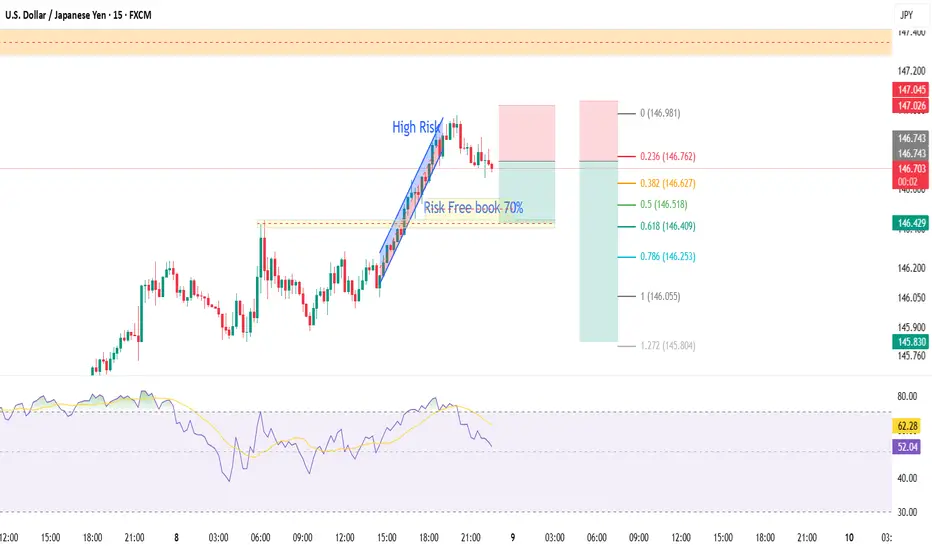
USDJPYUSDJPY Short
15 m
SL TP ENTRY mentioned in chart High risk trade make your trade risk free as per your risk
BUY If it activates, we are in control.* ✅ **Do not manually enter early** — let the price pull back naturally.
* 🧘♂️ Your job is only to **execute with discipline**, not predict.
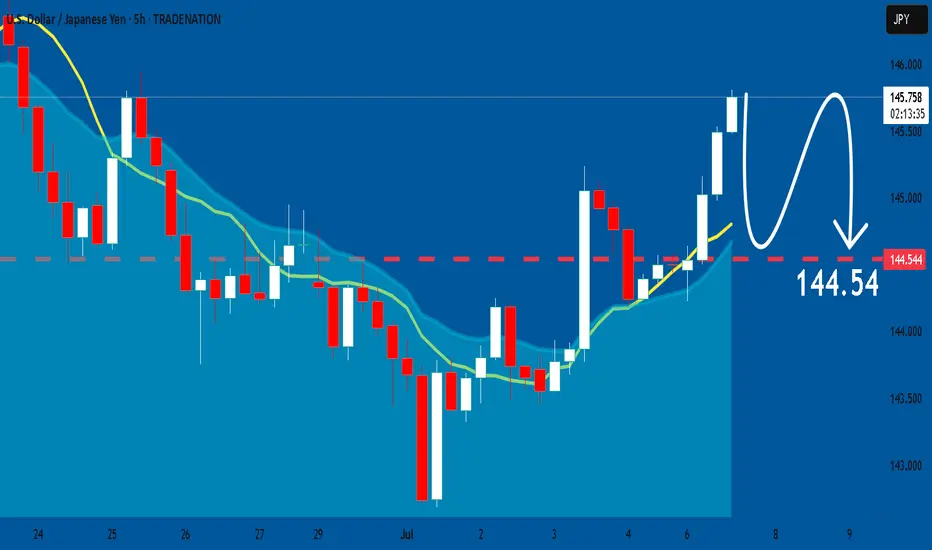
USDJPY: Bearish Continuation is Highly Probable! Here is Why:
Remember that we can not, and should not impose our will on the market but rather listen to its whims and make profit by following it. And thus shall be done today on the USDJPY pair which is likely to be pushed down by the bears so we will sell!
Disclosure: I am part of Trade Nation's Influencer program and receive a monthly fee for using their TradingView charts in my analysis.
❤️ Please, support our work with like & comment! ❤️
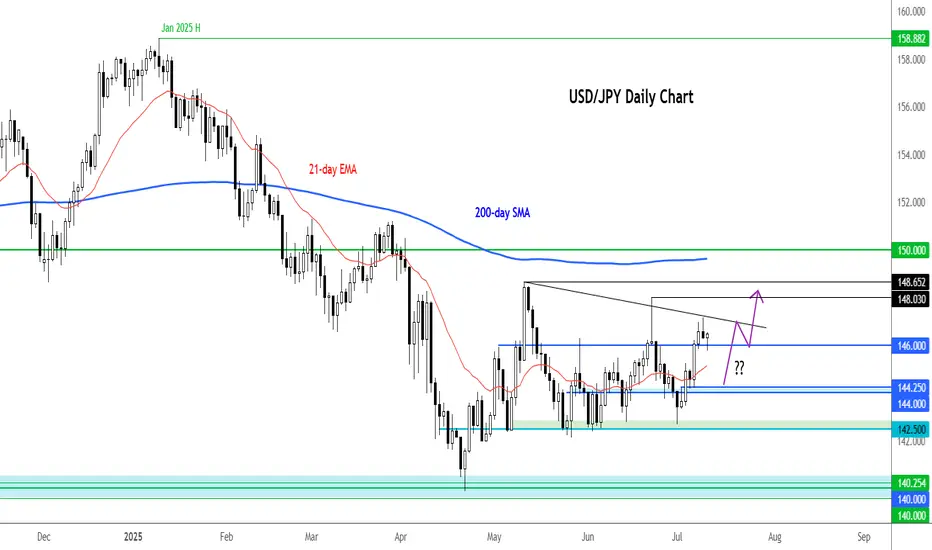
USD/JPY bears getting trapToday's main data release was the weekly jobless claims figures, which came out better than expected at 227K vs. 236K eyed, down from 232K the week before.
In response, the dollar extended its rebound, and the USD/JPY has turned positive on the day after yesterday's reversal.
In recent days the UJ has been pushing higher, thanks to a weakening JPY amid threats of tariffs from the US. But we have also seen some support for the dollar owing to expectations that the tariffs will prove inflationary and that could limit Fed rate cuts.
The UJ has been forming a few bullish price signals and now finds itself above the 21-day exponential average. Stops resting above those inverted hammer candles from yesterday and June 23 could be in trouble. Can we see price rally towards those liquidity pools?
Support at 146.00 held firm after a brief dip below it. Next support is around 145.00 then 144.25 and 144.00 thereafter.
By Fawad Razaqzada, market analyst with FOREX.com
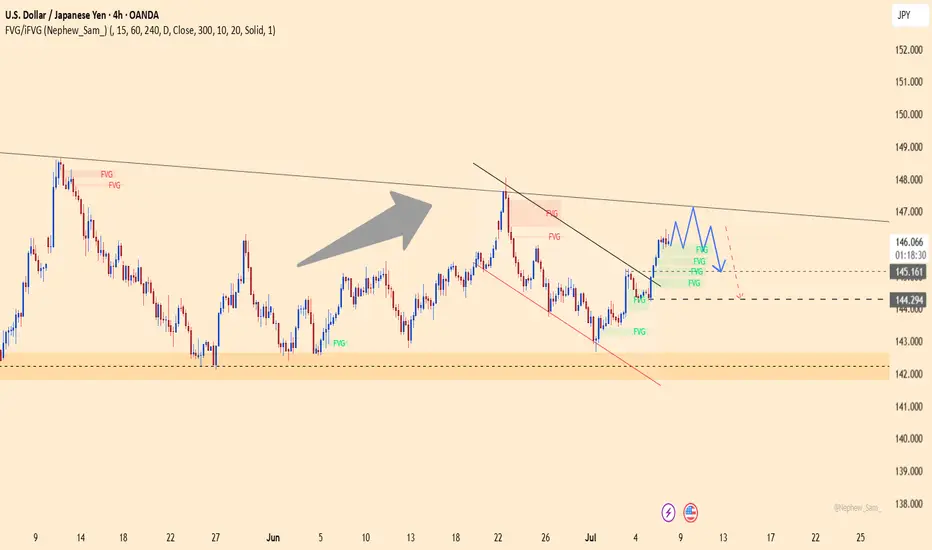
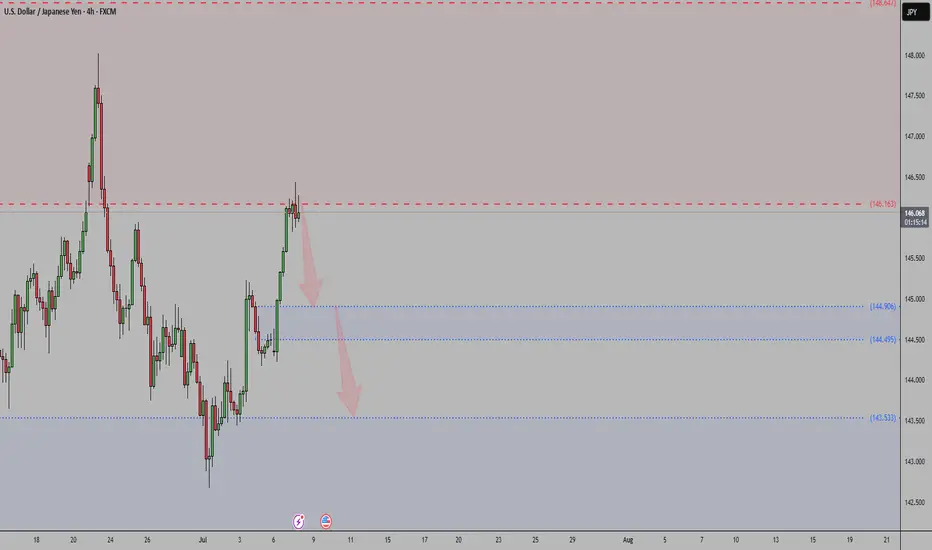
USDJPY – A Bull Trap in the Making?USDJPY has just broken above the descending trendline but stalled right at the confluence resistance near 147.100 – a former strong distribution zone. Although buyers have pushed the price higher, the current price structure is sketching a potential double top pattern, signaling a possible exhaustion of the bullish momentum.
If this pattern confirms and price breaks below the FVG support zone around 145.161, then 144.300 will likely be the next target – a level that previously halted price before the recent rally. Price action should be closely monitored here, as a breakdown below 145.161 could be an early reversal signal.
Disappointing Nonfarm data has pushed bond yields lower and weakened the USD, reinforcing expectations of an earlier Fed rate cut. If this week’s CPI also comes in lower than expected, USDJPY could sharply drop from the current top.
USDJPY ReversalUSDJPY started selling off nicely on Friday late trading session. Price has quickly regained bullish momentum but, we can expect a nasty reversal from this supply area towards 143,333
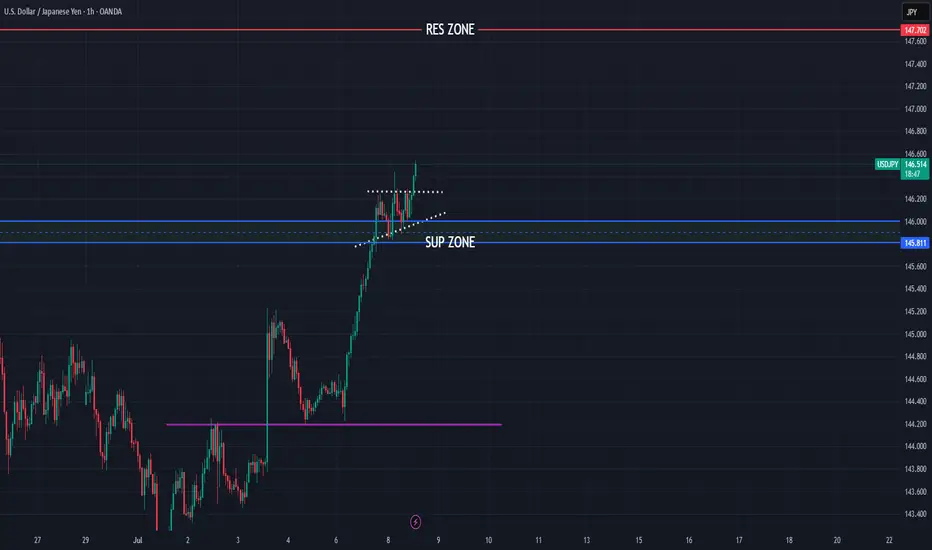
USDJPY still bullish to expect
FX:USDJPY strong bullish push, expectations are still bullish to see, currently we can see price is break ASCENDING TRIANGLE, JPY still looks the weakest, dont see changes, here still bull to expect.
SUP zone: 146.000
RES zone: 147.700
USDJPY 15M KEEP THE RIDE GOING BULL TIME :))Its good area to keep the ride going
Its very good R/R TRADE (AS USUAL)
USDJPYMarket Bias: Bearish USDJPY
Recent price action shows weakening bullish momentum on USDJPY, with sellers stepping in near resistance zones.
Key Drivers:
– Broad USD softness amid dovish Fed tone and easing inflation pressures
– JPY strength supported by rising BOJ tightening expectations or yield differentials narrowing
– Risk-off sentiment potentially boosting safe-haven demand for JPY
USDJPYUSDJPY ADVANCED OUTLOOK
US10Y=4.348% WEEKLY HIGH 4.436%
DXY=97.664$ weekly low 96.871
FED INTEREST RATE HELD STEADY LAST MEETING BY FOMC VOTE 4.25%-4.5%
Heads of the Federal Reserve (Fed) and Bank of Japan (BOJ)
Federal Reserve (Fed)
Chair: Jerome H. Powell
Term: Powell has served as Chair of the Board of Governors of the Federal Reserve System since February 5, 2018. He was reappointed for a second four-year term on May 23, 2022, which is set to run until May 2026.
Background: Powell is an American investment banker and lawyer, known for his consensus-building approach and steady leadership during periods of economic uncertainty. He has been a member of the Board of Governors since 2012.
Bank of Japan (BOJ)
Governor: Kazuo Ueda
Term: Kazuo Ueda has served as Governor of the Bank of Japan since April 2023. He is a distinguished academic with a PhD in economics from MIT and has guided the BOJ through its recent policy normalization and interest rate increases.
Key Executive: Koji Nakamura was appointed as the BOJ’s Executive Director overseeing monetary policy and financial markets in April 2025, supporting Governor Ueda in policy implementation.
BOJ ( BANK OF JAPAN) 10 year bond yield
JP10Y=1.491% HIGH FOR THE WEEK 1.515%
BOJ INTEREST RATE =0.5%
Interest Rate Differential:
US Federal Reserve rate: 4.25%–4.50%.- BOJ 0.5%=3.75%-4%
the interest rate differential favor USD LONG
Bank of Japan (BoJ) rate: 0.5% comes in higher giving yen a shot advantage ,on monthly TF USDJPY remains bearish.
10-Year Bond Yield Differential:
Us10y 4.35% -JP10Y 1.515%= 2.835%
The bond yield spread continues to favor the dollar, attracting capital to US assets.
Monetary Policy Outlook:
The BoJ remains cautious, signaling a slow pace of further tightening.
The Fed is expected to maintain higher rates in the near term, though some easing is anticipated later in 2025.
Technical and Fundamental Summary
Trend: USD/JPY remains in a bullish trend, we will have upside potential if US yields stay elevated and BoJ remains dovish.
the monthly TF remains bearish and its something to watch.
The USD/JPY pair is expected to remain supported above 145 as long as the interest rate and bond yield differentials favor the US.
Upside risks exist if US economic data outperforms or if the BoJ maintains its cautious stance.
Downside risks could emerge if the Fed signals faster rate cuts or if there is a significant shift in risk sentiment favoring the yen.
In summary:
USD/JPY is trading near 146.231, with the US dollar supported by higher interest rates and bond yields relative to Japan. The pair’s direction will remain sensitive to central bank policy signals and global risk sentiment in the coming weeks.
1. Uncovered Interest Rate Parity (UIP) –
Uncovered Interest Rate Parity (UIP) is a fundamental theory in international finance and foreign exchange markets. It states that the difference in interest rates between two countries should equal the expected change in their exchange rates over the same period. The concept assumes no arbitrage opportunities and that investors are risk-neutral.
Implication:
If one country has a higher interest rate, its currency is expected to depreciate by the same amount as the interest rate differential.
Carry Trade:
If UIP holds, there is no excess return from borrowing in a low-interest currency and investing in a high-interest one, as exchange rate movements offset the interest rate advantage.
Covered vs. Uncovered:
Covered Interest Rate Parity (CIP): Uses forward contracts to hedge exchange rate risk.
Uncovered Interest Rate Parity (UIP): No hedging; relies on expected spot rates.
Example:
If US rates are 4.5% and JPY rates are 0.5%, UIP predicts the US dollar will depreciate by 4% against the JAPANESE YEN over the period, making returns equal after accounting for currency changes.
Given the USD interest rate of 4.5% and the Bank of Japan (BOJ) interest rate of 0.5%, the Uncovered Interest Rate Parity (UIP) and Covered Interest Rate Parity (CIP) conditions is as follows:
1. Uncovered Interest Rate Parity (UIP)
UIP states that the expected change in the spot exchange rate between two currencies equals the interest rate differential between those countries. In other words, the currency with the higher interest rate is expected to depreciate relative to the currency with the lower interest rate by roughly the interest rate differential.
Interpretation:
Since the USD interest rate (4.5%) is higher than the BOJ rate (0.5%), UIP predicts that the USD will depreciate against the JPY by approximately the interest rate differential of 4.0% annually.
This means that although USD offers higher yields, investors expect the USD to weaken relative to JPY over the investment horizon, offsetting the higher interest return.
2. Covered Interest Rate Parity (CIP)
CIP states that the forward exchange rate should adjust to offset the interest rate differential, eliminating arbitrage opportunities by using forward contracts to hedge exchange rate risk.
With USD rates higher than JPY rates, the USD is expected to trade at a forward discount relative to JPY, meaning the forward USD/JPY rate will be lower than the spot rate to compensate for the higher USD interest rate.
This ensures no arbitrage profit from borrowing in JPY and investing in USD while hedging currency risk.
This implies the forward rate is about 151.82 USD/JPY, higher than the spot rate, indicating a forward premium on USD relative to JPY.
Note: This suggests USD is trading at a forward premium, which contradicts the earlier interpretation. This discrepancy arises because in USD/JPY quoting, USD is the base currency and JPY the quote currency. The direction of the interest rate differential effect depends on the quoting convention.
Important Clarification on Quoting Conventions:
USD/JPY is quoted as Japanese yen per 1 US dollar.
When the domestic currency is USD, and foreign currency is JPY, the formula applies as above.
Since USD interest rates are higher, the JPY is trading at a forward discount relative to USD, meaning the forward USD/JPY rate is higher than the spot rate (USD is expected to appreciate).
Summary:
Aspect Result / Interpretation
Interest Rate Differential USD 4.5% vs. JPY 0.5% → 4.0% differential
UIP Prediction USD expected to appreciate against JPY by ~4% (due to quoting)
CIP Forward Rate Forward USD/JPY rate > Spot rate (USD at forward premium)
Carry Trade Borrow in low-rate JPY, invest in high-rate USD to earn carry
Conclusion:
With USD interest rate at 4.5% and BOJ rate at 0.5%, the covered interest rate parity (CIP) implies the USD will trade at a forward premium against JPY, i.e., the forward USD/JPY rate will be higher than the spot rate by roughly the interest rate differential.
The uncovered interest rate parity (UIP) suggests that investors expect the USD to appreciate against JPY by about 4% over the investment horizon, compensating for the higher USD interest rate.
This supports typical carry trade strategies where investors borrow in low-yielding JPY and invest in high-yielding USD assets, profiting from the interest differential.
#usdjpy #dollar #yen #jpy

USDJPY (Update)Hi everyone hope the video helps nice continuation of the bulls looking for that untapped daily wick zone this week. hope everyone is having a great start to the week. I have a full house at the moment with family visiting so I will probably be limited with posting. any questions feel free to message me directly and i will try get to it as soon as i can.
Happy Trading!!!

Analysis on USD/JPY LONGHello! As we all know the Thursday NFP came in positive for USD thereby making usd to be in stronger position against the JPY. More analysis are stated below
US–Japan Interest Rate Divergence
Bank of Japan (BoJ) remains cautious post its January rate hike, with rates near 0.5% and monetary policy likely on hold through 2025
U.S. Federal Reserve (Fed) has postponed cuts amid robust job data and inflation above target; markets have pulled forward rate cut expectations to autumn rather than summer .
The interest-rate gap (USD >4%, JPY ~0.5%) favours a stronger dollar but carries a steep “carry cost” for yen investors .
Economic Outlooks & Trade Dynamics
Japan’s Q2 business sentiment (Tankan) is slightly positive, despite export weakness due to tariff risks
U.S.–Japan trade tensions are escalating, with looming tariffs on Japanese car imports potentially impacting growth and yen sentiment
reddit.com
Persistent Japanese inflation (~2.5% in Tokyo) and wage gains (~2.8%) bolster long-term BoJ tightening expectations
Summary: The dollar remains supported by stronger U.S. policy and treasury yields. Meanwhile, Japan’s cautious BoJ, inflation, and trade vulnerabilities push the yen—and thus USD/JPY—into a volatile bracket.

USDJPY – Can the Dollar Squeeze Last?In FX markets, the USDJPY currency pair has moved more than most this week. Initially trading higher, rocked by President Trump’s unveiling of the tariff letter sent to Japan on Tuesday in a social media show outlining new tariffs on Japanese imports of 25%, supported by rising US 10 year treasury yields (+10 bps on week), which often can influence USDJPY prices, and a general squeeze on weak short US dollar positions across all G7/10 currency pairs. This all helped USDJPY to move from Monday’s opening level around 144.40 up to a 3-week high of 147.18 on Wednesday.
Then it was all change as USDJPY ran into a wave of fresh selling as traders took advantage of the squeeze to reopen short positions at higher levels, especially with various Bank of Japan board members discussing the potential for the Japanese central bank to raise interest rates again at some stage later in the year, and then President Trump unveiling more aggressive tariffs on countries such as Brazil (50% tariff), which renewed trader concerns that the US economy may be more negatively impacted by his trade policies. This sent USDJPY to a low of 145.75 this morning before recovering to slightly higher levels (146.25 0700 BST).
Looking forward, trade deals and Trump tariff headlines/social media posts may continue to influence where USDJPY moves into the Friday close, as could the technical outlook ahead of a busy week for scheduled events started on Monday July 14th.
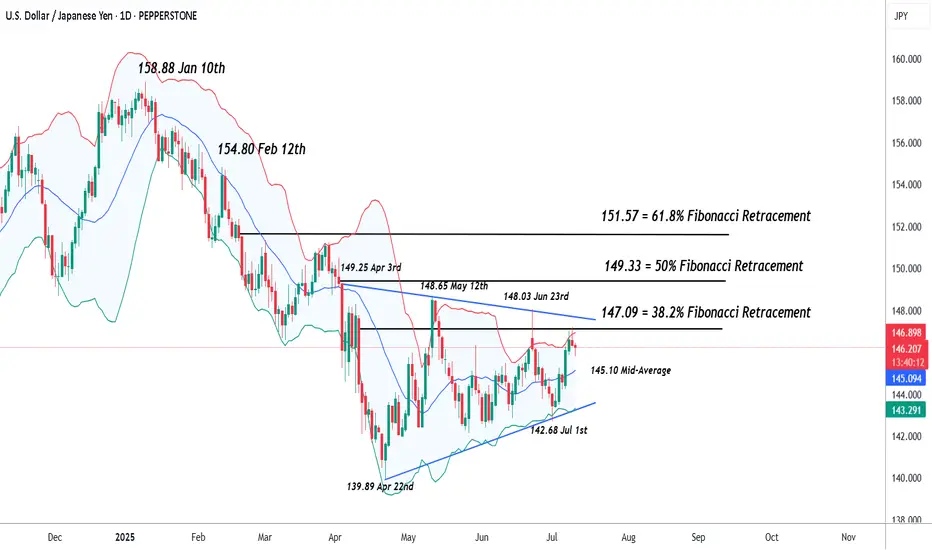
Technical Update: USDJPY Back to Important Resistance?
Since posting the 142.68 July 1st low, USDJPY has rallied strongly, seeing a more than 3% recovery in 6 sessions. This may mean some traders are looking for a more sustained price advance, but as the chart below shows, the latest price strength might only now be back to a resistance focus between the 147.09/147.64 levels.
These levels are equal to a combination of the 38.2% Fibonacci retracement of the January 10th to April 22nd decline at 147.09, and the downtrend that connects the highs seen on April 3rd, May 12th and June 23rd, which currently stands at 147.64. So far at least, this resistance area has capped the latest price strength.
Much will depend on future market sentiment and price trends, but it's possible closing breaks above the 147.09/64 resistance range may be required to suggest potential for a further phase of price strength towards 149.33, the higher 50%, even 151.57 the 61.8% retracements.
What if Resistance at 147.09/64 Continues to Hold?
Of course, the 147.09/64 resistance is currently holding price strength and could even prompt fresh weakness. As such, it could be suggested a more balanced sideways trading range is currently in place, with the latest price strength now back to the upper limit resistance at 147.09/64 .
If this is the case, it is possible price weakness might now emerge, with closing breaks under support at 145.10, the Bollinger mid-average, potentially suggesting further declines are possible towards 143.20, which is the uptrend connecting the recent lows, which also possibly marks the lower limits of the current sideways price range.
The material provided here has not been prepared accordance with legal requirements designed to promote the independence of investment research and as such is considered to be a marketing communication. Whilst it is not subject to any prohibition on dealing ahead of the dissemination of investment research, we will not seek to take any advantage before providing it to our clients.
Pepperstone doesn’t represent that the material provided here is accurate, current or complete, and therefore shouldn’t be relied upon as such. The information, whether from a third party or not, isn’t to be considered as a recommendation; or an offer to buy or sell; or the solicitation of an offer to buy or sell any security, financial product or instrument; or to participate in any particular trading strategy. It does not take into account readers’ financial situation or investment objectives. We advise any readers of this content to seek their own advice. Without the approval of Pepperstone, reproduction or redistribution of this information isn’t permitted.
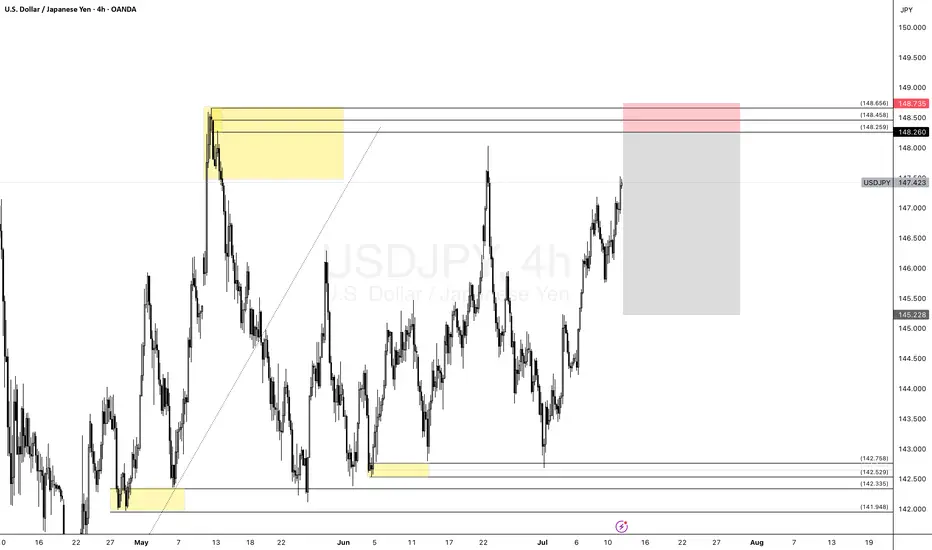
USDJPY – 4H Rally-Base-Drop in Daily SupplyUSDJPY – 4H Rally-Base-Drop in Daily Supply
Price has rallied into a high-quality 4H Rally-Base-Drop supply zone, which is nested cleanly inside a Daily supply zone—offering strong confluence for a short setup.
I'm anticipating a reaction from this institutional imbalance area, with price rejecting from the 148.260–148.735 zone. The target is down toward 145.228, creating a potential 1:3+ RRR.
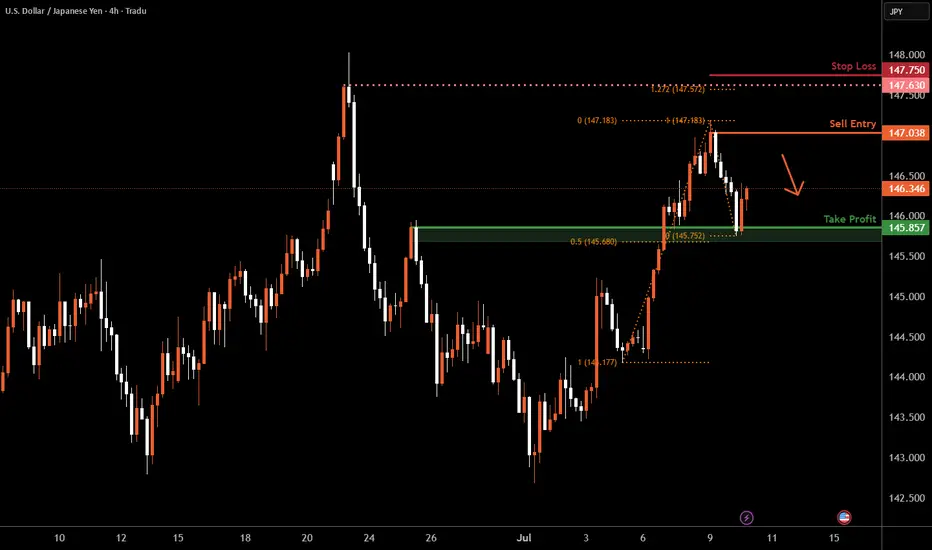
USD/JPY H4 | Approaching a swing-high resistanceUSD/JPY is rising towards a swing-high resistance and could potentially reverse off this level to drop lower.
Sell entry is at 147.03 which is a swing-high resistance.
Stop loss is at 147.75 which is a level that sits above the 127.2% Fibonacci extension and a swing-high resistance.
Take profit is at 145.85 which is an overlap support that aligns closely with the 50% Fibonacci retracement.
High Risk Investment Warning
Trading Forex/CFDs on margin carries a high level of risk and may not be suitable for all investors. Leverage can work against you.
Stratos Markets Limited (tradu.com ):
CFDs are complex instruments and come with a high risk of losing money rapidly due to leverage. 63% of retail investor accounts lose money when trading CFDs with this provider. You should consider whether you understand how CFDs work and whether you can afford to take the high risk of losing your money.
Stratos Europe Ltd (tradu.com ):
CFDs are complex instruments and come with a high risk of losing money rapidly due to leverage. 63% of retail investor accounts lose money when trading CFDs with this provider. You should consider whether you understand how CFDs work and whether you can afford to take the high risk of losing your money.
Stratos Global LLC (tradu.com ):
Losses can exceed deposits.
Please be advised that the information presented on TradingView is provided to Tradu (‘Company’, ‘we’) by a third-party provider (‘TFA Global Pte Ltd’). Please be reminded that you are solely responsible for the trading decisions on your account. There is a very high degree of risk involved in trading. Any information and/or content is intended entirely for research, educational and informational purposes only and does not constitute investment or consultation advice or investment strategy. The information is not tailored to the investment needs of any specific person and therefore does not involve a consideration of any of the investment objectives, financial situation or needs of any viewer that may receive it. Kindly also note that past performance is not a reliable indicator of future results. Actual results may differ materially from those anticipated in forward-looking or past performance statements. We assume no liability as to the accuracy or completeness of any of the information and/or content provided herein and the Company cannot be held responsible for any omission, mistake nor for any loss or damage including without limitation to any loss of profit which may arise from reliance on any information supplied by TFA Global Pte Ltd.
The speaker(s) is neither an employee, agent nor representative of Tradu and is therefore acting independently. The opinions given are their own, constitute general market commentary, and do not constitute the opinion or advice of Tradu or any form of personal or investment advice. Tradu neither endorses nor guarantees offerings of third-party speakers, nor is Tradu responsible for the content, veracity or opinions of third-party speakers, presenters or participants.
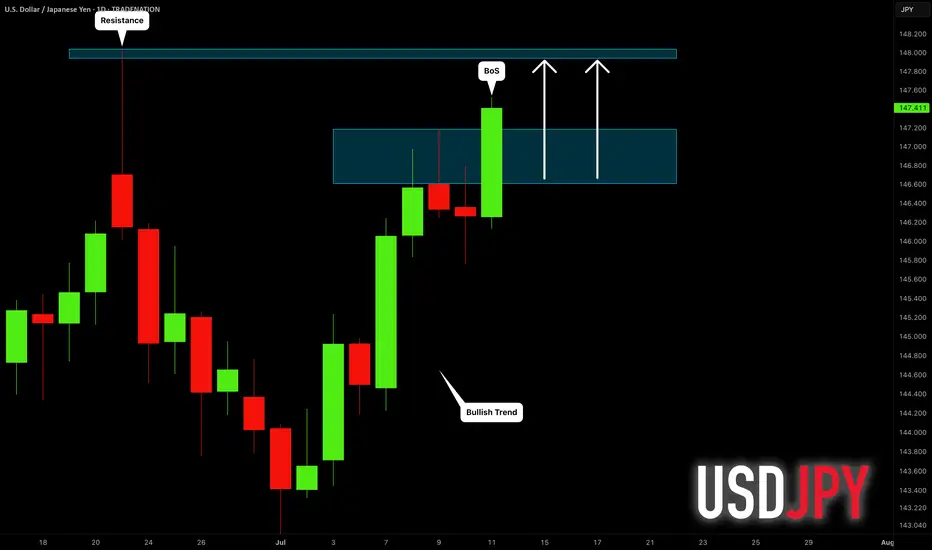
USDJPY: More Growth Ahead! 🇺🇸🇯🇵
USDJPY broke and closed above a minor daily resistance
with a confirmed BoS.
The next strong resistance is 148.0
It is going to be the next goal for bulls.
❤️Please, support my work with like, thank you!❤️
I am part of Trade Nation's Influencer program and receive a monthly fee for using their TradingView charts in my analysis.
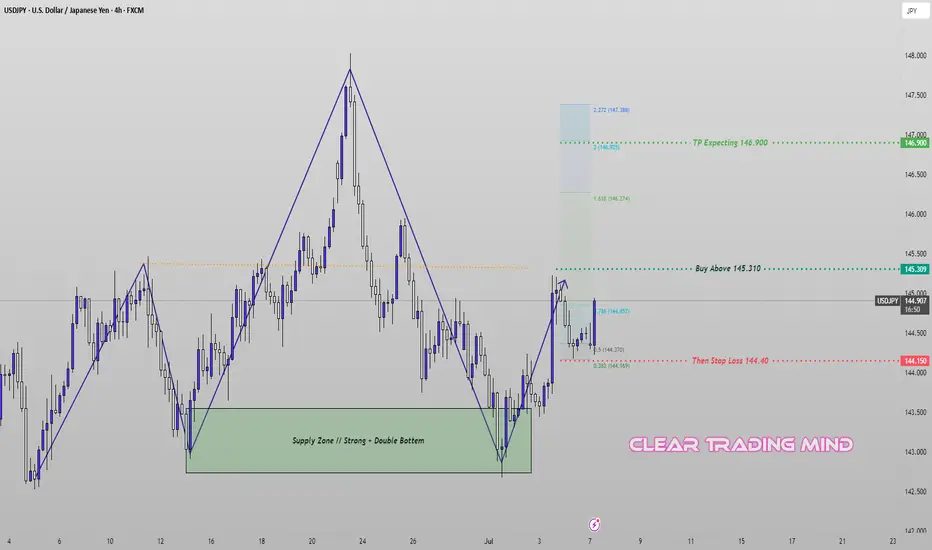
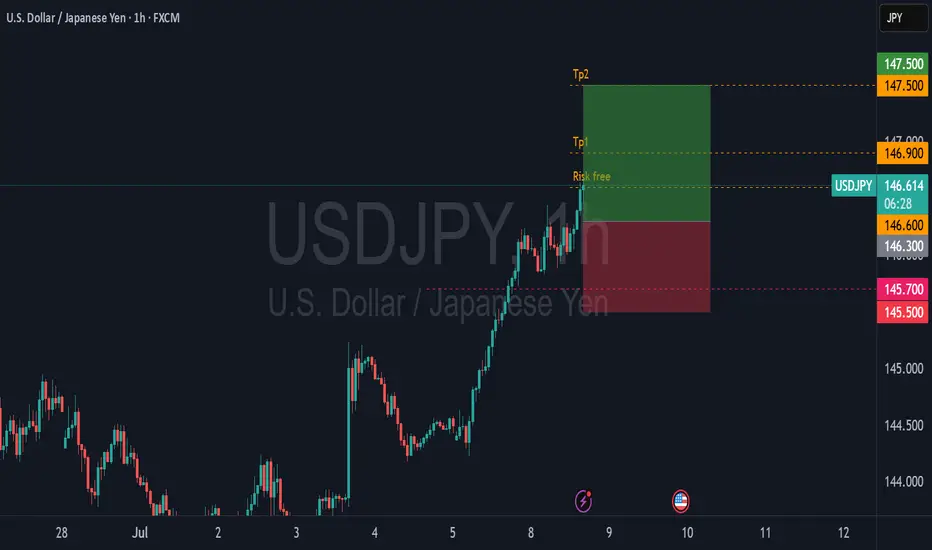
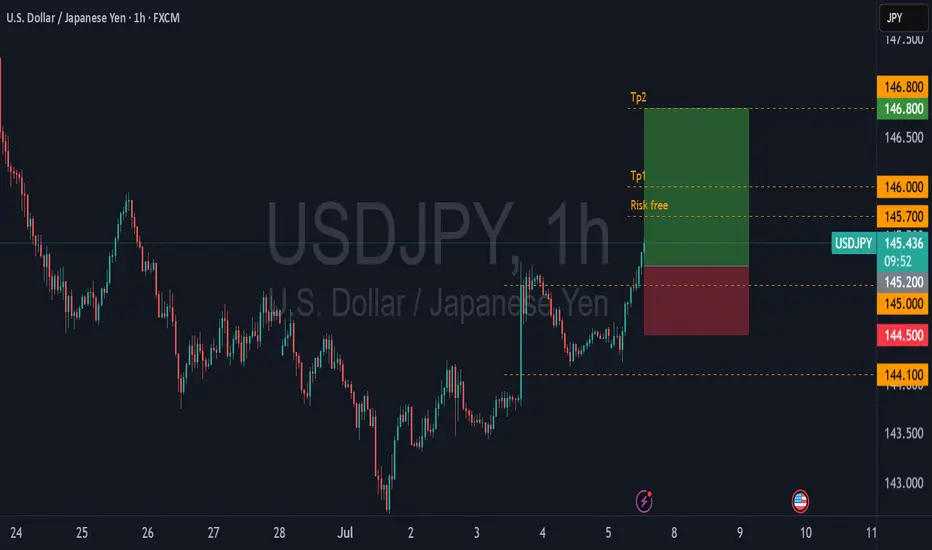
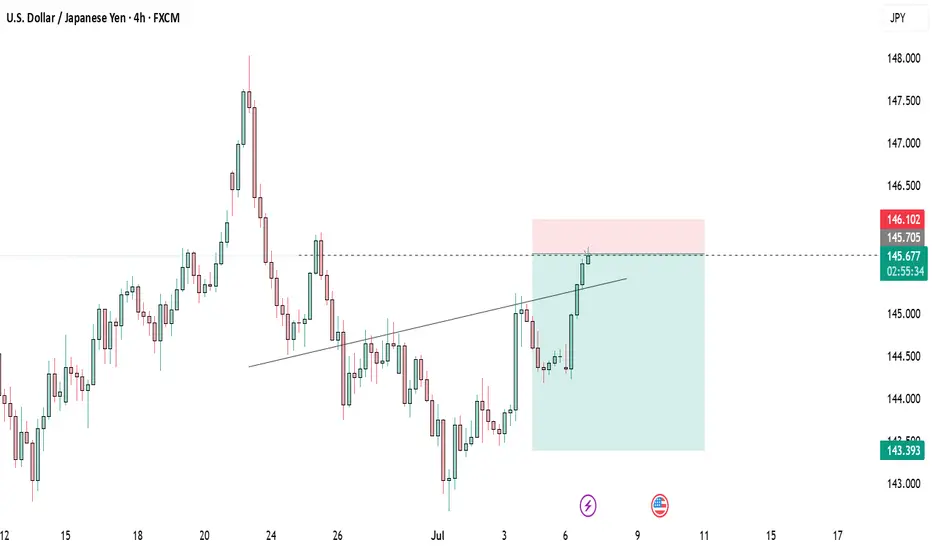
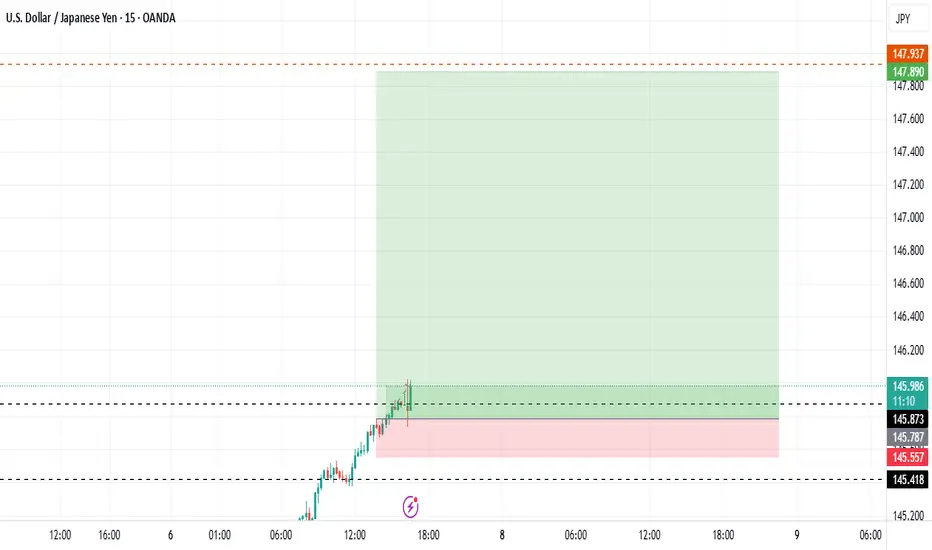
USDJPY Pre-Breakout Setup – Eyes on 145.310 for Bullish EntryThe recent structure on USDJPY (4H chart) shows a bullish shift supported by a strong double bottom formation within a defined demand zone. After a clean impulse from the bottom, price is now consolidating below the key resistance.
🔹 Trade Idea:
I am patiently waiting for the price to break and close above 145.310 to confirm bullish continuation. Entry is valid only above this level to avoid false breakouts.
🔹 Technical Highlights:
- Price rebounded from a strong demand zone with a double bottom.
- A new bullish leg formed, approaching the 0.786 Fibonacci retracement level.
- A clear impulse-correction structure signals potential for further upside if resistance is broken.
🔹 Trade Plan:
- Buy Above: 145.310 (confirmation breakout)
- Stop Loss: 144.40 (below structure and 0.382 Fib)
- Target: 146.900 (aligned with 1.618–2.0 Fibonacci extension)
⚠️ Note: No trade if price fails to break and hold above the entry trigger. Patience is key.