USDJPYUSDJPY Exchange Rate
USDJPY: 144.495(July 5, 2025)
The pair has been trading in the 144.0–145.0 range in early July, reflecting recent yen strength and a broadly weaker US dollar and japan economic outlook.
10-Year Government Bond Yields
Country 10-Year Yield Date
Japan 1.45%
US 4.31-4.38%
Yield Spread (US10Y - JP10Y):
2.86 percentage points (US yield higher)
Policy Interest Rates
Country Policy Rate
Japan 0.50%
US 4.25–4.50%
Key Insights
USDJPY:
The yen has strengthened in 2025, with USDJPY falling from above 160 earlier in the year to the mid-144s in July. This reflects narrowing yield differentials and shifting global risk sentiment.
Bond Yields:
The US 10-year yield remains elevated at 4.31-4.38%, while Japan’s 10-year yield is at 1.45-1.43%, since 2019 jp10y is on the rise ,reflecting japan strong economic outlook
Yield Differential:
The US-Japan 10-year bond yield spread is 2.86%, favoring the US dollar. However, this spread has narrowed from earlier highs, contributing to recent yen strength.
Interest Rate Policy:
The Federal Reserve maintains a 4.25–4.50% target range, with markets expecting possible cuts later in 2025.
The Bank of Japan holds its policy rate at 0.50%, the highest since 2008, but remains cautious about further hikes due to growth and inflation uncertainties.
Summary Table
Metric US Japan Differential
Policy Rate 4.25–4.50% 0.50% 3.75–4.00%
10-Year Bond Yield 4.31% 1.45% 2.86%
Market Implications
USDJPY Direction:
The narrowing yield spread and expectations of Fed rate cuts have pressured USDJPY lower, supporting the yen.
Bond Differential:
The still-wide, but narrowing, US-Japan yield gap remains a key driver for capital flows and currency moves.
Interest Rate Outlook:
Any shift in Fed or BOJ policy will directly impact both the yield spread and USDJPY direction in the coming months.
#usdjpy
JPYUSD trade ideas

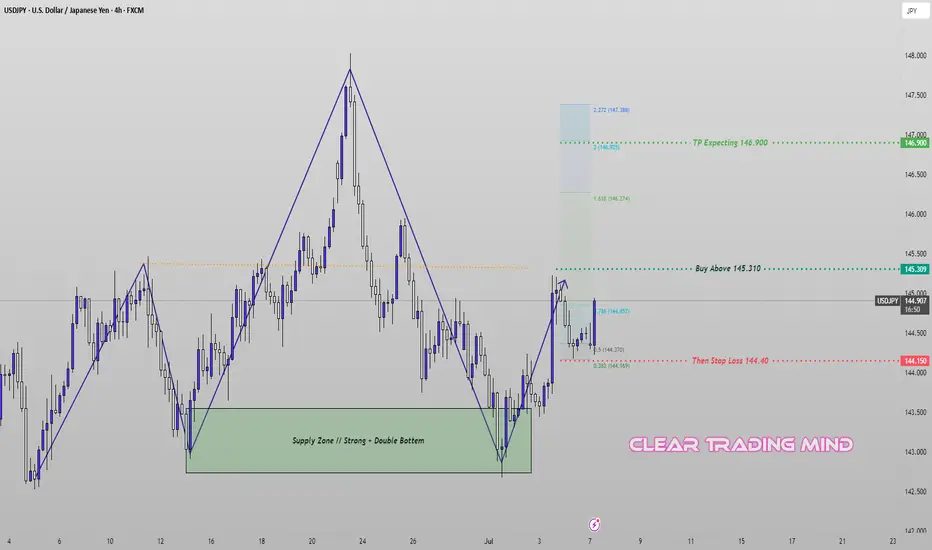
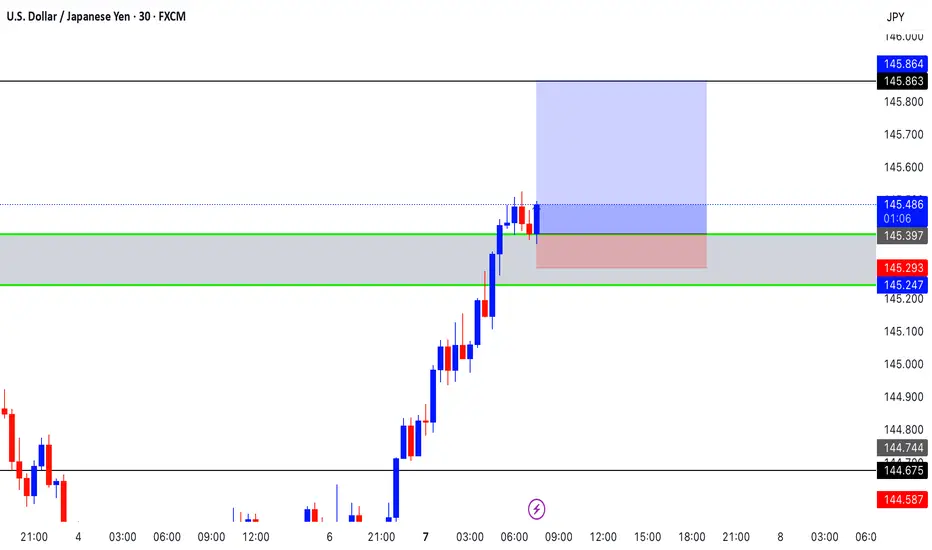
USDJPY Pre-Breakout Setup – Eyes on 145.310 for Bullish EntryThe recent structure on USDJPY (4H chart) shows a bullish shift supported by a strong double bottom formation within a defined demand zone. After a clean impulse from the bottom, price is now consolidating below the key resistance.
🔹 Trade Idea:
I am patiently waiting for the price to break and close above 145.310 to confirm bullish continuation. Entry is valid only above this level to avoid false breakouts.
🔹 Technical Highlights:
- Price rebounded from a strong demand zone with a double bottom.
- A new bullish leg formed, approaching the 0.786 Fibonacci retracement level.
- A clear impulse-correction structure signals potential for further upside if resistance is broken.
🔹 Trade Plan:
- Buy Above: 145.310 (confirmation breakout)
- Stop Loss: 144.40 (below structure and 0.382 Fib)
- Target: 146.900 (aligned with 1.618–2.0 Fibonacci extension)
⚠️ Note: No trade if price fails to break and hold above the entry trigger. Patience is key.
USD/JPY - Potential TargetsDear Friends in Trading,
How I see it,
STRONG PIVOT/SUPPORT @ 147.135
Caution:
All bullish TPs indicated are in multiple previous swing areas.
Monitor price action closely at these levels.
As long as price holds above PIVOT, bullish continuation remains
a high probability.
I sincerely hope my point of view offers a valued insight.
Thank you for taking the time to study my analysis.

X1: USDJPY Short TradeFX:USDJPY Short swing trade, with my back testing of this strategy, it hits multiple possible take profits, manage your position accordingly.
Risking 1% to make 1.35%
Don't overload your risk like greedy, be disciplined trader, this is good trade.
Use proper risk management
Looks like good trade.
Lets monitor.
Use proper risk management.
Disclaimer: only idea, not advice
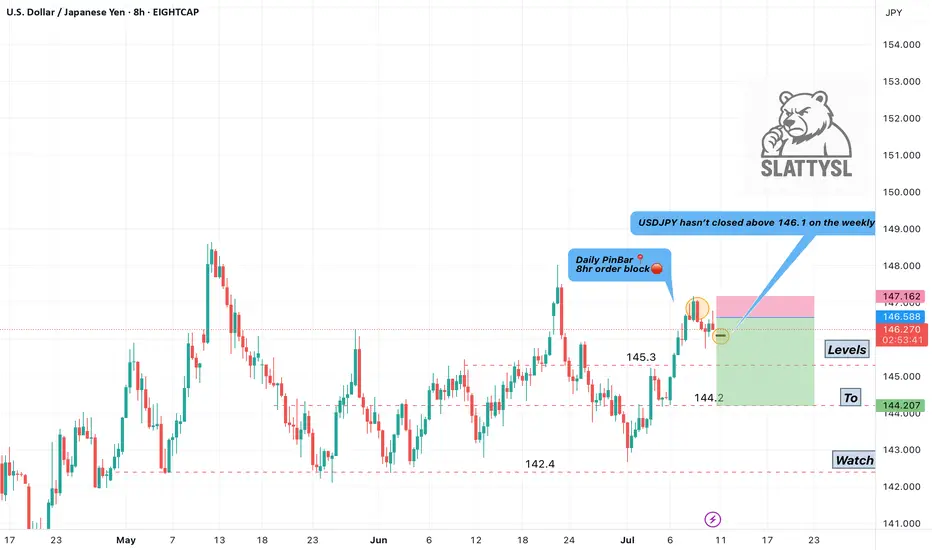
USD/JPY Possible Bear Scenario🔍 Analysis Summary:
USDJPY has failed to close above 146.1 on the weekly for the past 13 candles, showing clear signs of price exhaustion at this level. Price has also tapped into a marked 8HR bearish order block and printed a Daily Pin Bar — a strong reversal signal indicating potential downside.
📍Key Technicals:
• Resistance Holding: 146.1–146.6 zone
• Bearish Rejection: Pin Bar off resistance + order block
• Risk Area (Stop Zone): Above 147.16
• Target Zones: 144.2 (interim) → 142.4 (swing level)
🛠 Confluence:
• Order block rejection
• Multi-week resistance
• Clean structure with defined R:R
• Bearish candlestick confirmation
📊 Timeframe: 8HR
📉 Bias: Short
🔐 Risk Management: Proper stop loss in place above structure. Use personal risk limits.
⸻
⚠️ Disclaimer:
This setup is for educational and informational purposes only. It is not financial advice or a recommendation to trade. Always conduct your own analysis and use risk management based on your personal trading plan.
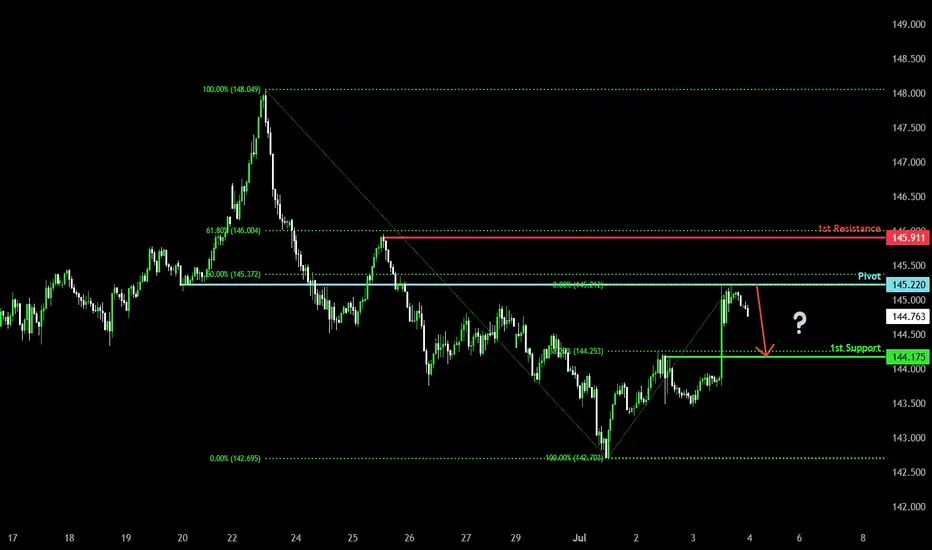
Bearish reversal?USD/JPY has rejected off the pivot and could potentially drop to the 38.2% Fibonacci support.
Pivot: 145.22
1st Support: 144.17
1st Resistance: 145.91
Risk Warning:
Trading Forex and CFDs carries a high level of risk to your capital and you should only trade with money you can afford to lose. Trading Forex and CFDs may not be suitable for all investors, so please ensure that you fully understand the risks involved and seek independent advice if necessary.
Disclaimer:
The above opinions given constitute general market commentary, and do not constitute the opinion or advice of IC Markets or any form of personal or investment advice.
Any opinions, news, research, analyses, prices, other information, or links to third-party sites contained on this website are provided on an "as-is" basis, are intended only to be informative, is not an advice nor a recommendation, nor research, or a record of our trading prices, or an offer of, or solicitation for a transaction in any financial instrument and thus should not be treated as such. The information provided does not involve any specific investment objectives, financial situation and needs of any specific person who may receive it. Please be aware, that past performance is not a reliable indicator of future performance and/or results. Past Performance or Forward-looking scenarios based upon the reasonable beliefs of the third-party provider are not a guarantee of future performance. Actual results may differ materially from those anticipated in forward-looking or past performance statements. IC Markets makes no representation or warranty and assumes no liability as to the accuracy or completeness of the information provided, nor any loss arising from any investment based on a recommendation, forecast or any information supplied by any third-party.
EURJPY 60/5 Pullback LongOverall up trend. Patiently waiting the pull back to the buy zone and long.

USDJPY SELLWe have officially gotten a change of trend as proven by the transition from a sequence of higher highs and higher lows to a lower low and lower high. Stacked on top of this sequence is a pullback for a retest of a key level confirming our setup.
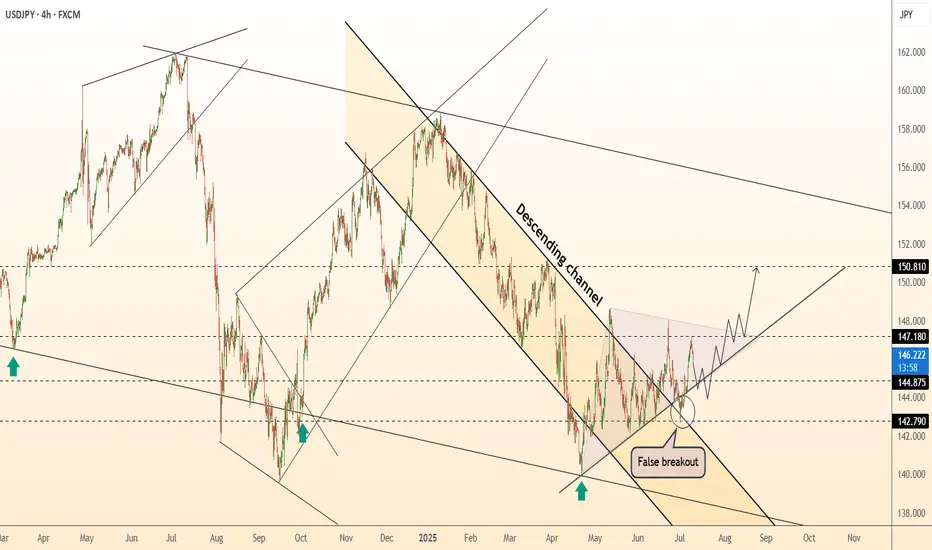
DeGRAM | USDJPY fixed above the descending channel📊 Technical Analysis
● Dollar-yen has punched through the 16-month descending channel top and twice retested it as support (false-break tags), carving a rising trend line that now guides price away from 144.90.
● Inside the break zone a smaller pennant is forming; a 4 h close above 147.18 completes the pattern and activates the channel-height target at 150.80 near the November swing cap.
💡 Fundamental Analysis
● US 2-yr yields pushed to a three-month high after hotter CPI core-services and Barkin’s “inflation progress has stalled”, while the BoJ July minutes flagged only “gradual” QT—widening the policy gap and reviving carry demand for yen shorts.
✨ Summary
Long 145.2-146.2; pennant break >147.18 targets 150.80. Bias void on a 4 h close below 142.80.
-------------------
Share your opinion in the comments and support the idea with like. Thanks for your support!
USDJPY continuation buyThe daily bias is still bullish. I am looking to take profit at the daily resistance above 148.430
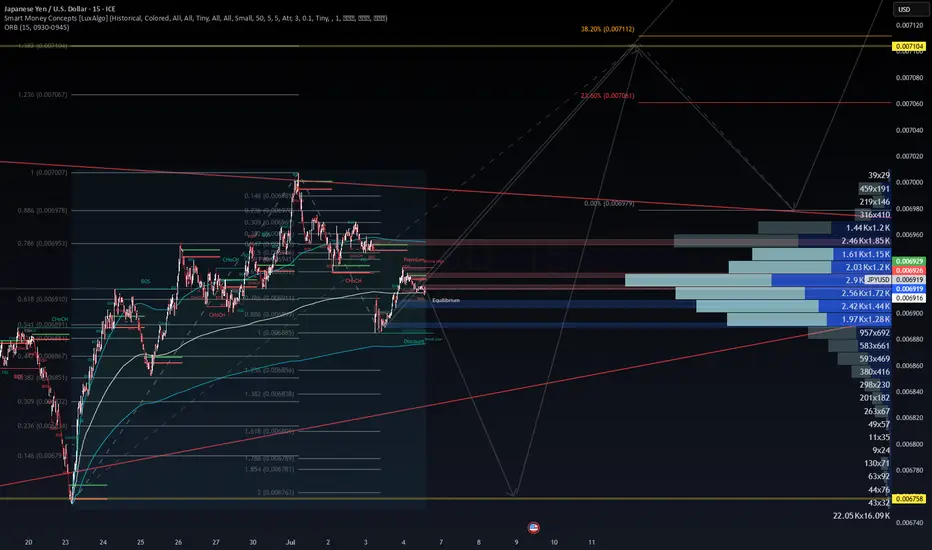
WaverVanir DSS Trade Plan – JPYUSD=X (July 6, 2025)🧭 Directional Bias: Bullish Reversal from Discount Zone
📉 Current Price: 0.006919
🧠 Thesis:
Price reacted strongly from the Discount Wick Low Zone (≈ 0.006885–0.006856).
The current structure shows:
✅ CHoCH to the upside near the EQ
✅ Volume cluster support at 0.00691
🟦 Liquidity sweep occurred at prior lows.
Expecting a reversal back into Premium zone toward Fibonacci extension clusters near 0.00707–0.00711.
🎯 Trade Setup: Long JPY/USD (Short USD/JPY)
Element Value / Zone
Entry Zone 0.00691–0.00692 (Equilibrium / 0.618 Fib)
Stop Loss (SL) 0.006875 (below recent Discount Low / 0.786 Fib)
Take Profit 1 0.006978 (0.886 Fib / SMC Break level)
Take Profit 2 0.00707 (1.236 Fib / major OB target)
Take Profit 3 0.007112 (38.2% extension – long-term target)
Risk-Reward TP1 ≈ 2.3:1, TP2 ≈ 3.6:1, TP3 ≈ 5.4:1
🔍 Volume Profile Insight:
Heavy accumulation at:
0.00691 (high confluence of OB, Fib, and volume)
Above 0.00695, price enters "inefficient" zone → price may accelerate rapidly.
Most volume near 0.00692 confirms institutional interest.
🔐 Risk Management:
Max 1–2% capital exposure per position
Position sizing should reflect SL width of ~4.4 pips
Trailing stop once TP1 is reached to protect profits
🔄 Alternate Scenario (Invalidate if):
Price breaks and closes below 0.006875 with high volume
Then, revisit 0.006758 (Golden Zone) as next long accumulation zone
Consider reversing bias if a CHoCH to the downside occurs post TP1 rejection
⏱️ Timeframe:
Holding Period: 2–5 days (swing scalping opportunity)
Suitable for: CFD traders, JPY futures traders (e.g., J6), or FX options buyers
🔗 Suggested Option Strategy (for FX traders using options):
Bull Call Spread on JPYUSD=X or inverse Put Spread on USDJPY
Strike range:
Expiry: July 12–19
✅ Summary:
Execute long from Equilibrium zone (~0.00691) toward 0.00707–0.00711. Strong confluence from Fib extensions, SMC structure, and volume profile validates a reversal.
Protect with tight SL under 0.006875. Scale out at key premiums.
USDJPY LONGMarket structure bullish on HTFs DH
Entry at both Weekly and Daily AOi
Weekly Rejection at AOi
Daily Rejection At AOi
Previous Structure point Daily
Around Psychological Level 144.000
H4 Candlestick rejection
Rejection from Previous structure
Levels 2.91
Entry 95%
REMEMBER : Trading is a Game Of Probability
: Manage Your Risk
: Be Patient
: Every Moment Is Unique
: Rinse, Wash, Repeat!
: Christ is King.
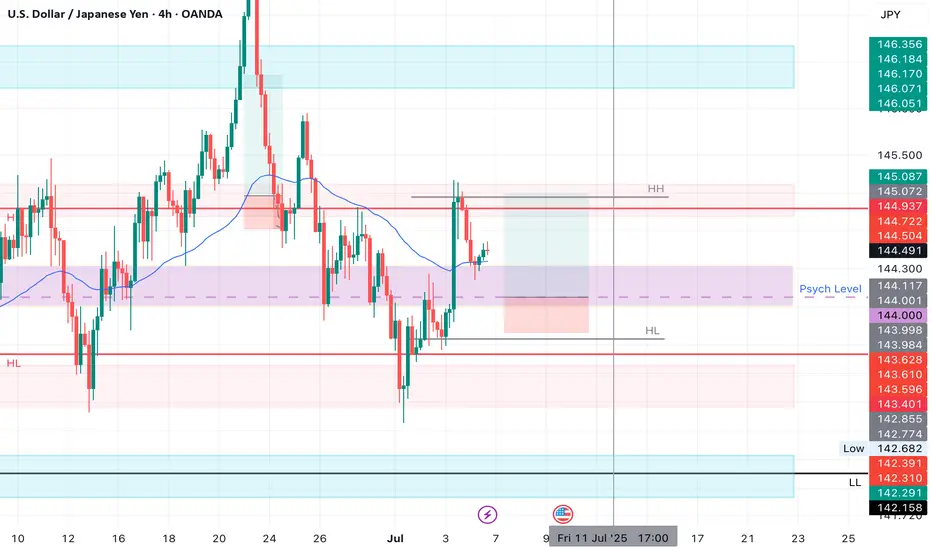
USD/JPY 4-Hour Chart Analysis4-hour chart for the U.S. Dollar/Japanese Yen (USD/JPY) currency pair, sourced from The chart displays the exchange rate's fluctuations over time, with key indicators and annotations
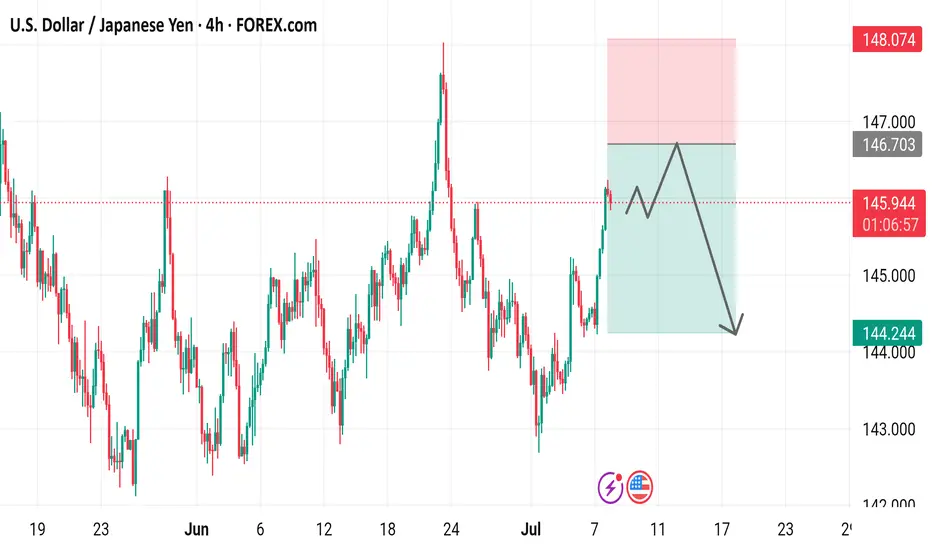
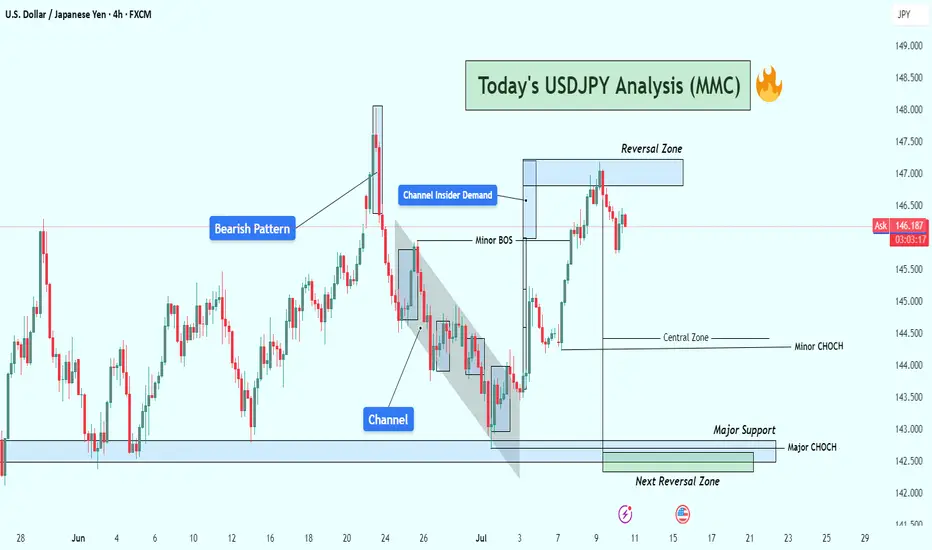
USDJPY Analysis : Bearish Setup from Reversal Zone + Target⚠️ Overview:
The USDJPY 4H chart reveals a smart money-driven bearish setup, unfolding precisely from a major Reversal Zone, which aligns with a key supply area. Price action is now offering high-probability short trade opportunities, supported by structural breaks, clear CHoCHs (Change of Character), and BOS (Breaks of Structure).
🔎 Detailed Technical Breakdown:
🔹 Bearish Pattern + Channel Formation:
The pair formed a bearish price pattern earlier, which initiated the previous downtrend. This move developed into a well-formed descending channel, showing controlled distribution from the institutional side. The channel break marked a liquidity grab below previous lows, trapping retail sellers before shifting structure.
🔹 Channel Insider Demand + Breakout:
After reaching the Channel Insider Demand, USDJPY made a strong bullish push, causing a Minor BOS — a sign of temporary bullish pressure. However, this move served to rebalance price into a premium zone, which is the current Reversal Zone. This zone lies near previous imbalance/fair value gaps and coincides with a supply structure, making it a high-reaction area.
🔹 Reversal Zone (Premium Area):
Price tapped the Reversal Zone and began rejecting aggressively. This reaction indicates the presence of large sellers and order blocks. The current price action now displays a Minor CHoCH, suggesting a short-term bearish shift in order flow.
This is a textbook case of premium vs. discount pricing, where price seeks liquidity above recent highs before reversing to more balanced zones.
🔹 Price Flow Expectations (Downside Targets):
The first confirmation of bearish continuation will come with a clean break below the Minor CHoCH level (~144.400). Following that, momentum is expected to carry USDJPY toward:
🥇 Target 1: 144.00 – Local support / liquidity pocket
🥈 Target 2: 143.00 – Key psychological & structural support
🥉 Target 3: 142.00–142.50 Zone – Marked as the Next Reversal Zone, which could act as demand
This setup remains valid as long as the price remains below 147.200, which is the high of the Reversal Zone. A breakout above this invalidates the bearish thesis.
🧠 MMC (Mind Market Curve) Interpretation:
The chart clearly respects Mind Curve Theory structure:
CHoCH/BOS confirms internal order flow
Reversal zone is placed at a curve top (premium)
Support base (discount zone) is yet to be revisited
The curve shape guides a possible rounded rejection scenario, pushing price down into the major support, aligning with smart money liquidity grab behavior.
📊 Strategic Insight:
This is a classic smart money trap — fake bullish breakout, quick grab of early breakout traders’ stops, followed by a decisive turn from supply.
Traders should monitor:
Candle structure at current levels
Reaction to minor CHoCH zone (~144.400)
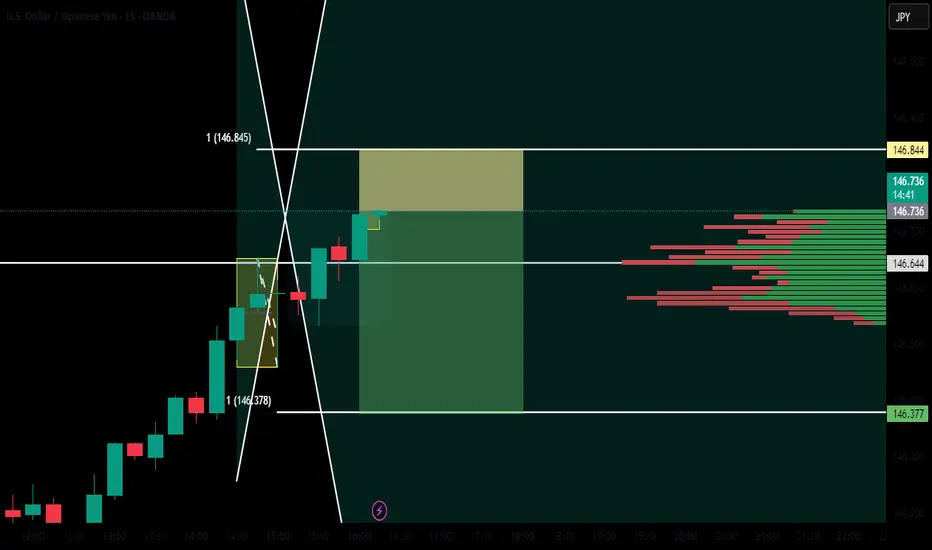
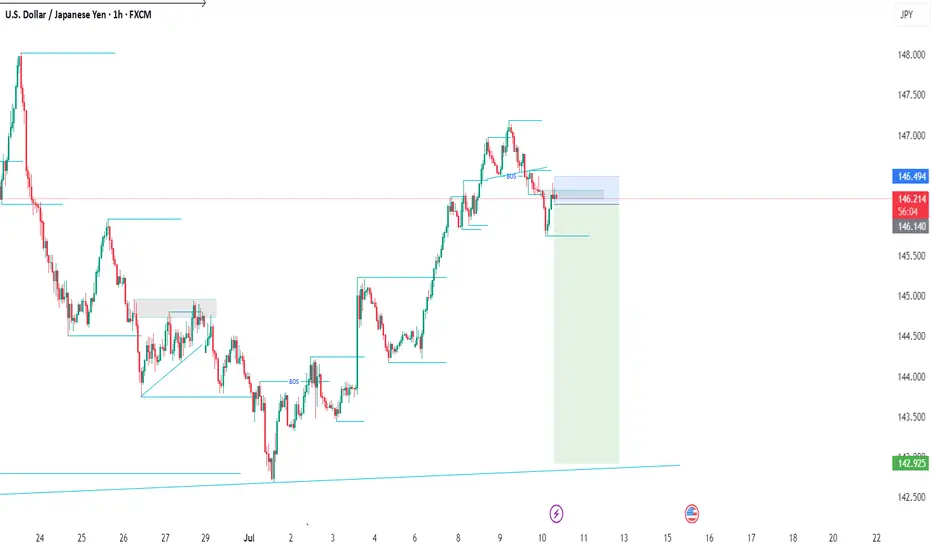
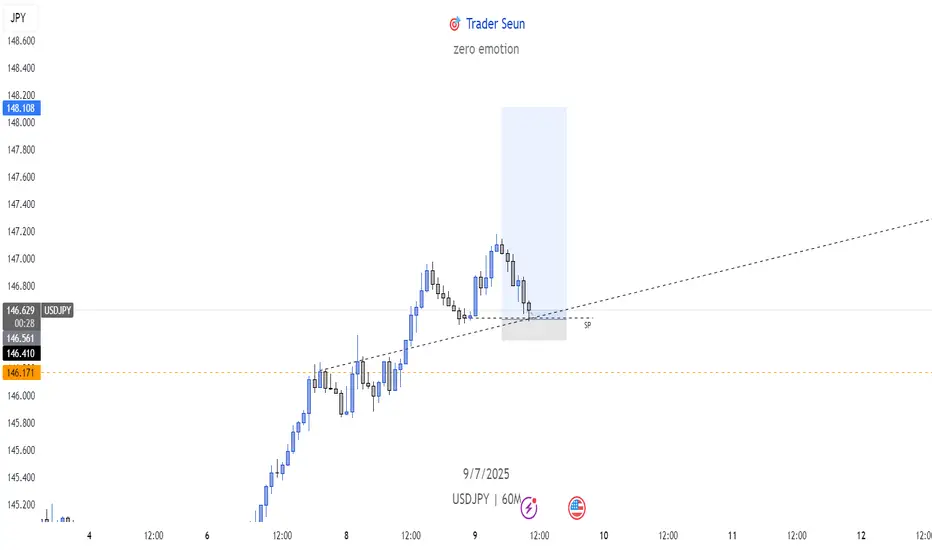
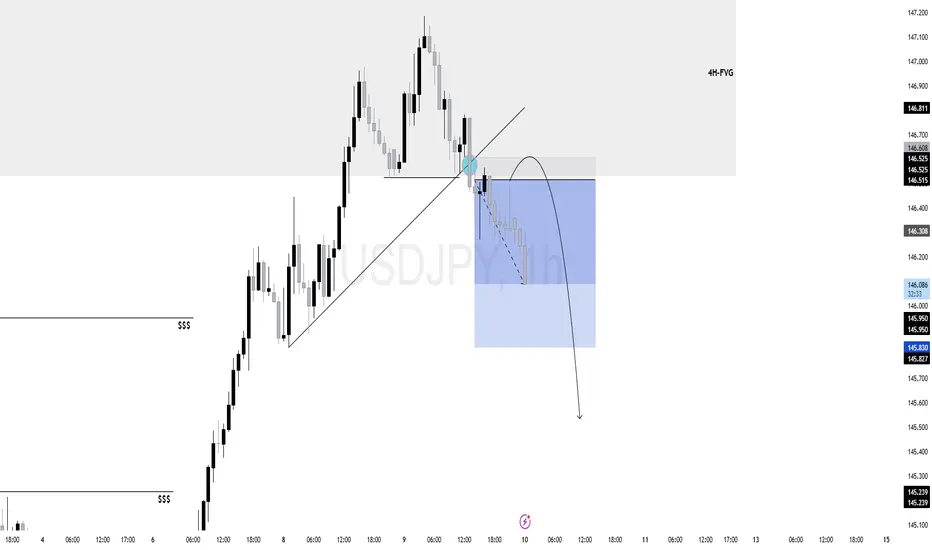
$UJ (USDJPY) 1HPrice tapped into a 4H FVG (gray zone 146.800–146.300), a high-probability reversal zone when paired with liquidity sweep and break of structure.
The bullish internal trendline was cleanly broken, signaling a short-term shift in momentum.
Prior to the drop, price ran buy-side liquidity resting above previous highs (marked $$$), fulfilling liquidity objectives before reversing.
The move into the 4H-FVG occurred in premium territory, ideal for institutional distribution.
As long as price holds below 146.300 (top of the FVG), the bearish leg remains valid.
Next liquidity target is around 145.240, where previous sell-side liquidity (lows marked $$$) is resting.
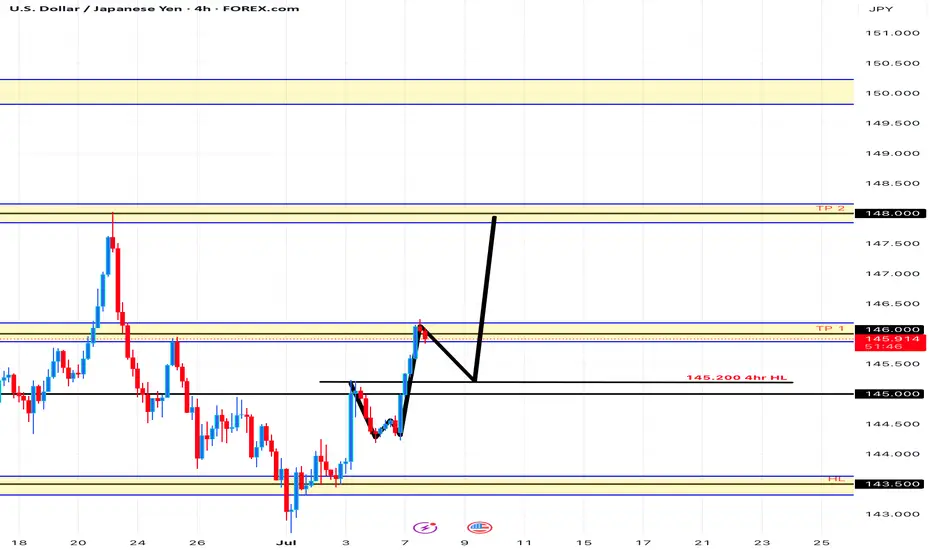
USD/JPY Uptrend On the 4hr We can still see price making Higher Lows and Higher Highs.
Price will retrace to 145.200-145.000 before going back up to 148.000.
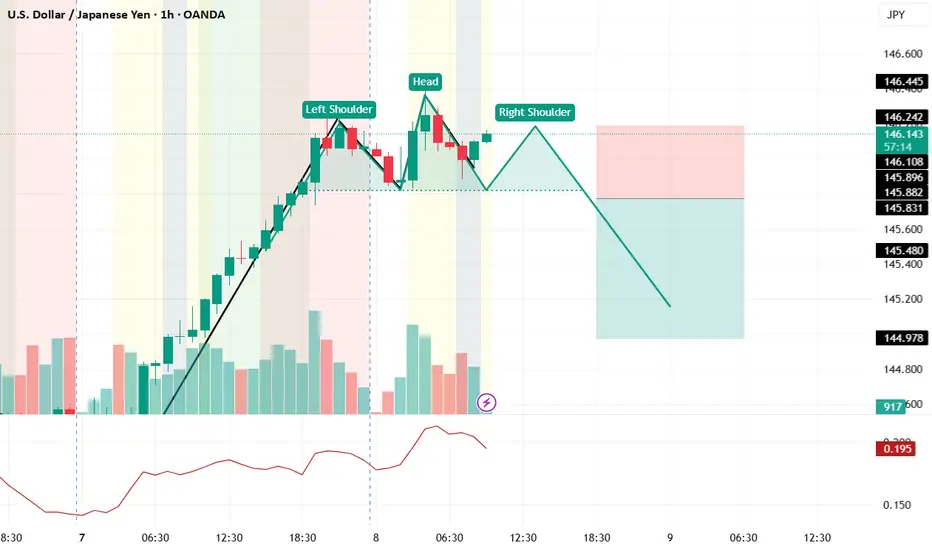
usdjpy head and shoulder emergingexperimental !!! it can be a possible scenario , pls feel free to coment and share your ideas with me hop you have green portfolio!!!
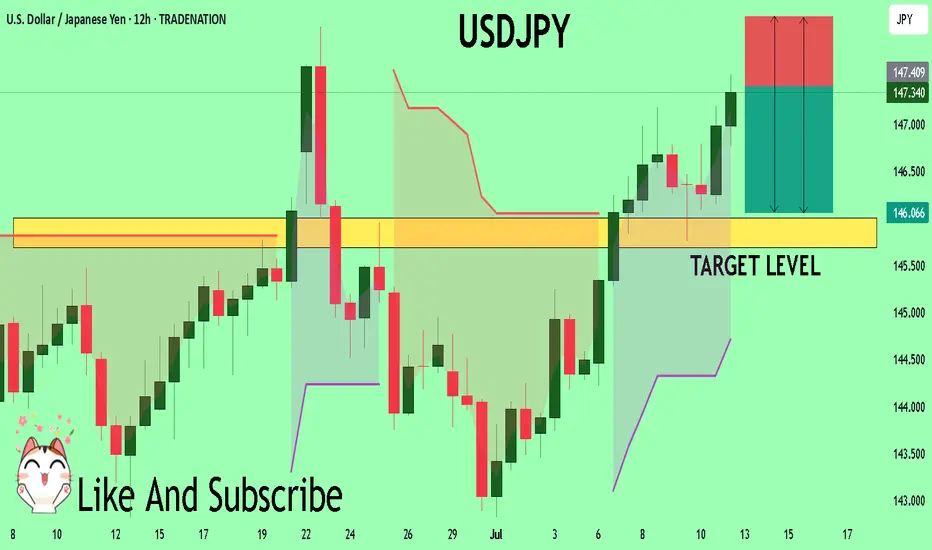
USDJPY The Target Is DOWN! SELL!
My dear friends,
Please, find my technical outlook for USDJPY below:
The price is coiling around a solid key level - 147.41
Bias - Bearish
Technical Indicators: Pivot Points High anticipates a potential price reversal.
Super trend shows a clear sell, giving a perfect indicators' convergence.
Goal - 146.00
Safe Stop Loss - 148.14
About Used Indicators:
The pivot point itself is simply the average of the high, low and closing prices from the previous trading day.
Disclosure: I am part of Trade Nation's Influencer program and receive a monthly fee for using their TradingView charts in my analysis.
———————————
WISH YOU ALL LUCK
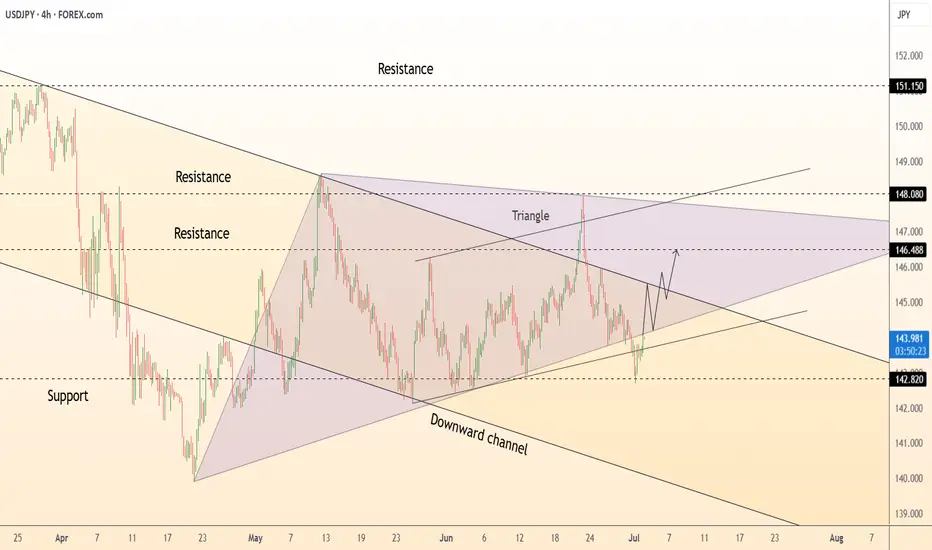
DeGRAM | USDJPY formed the triangle📊 Technical Analysis
● Price defended the 142.80 confluence (triangle base + channel median), printing a bullish hammer and reclaiming the short-term trendline; structure now forms an ascending triangle inside the broader consolidation.
● Momentum is rising toward 146.50 – the pattern’s 1:1 swing and prior supply – with the next objective the upper triangle wall at 148.10. Invalid if candles fall back under 142.80.
💡 Fundamental Analysis
● Rebound in US ISM manufacturing and Fed minutes hinting “no near-term cuts” lifted 2-yr yields, while weak Japanese wage growth keeps the BoJ patient. The widening policy gap revives USD/JPY bid.
✨ Summary
Long 143.4-144.1; targets 146.5 then 148.1. Exit on a 4 h close below 142.8.
-------------------
Share your opinion in the comments and support the idea with like. Thanks for your support!
🇺🇸🇯🇵 USDJPY Weekly Plan – CPI Could Trigger Reversal🌍 Macro Outlook – Inflation in Focus This Week
USDJPY is entering a critical week with high-impact US economic releases, particularly inflation and retail sales data, which could strongly influence dollar momentum.
🔔 Key Events (GMT):
Tuesday (Jul 15)
– US Core CPI, CPI m/m, CPI y/y
– Empire State Manufacturing Index
Wednesday (Jul 16)
– US PPI (Core + Headline)
– UK CPI y/y
Thursday (Jul 17)
– US Core Retail Sales, Retail Sales, Unemployment Claims
– GBP Labour Market Report
Friday (Jul 18)
– US Consumer Sentiment & Inflation Expectations
⚠️ Higher-than-expected inflation could drive USDJPY toward fresh highs.
But if data cools or jobs data weakens, JPY strength may pull the pair back down sharply.
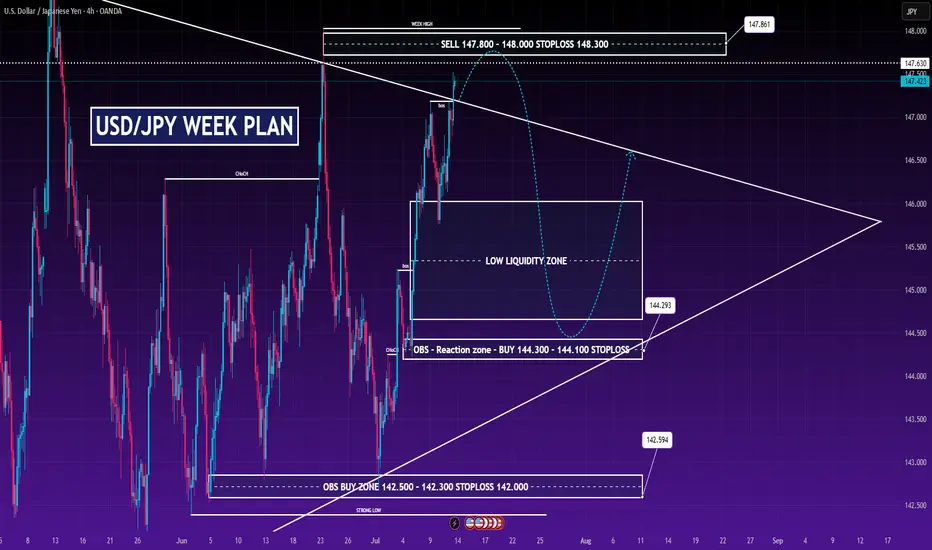
📊 Technical Analysis – H4 Smart Money Structure
🔻 SELL ZONE
147.800 – 148.000
SL: 148.300
Weekly high with strong liquidity
Diagonal resistance and BOS (Break of Structure) area
Rejection expected if CPI cools or yields drop
🟢 BUY REACTION ZONE
144.300 – 144.100
SL: 144.000
FVG + previous supply turned demand
Good for a bounce or short-term scalp
🟢 STRONG DEMAND ZONE
142.500 – 142.300
SL: 142.000
Aligned with trendline and structural low
Swing entry if price dumps post-news
🧠 Market Structure Insight:
USDJPY still trending upwards, but RSI divergence and liquidity sweep suggest correction is likely.
Price could form a lower high near 147.800 before retracing to deeper zones.
Key confluences align with macro data timing.
🎯 Trade Scenarios
🔹 Scenario 1 – Short Setup
Entry: 147.800–148.000
SL: 148.300
TP1: 146.000
TP2: 144.300
TP3: 142.300 (Open if USD weakens)
🔹 Scenario 2 – Reaction Buy
Entry: 144.300–144.100
SL: 144.000
TP1: 145.500
TP2: 146.700
TP3: Open
🔹 Scenario 3 – Swing Buy
Entry: 142.500–142.300
SL: 142.000
TP1: 144.000
TP2: 146.000
TP3: 147.800 (if trend resumes)
🔍 Key Price Levels to Watch
148.000 – Weekly Liquidity Zone
144.300 – Short-Term Support / Reaction
142.300 – Swing Buy Zone
📣 Analyst’s Note:
This week, USDJPY direction hinges on US inflation data.
A hot CPI print may push prices toward 148, while weak data could drive a deeper pullback to 144 or 142.
Trade smart, manage risk, and don’t chase breakouts before confirmation.
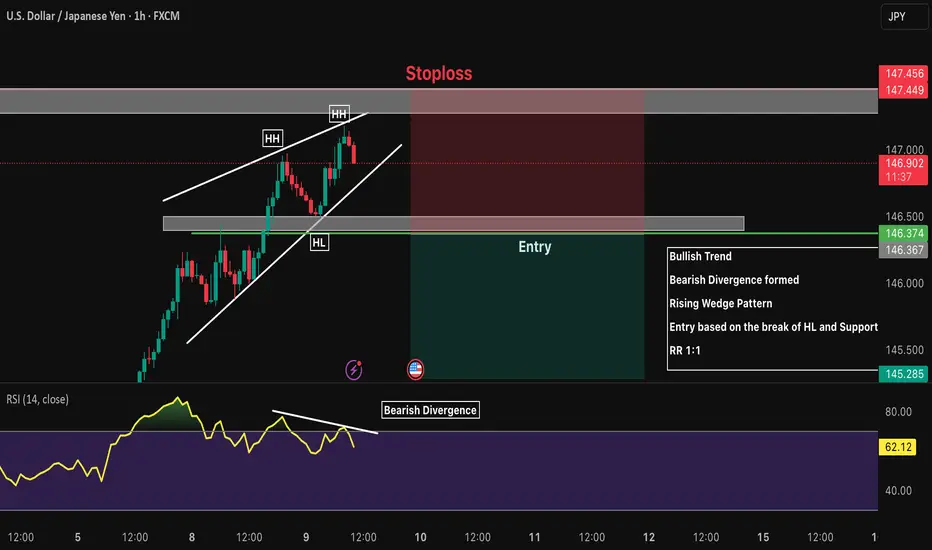
USDJPY 1H Short Bullish Trend
Bearish Divergence formed
Rising Wedge Pattern
Entry based on the break of HL and Support
RR 1:1