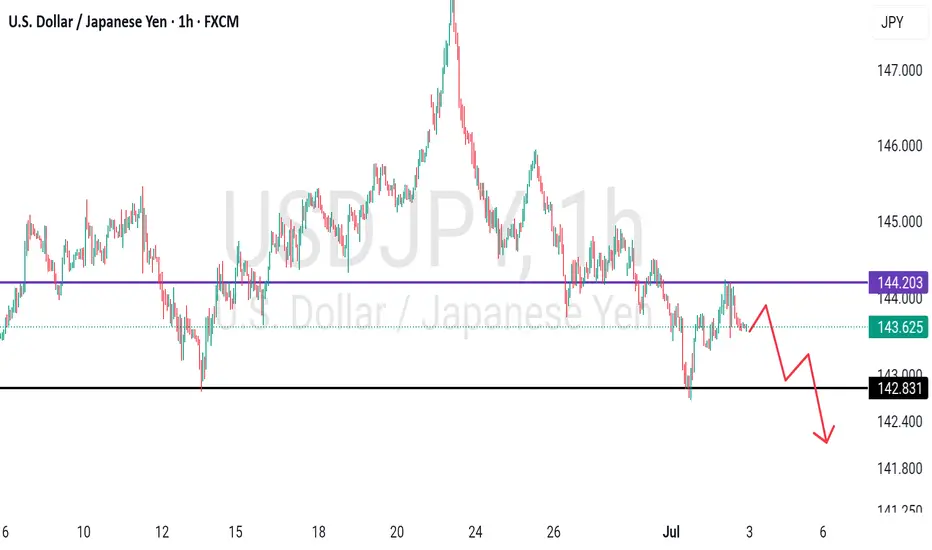
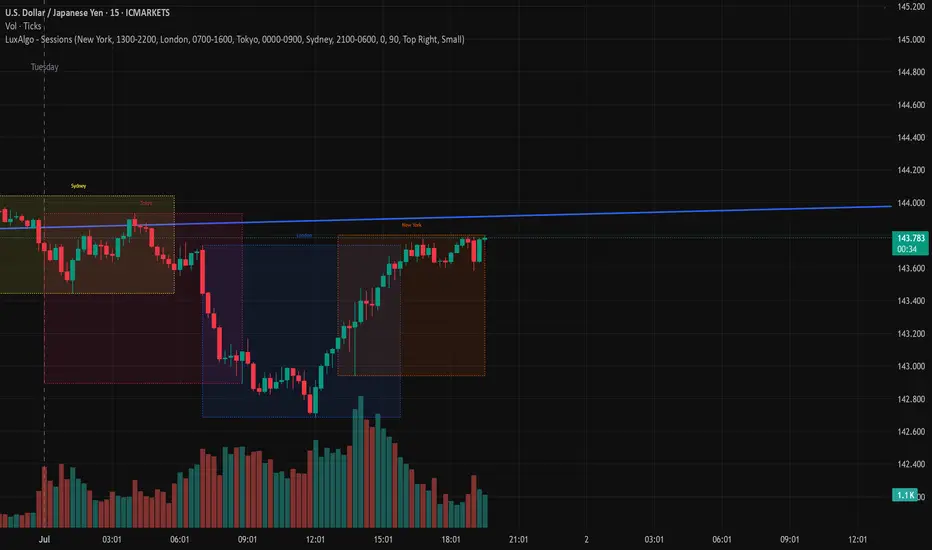
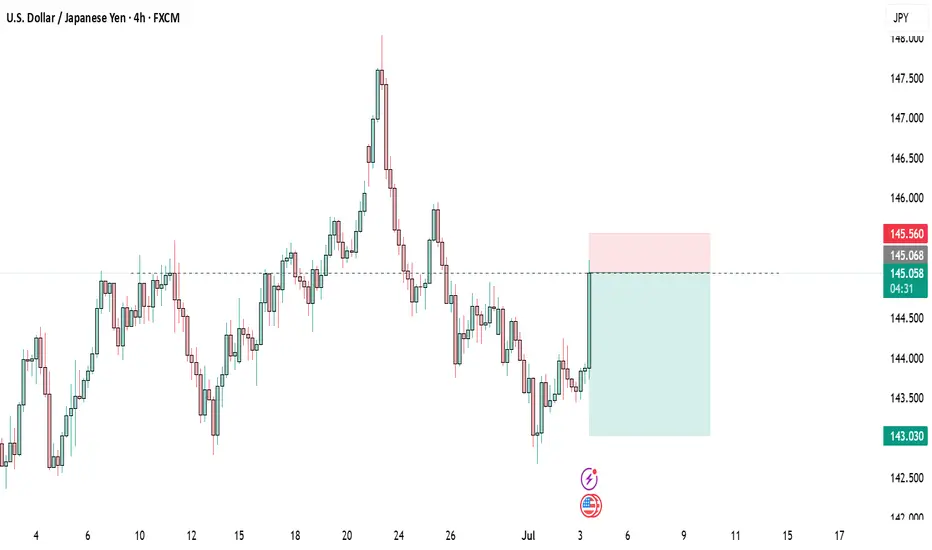
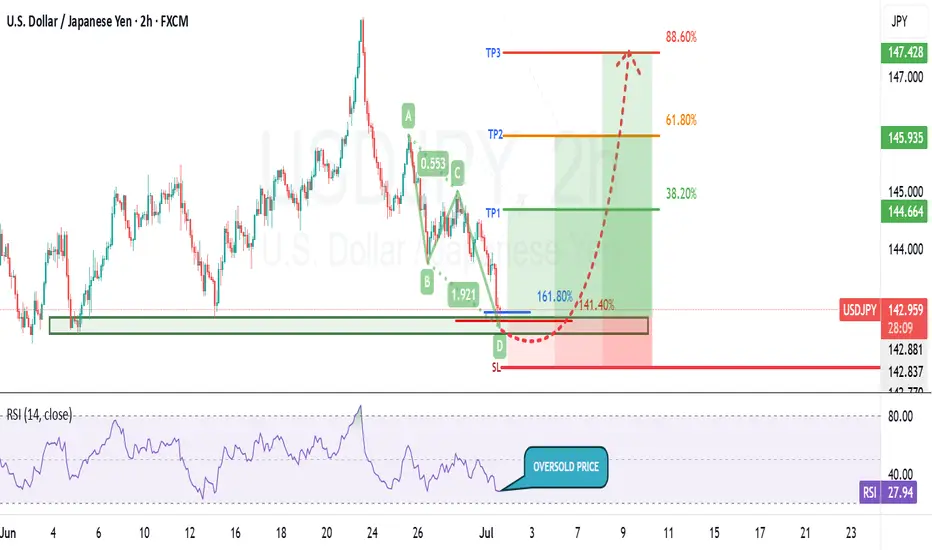
USDJPY Forecast – Bullish Roadmap with Key Retracement LevelsUSDJPY is currently sitting around 144.658. From this level, I’m anticipating a short-term retracement down toward the 143.800 zone, which may act as a demand area or liquidity grab before a bounce.
From 143.800, price is expected to climb back to 144.646, potentially breaking slightly above into 144.652, where intraday liquidity or stop hunts might occur. If bullish momentum remains strong, a slight retracement into the 145.132 region could follow — possibly retesting a breakout zone or OB — before a final bullish continuation*targeting 147.353.
> 🔽 Short-term pullback zone: 143.800
> 🔼 Initial bullish target: 144.646 – 144.652
> 🔁 Expected mid-level retracement: 145.132
> 🎯 Final bullish target: 147.353
> 📍 Current price: 144.658
I’ll be monitoring each key level closely for reactions such as W formations, bullish engulfing candles, or break of internal structure to confirm momentum shifts.
📌 Risk Management Note:
This is not financial advice. Always use strict risk management:
✔️ Risk no more than 1–2% per trade
✔️ Use proper **risk-to-reward setups (min 1:2 RR)
✔️ Wait for **clear confirmations before entering
✔️ Protect capital — consistency beats intensity
JPYUSD trade ideas
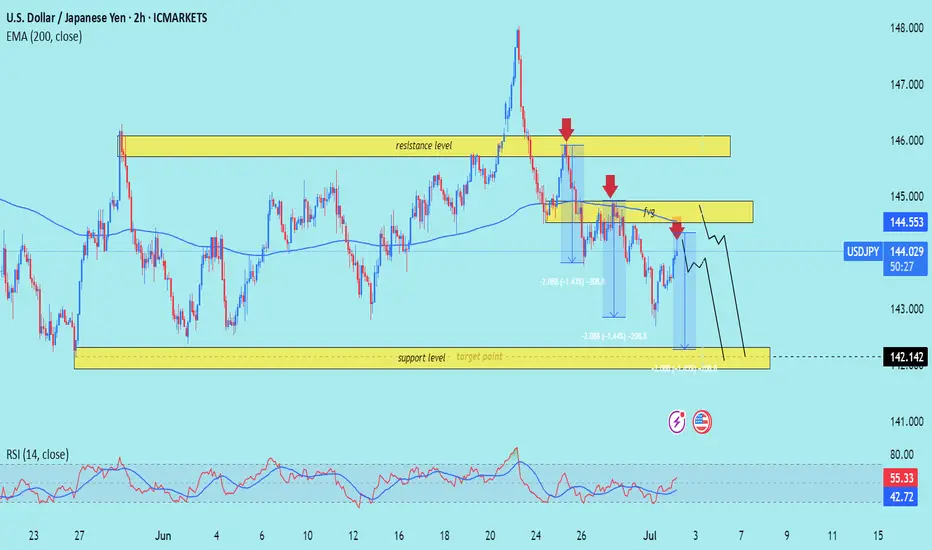
USD/JPY) Back support level Read The captionSMC trading point update
Technical analysis of USD/JPY pair using a combination of price action, resistance/support levels, and indicators. Here's a breakdown of the idea behind the analysis:
---
Chart Breakdown (2H - USD/JPY)
1. Key Zones:
Resistance Level (Yellow Box at Top):
Price has previously been rejected from this zone multiple times.
Recent bearish wicks and aggressive sell-offs are marked by red arrows—showing strong seller interest.
Support Level / Target Point (Bottom Yellow Box):
Price has found strong buying interest around 142.142.
This zone is the anticipated downside target if the bearish scenario plays out.
2. Bearish Bias Justification:
Liquidity Grab / Fakeout (labeled “fug”):
The price briefly broke above the smaller resistance block but quickly reversed.
This "fake breakout" often traps buyers, strengthening the bearish case.
EMA 200 (Blue Line):
Price is currently near or slightly under the 200 EMA (144.553), suggesting a potential rejection area aligning with resistance.
RSI Indicator:
RSI shows divergence and has not confirmed a bullish breakout.
The values (56.77 and 42.82) indicate loss of bullish momentum.
3. Projection (Black Lines):
The black zig-zag lines represent a forecasted drop to the support level.
Suggests a short setup near 144.50–145.00 with targets near 142.14.
Mr SMC Trading point
---
Summary:
Bias: Bearish
Entry Zone: Near resistance area (144.50–145.00)
Target: 142.142 (support zone)
Invalidation: Strong break above 145.00 and hold
Confirmation: Rejection from resistance with bearish candle pattern
---
Please support boost 🚀 this analysis)
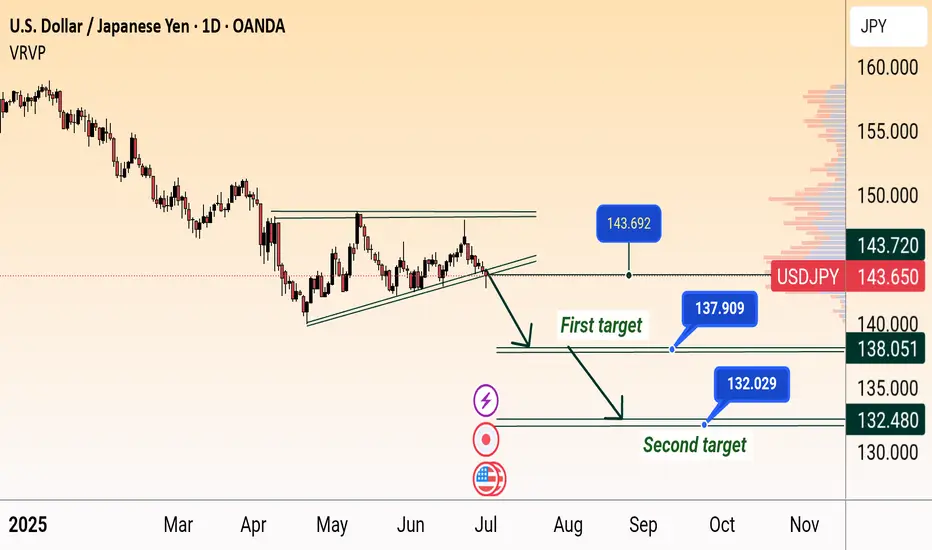
USD/JPY Bearish Breakdown Targets 138 & 132USD/JPY Bearish Breakdown Setup (Daily Chart)
USD/JPY breaks below rising wedge support near 144, signaling potential downside. Price targets are marked at 138.051 (first target) and 132.480 (second target), indicating possible continued weakness if the bearish momentum holds.
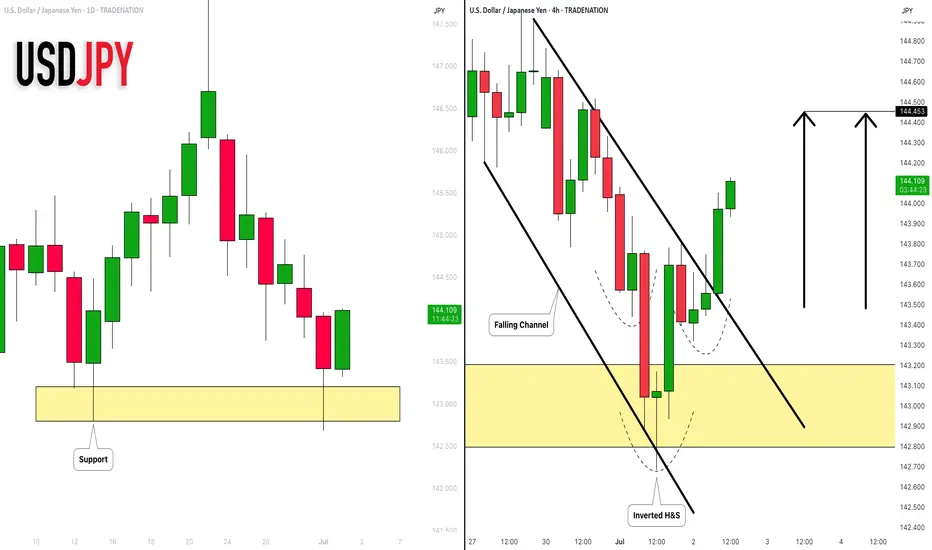
USDJPY: Strong Bullish Price Action 🇺🇸🇯🇵
I see 2 strong bullish confirmation on USDJPY after a test of a key daily
support cluster.
The price violated a trend line of a falling channel and a neckline of
an inverted head & shoulders pattern with one single strong bullish candle.
The pair may rise more and reach 144.45 level soon.
❤️Please, support my work with like, thank you!❤️
I am part of Trade Nation's Influencer program and receive a monthly fee for using their TradingView charts in my analysis.
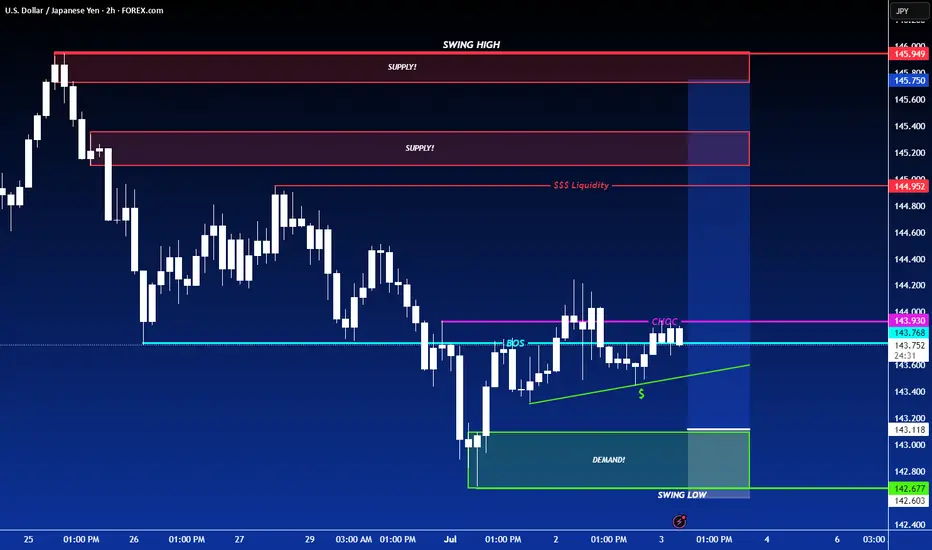
LONG ON USD/JPYUSD/JPY has given us a CHOC (change of character) from down to up.
It has engineered sell side liquidity right above a demand zone.
I expect price to sweep sell side liquidity, tap into the demand zone then take off to the upside.
looking to catch 150-250 pips on UJ. (Economic News could set this trade on Fire!)
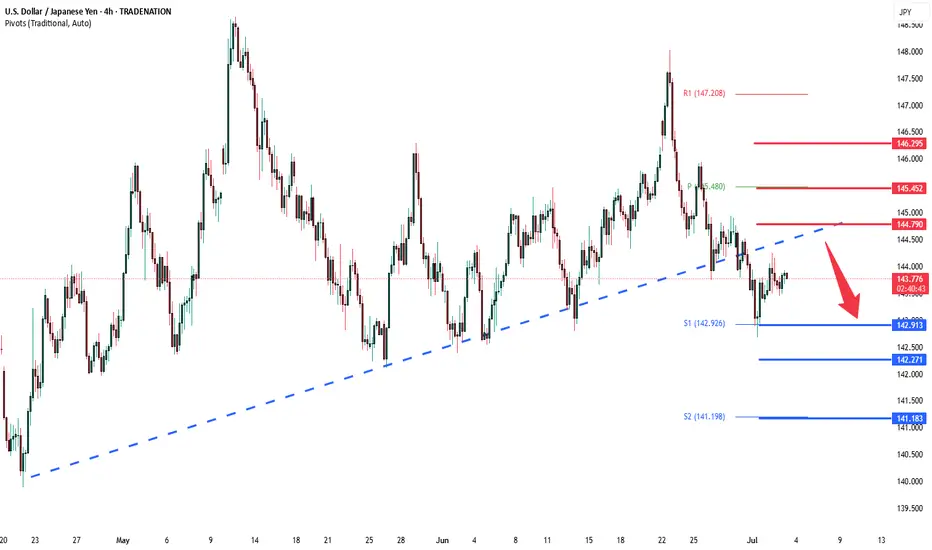
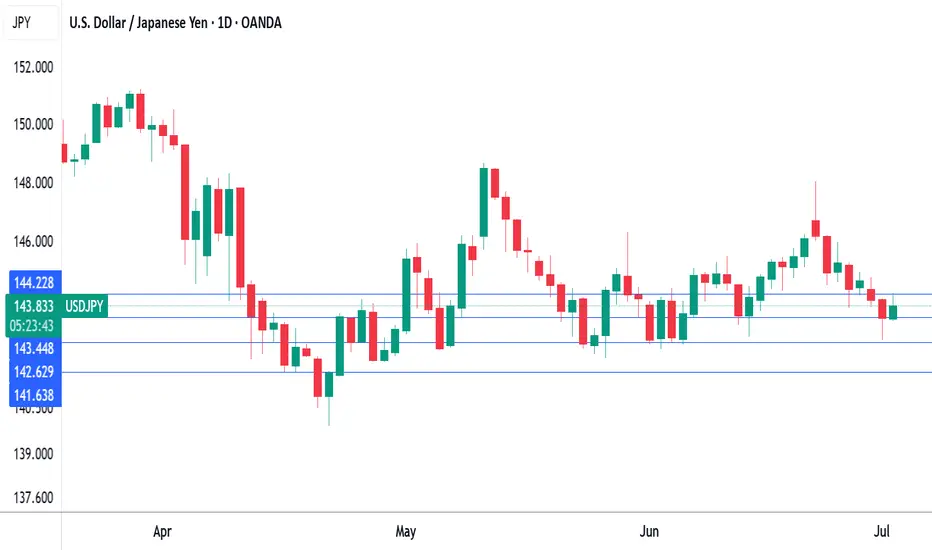
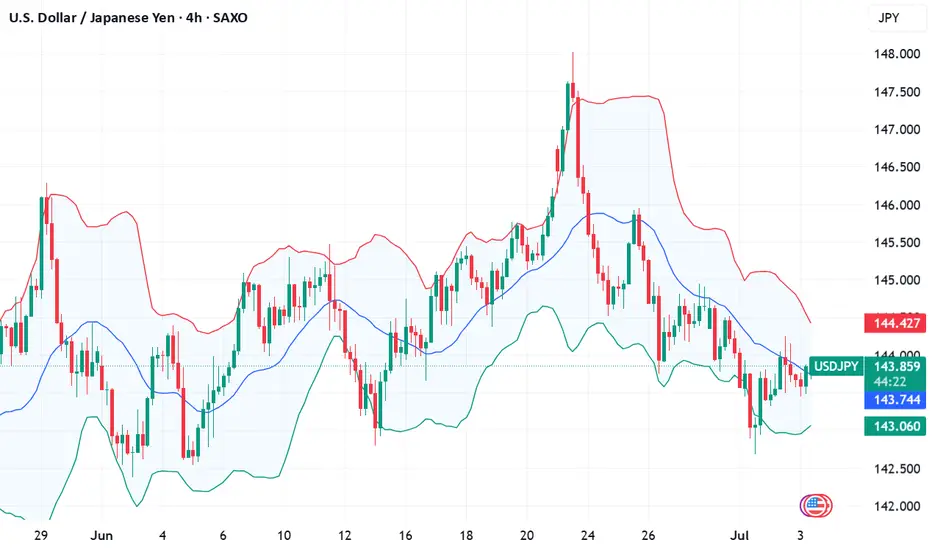
USDJPY previous support, now resistance at 144.80The USDJPY pair is currently trading with a bearish bias, aligned with the broader downward trend. Recent price action shows a retest of the resistance zone, suggesting a temporary relief rally within the downtrend.
Key resistance is located at 144.80, a prior consolidation zone. This level will be critical in determining the next directional move.
A bearish rejection from 144.80 could confirm the resumption of the downtrend, targeting the next support levels at 142.90, followed by 142.30 and 141.20 over a longer timeframe.
Conversely, a decisive breakout and daily close above 144.80 would invalidate the current bearish setup, shifting sentiment to bullish and potentially triggering a move towards 145.45, then 146.30.
Conclusion:
The short-term outlook remains bearish unless the pair breaks and holds above 144.80. Traders should watch for price action signals around this key level to confirm direction. A rejection favours fresh downside continuation, while a breakout signals a potential trend reversal or deeper correction.
This communication is for informational purposes only and should not be viewed as any form of recommendation as to a particular course of action or as investment advice. It is not intended as an offer or solicitation for the purchase or sale of any financial instrument or as an official confirmation of any transaction. Opinions, estimates and assumptions expressed herein are made as of the date of this communication and are subject to change without notice. This communication has been prepared based upon information, including market prices, data and other information, believed to be reliable; however, Trade Nation does not warrant its completeness or accuracy. All market prices and market data contained in or attached to this communication are indicative and subject to change without notice.
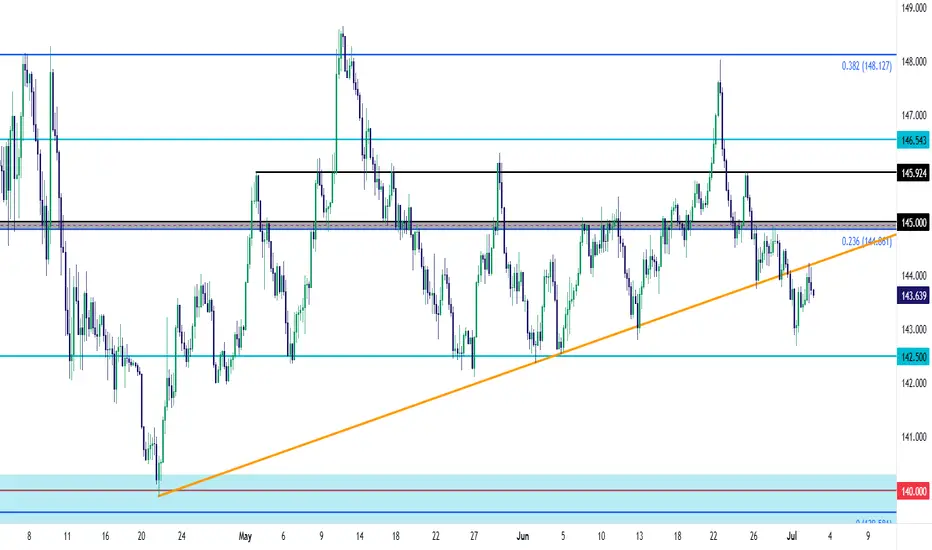
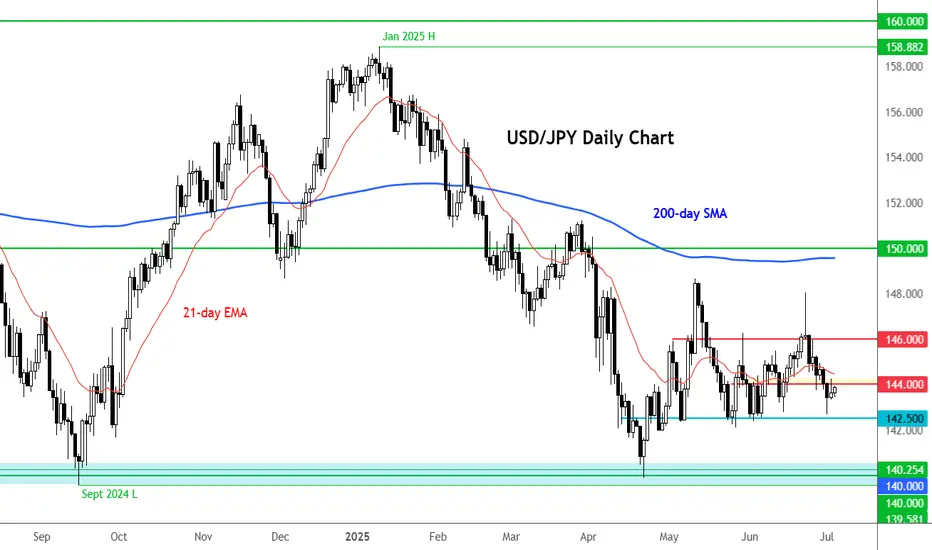
USD/JPY Trendline Now as ResistanceDespite the massive move of weakness in USD in Q2, USD/JPY has held up relatively well, especially over the past two months.
The 140.00 level held the lows in April and then it was the 142.50 level. The bullish trendline connecting those two points had some additional higher-low context.
But as looked at last week, the 145.00 zone was now set up as possible lower-high resistance and that last bounce from the trendline found sellers there, leading to a breach earlier this week.
Now that trendline is showing up as resistance potential. Notably bears were unable to stretch down for re-test of 142.50, and if we do end up with a larger short squeeze in the USD, the pair could become interesting on the long side again. For that, the 145.00 level remains key and buyers will first need to take that out to exhibit some element of control on a shorter-term basis. - js
what will be the next move for usdjpy price has been going down for the bast few days , so we will see the price going up for the next day
Trump threatens tariff on Japan as deadline looms, yen dipsThe Japanese yen is negative ground on Thursday. In the North American session, USD/JPY is trading at 144.06, up 0.47%.
The US and Japan are racing to reach a trade deal before a deadline of July 9. There are some serious roadblocks to a deal, including the current US tariff of 25% on Japanese cars and opening Japan's agricultural sector, particularly rice. President Trump has insisted that Japan import American-grown rice, but the Japanese government says that is unacceptable.
Japan's Economy Minister Ryosei Akawaza said earlier this week that Japan would not "sacrifice the agricultural sector", while Farm Minister Shinjiro Koizumi said that foreign rice imports would threaten Japan's food security.
It's a shortened week in the US due to the Fourth of July holiday on Friday. The US will release the June employment report on Thursday, with all eyes on nonfarm payrolls.
Nonfarm payrolls eased slightly in May to 137 thousand from 147 thousand and the downward trend is expected to continue, with a consensus of 110 thousand for June. This would mark the weakest pace of job growth since 2020, with the exception of a meltdown in job growth in Oct. 2024.
The Federal Reserve will also be monitoring the nonfarm payroll report. The US labor market has been weakening and the Fed is concerned that the jobs market could show a sharp deterioration. Currently, the most likely date for the next Fed rare cut is September, but a soft NFP reading south of 90 thousand would boost the case for a cut at the July 30 meeting.
The Fed has maintained a wait-and-see stance since Nov. 2024 but that is expected to change in the fourth quarter, where we could see up three rate cuts.
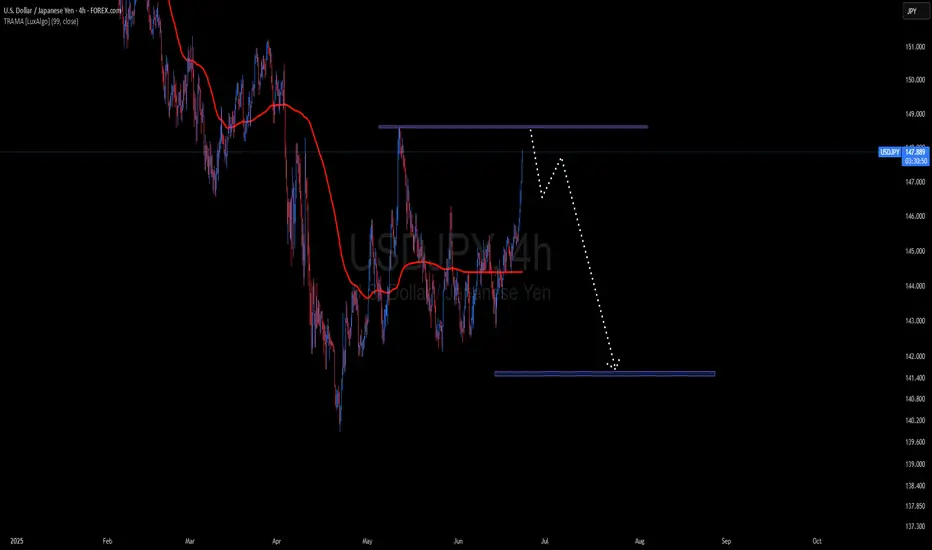
Usdjpy 4Hr chart Analaysis The USD/JPY pair appears to be forming a potential reversal pattern, suggesting a shift from bullish to bearish momentum. The key level of 148.55 is anticipated to act as a turning point, with price potentially heading down toward the 141.647 support area in the near term.
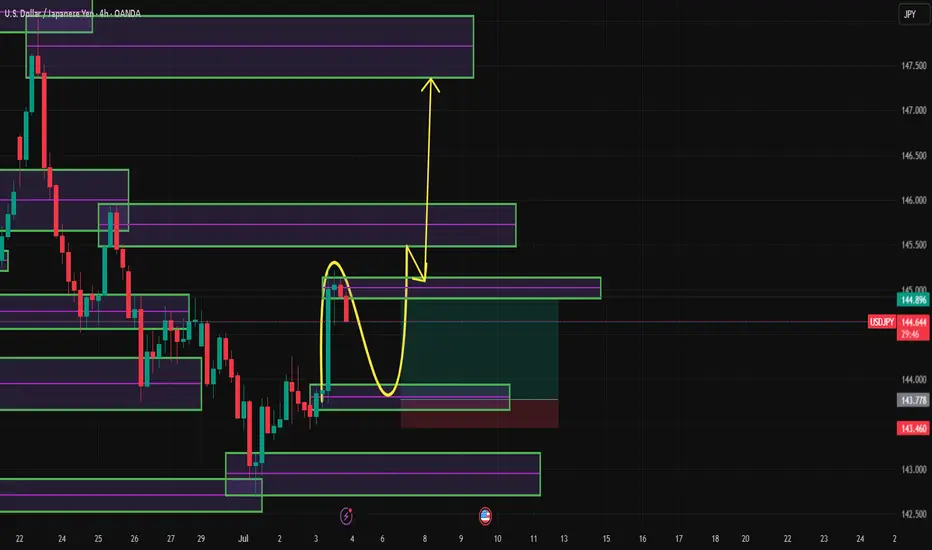
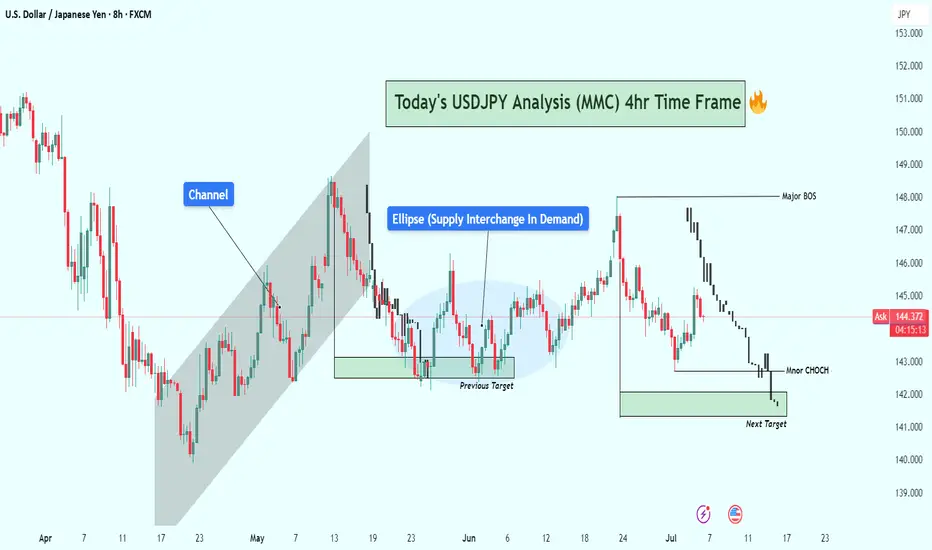
USDJPY 4-Hour Technical Analysis (Smart Money Concept Breakdown)📈 Overall Market Structure Overview:
The chart reflects a multi-phase Smart Money playbook, consisting of:
Bullish channel structure
Breakout followed by liquidity sweep
Supply zone flip to demand
Price mitigation and structure shift
Anticipated reaction zone for upcoming move
🔎 Phase-by-Phase Analysis:
🧱 1. Ascending Channel Formation
Price was moving upward in a controlled bullish ascending channel, suggesting institutional accumulation with planned distribution above highs.
The channel breakout was the first significant liquidity event, where early breakout traders were baited.
💧 2. Fakeout and Supply Interchange into Demand (Ellipse Zone)
Once the channel broke, price sharply reversed, retracing into a previous supply zone.
However, institutions defended this zone, flipping it into a demand area.
This behavior, marked with the blue ellipse, signals “Supply Interchange in Demand” – a core SMC concept.
Here, orders were absorbed
Liquidity was trapped below
A bullish push confirmed institutional intent
🎯 3. Previous Target Hit – Completion of Bullish Leg
Price made a strong rally from the demand zone, hitting the previous target near 147–148 zone.
This bullish leg created a Major Break of Structure (BOS) confirming bullish dominance at that phase.
⚠️ 4. Distribution Begins: Shift in Momentum
After reaching the Major BOS area, price failed to hold higher levels.
A decline followed, indicating distribution by smart money.
The reaction was sharp and consistent, creating lower highs, signaling weakness.
🔄 5. Minor CHoCH Formation – Early Reversal Signal
A Minor Change of Character (CHoCH) occurred around the 144.000–143.000 area.
This is a key transition, where smart money transitions from bullish intent to potential bearish delivery.
📦 6. Next Target Zone – Bullish POI (Point of Interest)
The chart identifies a next target demand zone around 141.800–141.200, marked in green.
This zone:
Holds unmitigated demand
Sits below a recent liquidity pool
Aligns with past support
This is where Smart Money could re-enter, offering a long opportunity if a bullish CHoCH or BOS forms from that zone.
📊 Trade Scenarios & Forecast:
🔻 Bearish Short-Term Play (Sell Setup):
If price respects current resistance (144.500–145), and a lower high forms:
Short entry opportunity
Target: 142.000–141.200 demand zone
Confirmation: Strong bearish candle, CHoCH below minor support
🔺 Bullish Reversal Play (Buy Setup):
At the demand zone:
Look for bullish reaction + CHoCH or BOS
Long entry potential
Target: Retest of 144.000 or even 147.000 if liquidity allows
🔐 Smart Money Tactics in Play:
Liquidity Engineering:
Price trapped both bulls (at highs) and bears (below ellipse zone)
Supply into Demand Flip:
A classic trap where supply becomes a launchpad for bullish delivery
Minor CHoCH:
Early signal of intent change
Next POI (Point of Interest):
Potential reaccumulation zone below major liquidity grab
🧠 Educational Takeaway:
This analysis illustrates:
Why breakouts are often traps without confirmation
How to identify real institutional zones
The role of CHoCH/BOS in planning ahead
Importance of waiting for price to come to your levels, not chasing
⚠️ Risk & Caution:
News catalysts can cause deviation from technical levels
Always use stop loss and proper risk management
SMC is about patience and precision, not prediction
✅ Summary:
USDJPY is showing early signs of a smart money distribution and a potential pullback toward demand.
Watch closely for confirmation at the key zone (141.800–141.200) before engaging long. Until then, short setups on rallies may be favorable.
Sell USDJPYFor the first time, I have done some fundamental analysis. Last time NFP release was on a Thursday due to Bank Holiday was July 2020 where the USD gained on the news release but later gave up the gains. I am expecting a pullback
USD/JPY and what’s expected from the NFP?The USD/JPY hasn't dropped like the other dollar crossed yet, but could we potentially see a clean break down below 142.50 support? Well, we will need to see a big miss on the NFP print for that to potentially happen.
The consensus is for a 110K increase in non-farm payrolls, but recent data has been less than convincing. The ADP private payrolls figure released yesterday registered its first decline in over a year, stoking concerns that today’s number might fall short of expectations — potentially even slipping below 100K.
On the unemployment front, a slight uptick to 4.3% is anticipated, up from 4.2%, while Average Hourly Earnings are seen rising 0.3% month-on-month vs. 0.4% increase the month before.
By Fawad Razaqzada, market analyst with FOREX.com
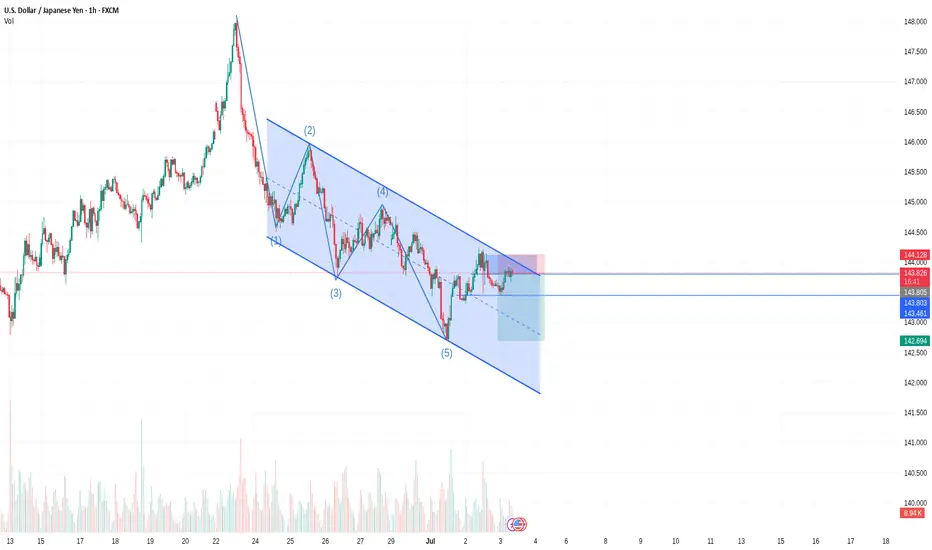
Potential Continue The Bearish Trend Of USD/JPYwe can see USD/JPY right now is on eliot wave cycle, and based trend line i make here there is so much potential for the price to down again if don't break the resistance area.
Fundamental Market Analysis for July 3, 2025 USDJPYEvent to pay attention to today:
15:30 EET. USD - Non-Farm Employment Change
15:30 EET. USD - Unemployment Rate
15:30 EET. USD - Unemployment Claims
17:00 EET. USD - ISM Services PMI
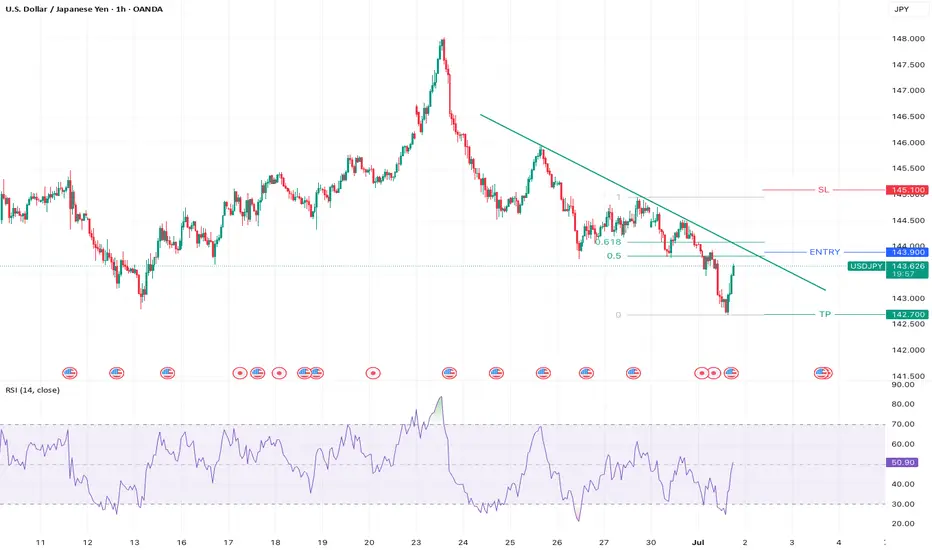
The Japanese Yen (JPY) traded with a slight positive bias against the bearish US Dollar (USD) during the Asian session on Thursday and remains near the near one-month peak reached earlier this week. Despite the Bank of Japan's (BoJ) hesitation to hike rates, investors seem convinced that the central bank will remain on the path of normalizing monetary policy amid rising inflation in Japan. This is a significant divergence from the stance of other major central banks (including the U.S. Federal Reserve (Fed)), which are leaning towards a softer approach, and is favorable for lower JPY yields.
Meanwhile, US President Donald Trump hinted at a possible end to trade talks with Japan, and also threatened new tariffs against Japan over its perceived reluctance to buy American-grown rice. This, along with the overall positive tone towards risk, is a headwind for the safe-haven yen. In addition, traders seem reluctant and prefer to take a wait-and-see approach ahead of today's release of the closely watched US Non-Farm Payrolls (NFP) report. The crucial data will play a key role in influencing the US Dollar (USD) and will give a significant boost to the USD/JPY pair.
Trade recommendation: BUY 144.00, SL 143.00, TP 145.40
USDJPY FXAN & Heikin Ashi exampleIn this video, I’ll be sharing my analysis of USDJPY, using FXAN's proprietary algo indicators with my unique Heikin Ashi strategy. I’ll walk you through the reasoning behind my trade setup and highlight key areas where I’m anticipating potential opportunities.
I’m always happy to receive any feedback.
Like, share and comment! ❤️
Thank you for watching my videos! 🙏

BUY USDJPYThe price drop on UJ has been wild however price is at a good support zone, we see the ABCD pattern by way of a bullish Fibonacci invasion setup hoping it will give good liquidity. Buy wisely.
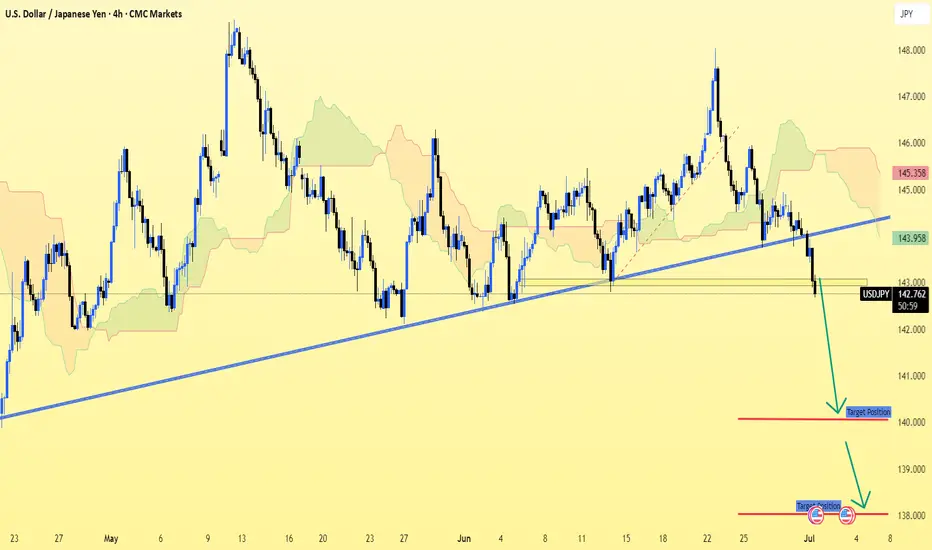
USD/JPY (4H timeframe) shows a clear break 0ut.USD/JPY (4H timeframe) shows a clear break below the ascending trendline and Ichimoku cloud support, suggesting a bearish continuation.
Key Bearish Targets (Based on the chart):
1. First Target Zone:
📉 140.88
This level aligns with previous structure support and is marked as the initial target on the chart.
2. Second Target Zone:
📉 138.85 – 139.00
This is a deeper support zone and is indicated as the next bearish leg if price momentum continues downward.
Summary:
Current Price: ~142.74
Trend: Bearish (Breakdown from trendline + Ichimoku bearish signals)
Target 1: 140.88
Target 2: 138.85
Let me know if you want SL (stop-loss) or entry suggestions.
USDJPY TRADE USDJPY has dropped. We're clear to the downside.
All we need to do is to manage our trade to maximize profits.
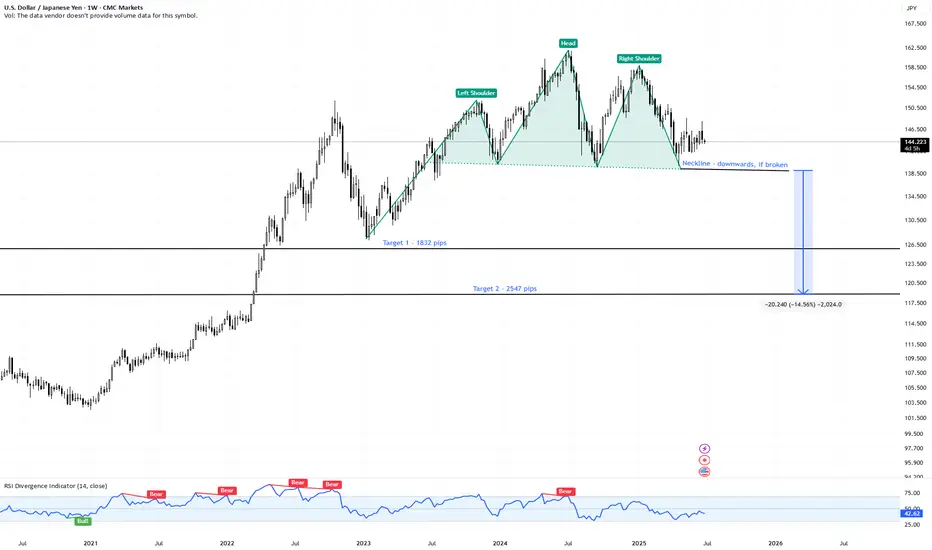
USDJPY | Massive Head & Shoulders Top – 2500+ Pips | Weekly📍 Pair: FX:USDJPY (U.S. Dollar / Japanese Yen)
📆 Timeframe: 1W (Weekly)
📉 Price: 144.22
📊 Pattern: Head & Shoulders (macro top)
🔍 Technical Setup:
USDJPY has formed a textbook Head & Shoulders pattern on the weekly chart, suggesting a potential multi-thousand pip reversal if the neckline fails.
🟩 Left Shoulder – Head – Right Shoulder structure is clear
🔻 Neckline sits near 137.00 – a major support zone
🔺 Pattern took over a year to form — signals significant macro exhaustion
🧠 Trade Plan & Targets:
❗️ Trigger: Weekly close below 137.00 (neckline breakdown)
⛔️ Invalidation: Close back above 151.00 (right shoulder high)
🎯 Target 1: 126.90
→ 📉 Move: -1,832 pips
🎯 Target 2: 118.80
→ 📉 Move: -2,547 pips
🔭 Both targets are based on measured move logic from the height of the head to the neckline, projected downward.
⚠️ Key Observations:
Sideways price action forming the right shoulder = distribution zone
Breakdown would shift trend from bullish to bearish on a long-term scale
Potential for carry trade unwind and safe-haven yen demand if macro tensions rise
💬 Are we on the verge of a major USD reversal vs the yen?
📌 Watch for a confirmed weekly break below 137.00 — this setup could define Q3–Q4.
#USDJPY #Forex #HeadAndShoulders #JPYStrength #TrendReversal #TechnicalSetup #TargetTraders
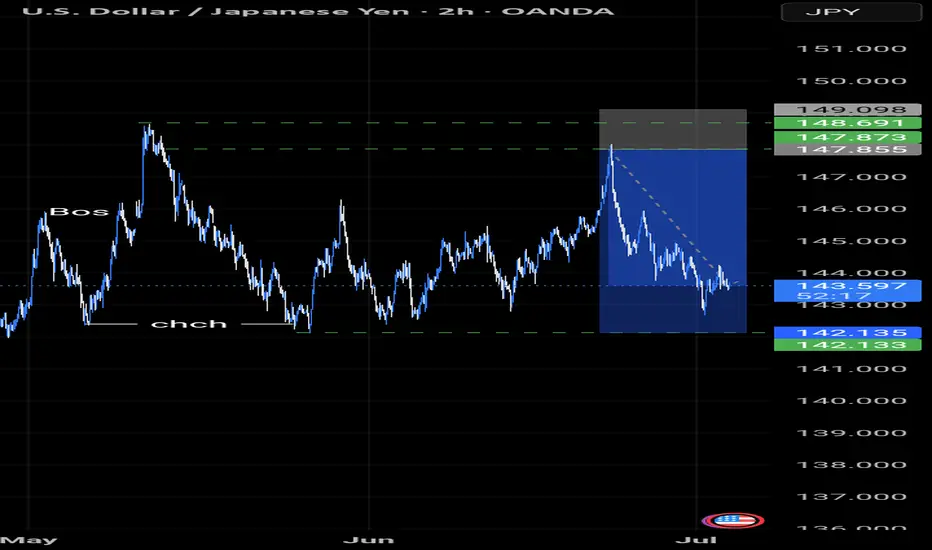
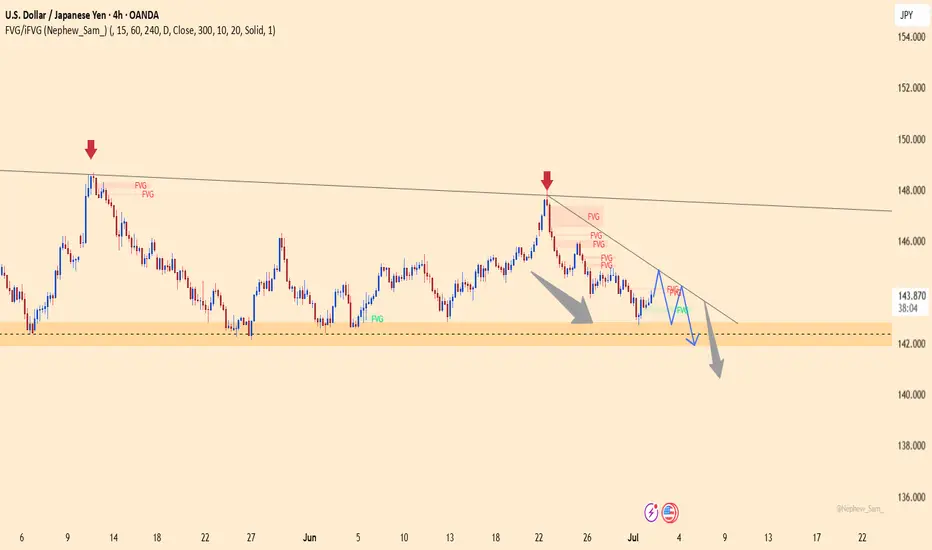
USDJPY: Bearish Trend Remains in ControlUSDJPY continues to follow a clear downtrend on the H4 chart, respecting a descending trendline and forming consistent lower highs. The strong rejection at 144.800 and the presence of multiple FVGs further reinforce the bearish structure.
Price is currently retracing to test the FVG zone. If rejection occurs here, the downtrend could resume towards the 141.900 support level.
Trade Setup:
Sell near 144.700
TP: 141.900
SL: above 145.300
Supporting News:
"Risk-on" sentiment is back after strong manufacturing data from China and rising expectations that U.S. interest rates may soon peak, weakening the USD against the JPY.
Are you watching for a short setup like I am?
USDJPY - placed reasonable high? What's next??#USDJPY.. market placed 144.20-25 day high in yesterday and that is a very reasonable high.
If market hold it in that case we can expect drop from here.
Don't be lazy here.
Good luck
Trade wisely