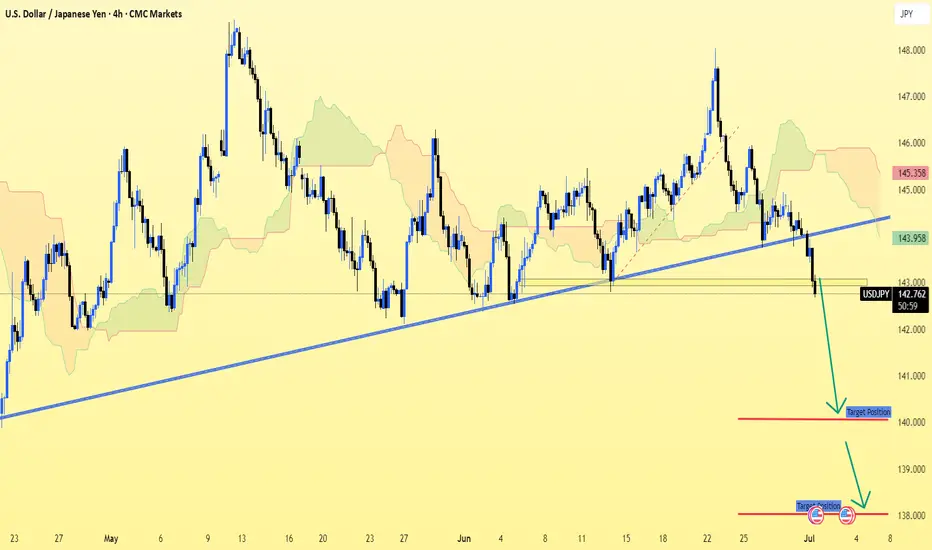
USD/JPY (4H timeframe) shows a clear break 0ut.USD/JPY (4H timeframe) shows a clear break below the ascending trendline and Ichimoku cloud support, suggesting a bearish continuation.
Key Bearish Targets (Based on the chart):
1. First Target Zone:
📉 140.88
This level aligns with previous structure support and is marked as the initial target on the chart.
2. Second Target Zone:
📉 138.85 – 139.00
This is a deeper support zone and is indicated as the next bearish leg if price momentum continues downward.
Summary:
Current Price: ~142.74
Trend: Bearish (Breakdown from trendline + Ichimoku bearish signals)
Target 1: 140.88
Target 2: 138.85
Let me know if you want SL (stop-loss) or entry suggestions.
JPYUSD trade ideas
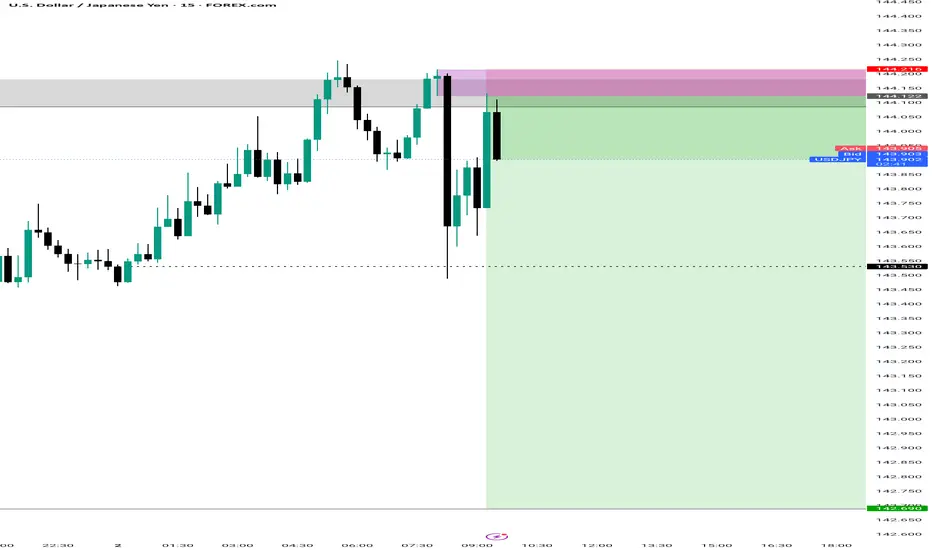
USDJPY 15M BULLS START TO SHOW THERE MUSCLES :))))As we can see we have been rejected @ a VERY STRONG SUPPORT AREA, and small time frame give us good BULLISH FORMATION (Creating LL/HL with DIVERGANCE)
Im looking to hold at list 1 lot, as i believe this could be a bottom for a START OF MASSIVE BULL RUN (ONLY TIME WILL TELL)
As usual will update everything here
Thanks
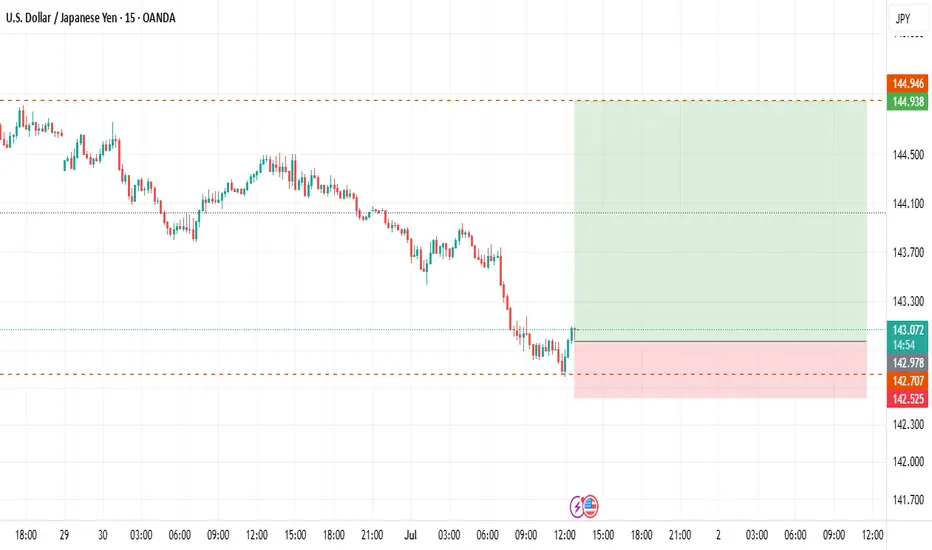
Strong bearish candles indicate seller dominance. No bullish structure has formed; instead, it looks like a **continuation of the bearish trend**.
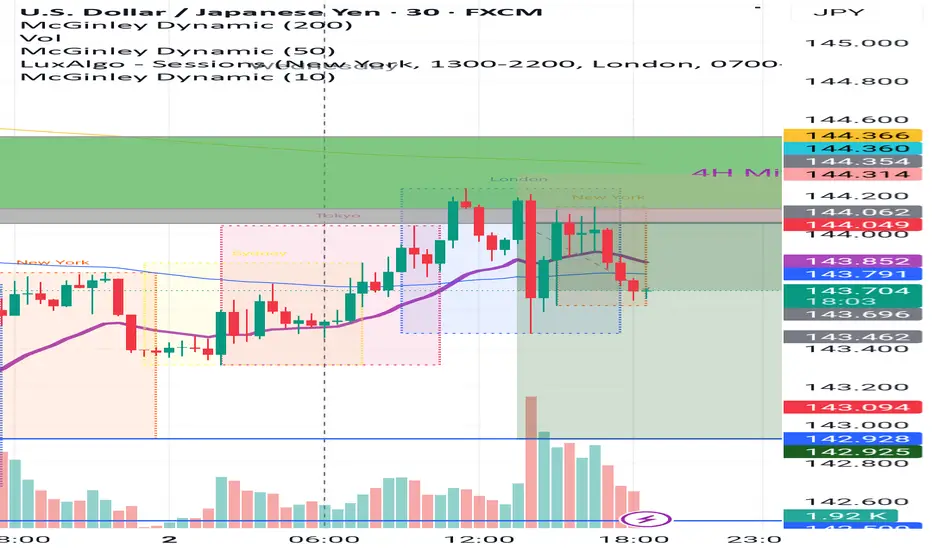
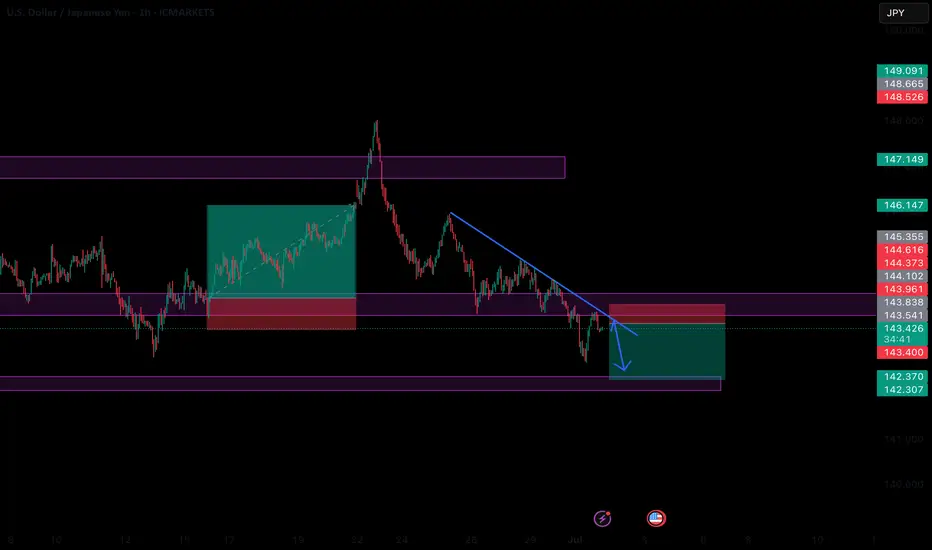
4H ORDER BLOCK UNMITIGATED STRATEGY📉 USDJPY – Short Bias Below Supply Zone (4H Mitigated OB Bearish)
Timeframe: 30m
Bias: Bearish
Type: Intraday / Swing Setup
📌 Key Observations:
Price recently tapped into a 4H Mitigated Order Block (OB) around 144.360 – 144.049 and showed rejection with strong bearish wicks.
This zone aligns with a previous supply area and is marked by confluence from the McGinley Dynamic 50 & 200 EMA.
A short was executed at 144.162, with a stop above the OB at 144.476.
Target is set at 142.500, near previous demand structure and liquidity sweep.
🧠 Trade Rationale:
The 4H bearish OB was mitigated during the Tokyo session with low momentum, followed by a London and NY session rejection.
The pair formed a lower high and is now trading below key moving averages, indicating a possible continuation to the downside.
Multiple sessions show rejection from the same OB area – reinforcing its strength.
Increased volume on the down candle confirms institutional presence.
🎯 Trade Details:
Entry: 144.162
Stop Loss: 144.476
Take Profit: 142.500
RRR: 5.9:1
Position Size: 228,000
Current PnL: +606.12 USD (Floating)
🔍 Next Steps:
Monitor for any signs of bullish order blocks forming around 143.200 or 142.900 as partial TP zones.
Move SL to breakeven once price breaks 143.400.
USDJPY BUY I'm Buying USDJPY from my marked zone andI hope market should react from that zone. Use a proper risk management
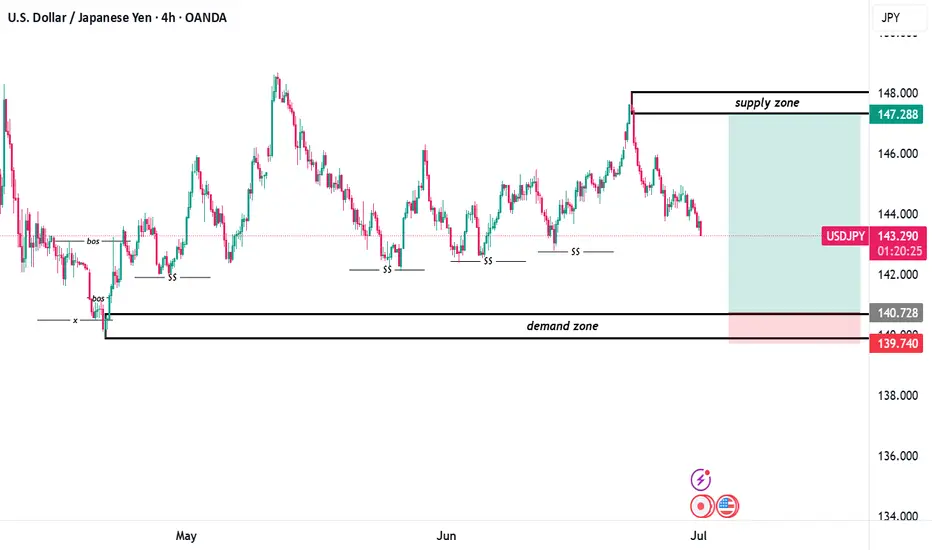
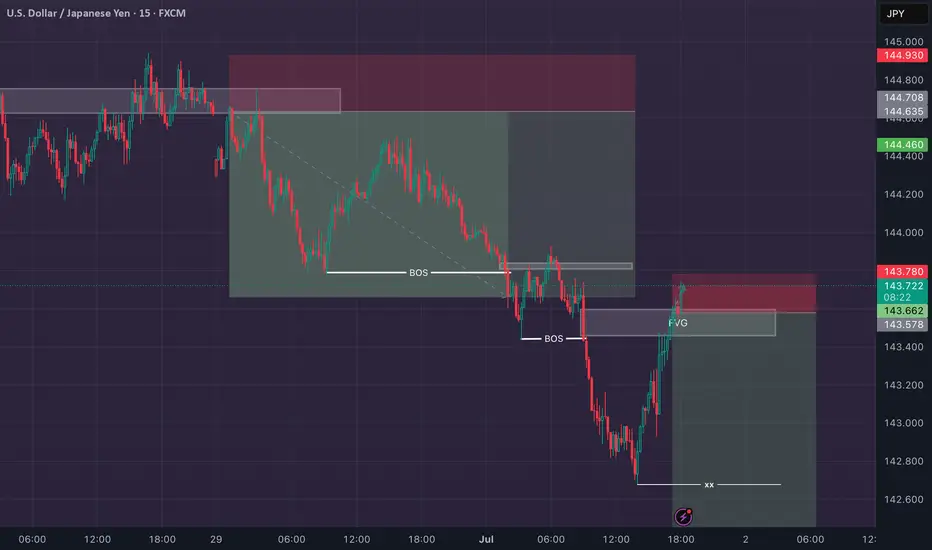
demand zone spotted... LET THE HUNTING BEGIN!!!📉 USD/JPY 4H Analysis – Demand Zone Revisit Expected
The pair is currently in a retracement phase after tapping into a higher-timeframe supply zone. Let's break down the structure and reasoning behind this setup:
1. Market Structure & Smart Money Footprints
• The chart begins with a clear Break of Structure (BOS) to the upside from a prior low, confirming a bullish shift.
• This upward move was supported by multiple Short-Term Supports (SS) that were respected throughout the bullish trend.
• Price has maintained a general uptrend structure, making higher lows and higher highs, but is now showing signs of a correction.
2. Supply and Demand Zones
• Supply Zone (147.288 – 148.000):
This is the last bearish zone before a sharp sell-off, indicating institutional selling pressure. Price tapped into this zone and has since reacted bearishly — a likely area where smart money took profits or initiated shorts.
• Demand Zone (139.740 – 140.728):
Marked from the origin of the bullish impulse and supported by a previous BOS, this is a critical area where institutional buying may resume. It also aligns with a liquidity sweep and previously unmitigated demand — a key confluence zone for potential longs.
3. Current Market Behavior
• Price is currently declining toward the demand zone, and based on structure, this is likely a healthy retracement.
• The chart suggests a buy limit setup at demand, with a tight stop just below 139.740 and a target near the previous supply reaction.
________________________________________
✅ Trade Idea
• Bias: Bullish from demand
• Entry: Around 140.728
• Stop Loss: Below 139.740
• Take Profit: 147.288 (just before the supply zone)
• Risk-to-Reward: Approx. 1:4
This setup assumes price will respect demand and continue the bullish structure, especially after multiple SS validations and a strong institutional reaction in the past.
🧠 Final Thoughts
This setup reflects classic Smart Money Concept principles:
• Structure shift via BOS
• Entry at unmitigated demand
• Exit just before major supply
• Strong confluence from price history and liquidity sweep zones
Wait for confirmation in the demand zone — a bullish engulfing, internal BOS, or FVG fill could give additional confidence to enter long.
NB: x represents previous liquidity sweep
$$ represents liquidity
bos represents break of structure
CHEERS TO WEALTH!!!
USDJPY SELLBy utilizing levels, historical patterns, , we can formulate a hypothesis that the market might follow a similar trajectory if bearish sentiment prevails.
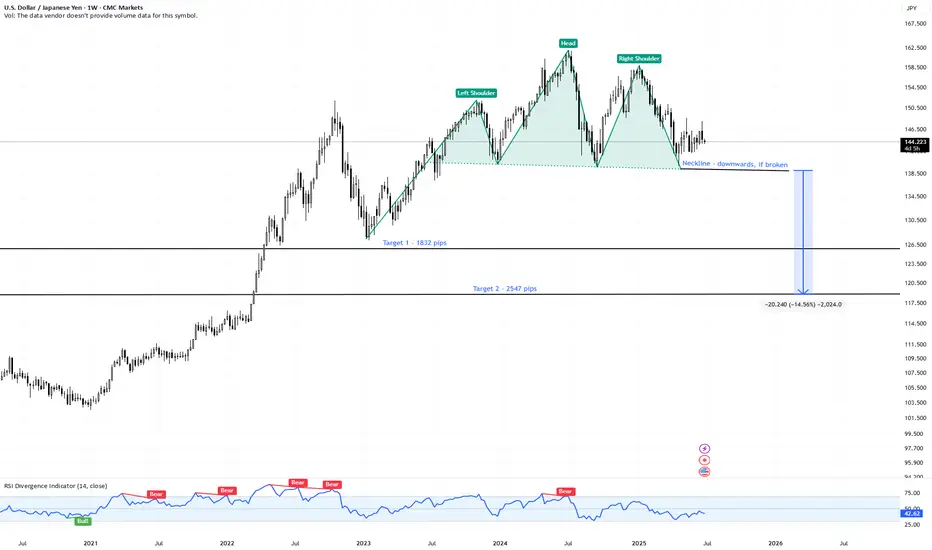
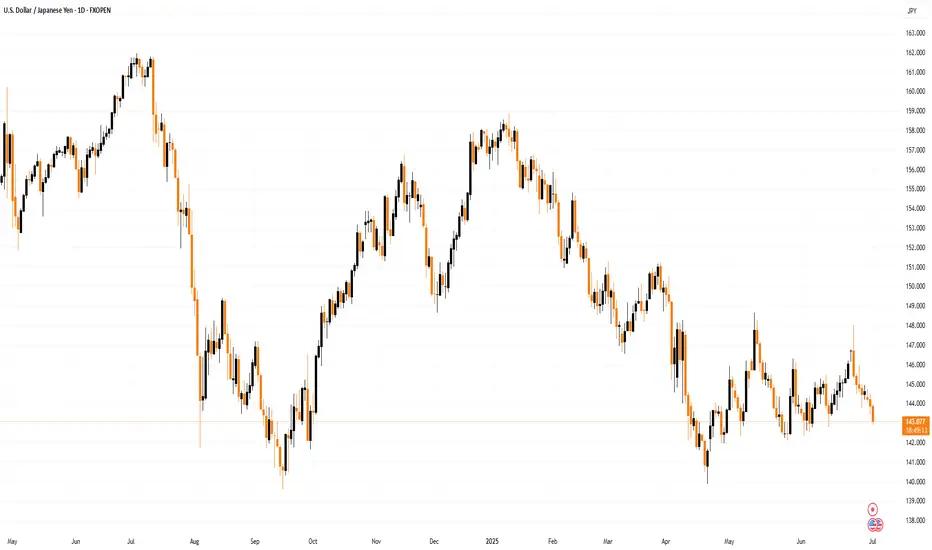
USDJPY | Massive Head & Shoulders Top – 2500+ Pips | Weekly📍 Pair: FX:USDJPY (U.S. Dollar / Japanese Yen)
📆 Timeframe: 1W (Weekly)
📉 Price: 144.22
📊 Pattern: Head & Shoulders (macro top)
🔍 Technical Setup:
USDJPY has formed a textbook Head & Shoulders pattern on the weekly chart, suggesting a potential multi-thousand pip reversal if the neckline fails.
🟩 Left Shoulder – Head – Right Shoulder structure is clear
🔻 Neckline sits near 137.00 – a major support zone
🔺 Pattern took over a year to form — signals significant macro exhaustion
🧠 Trade Plan & Targets:
❗️ Trigger: Weekly close below 137.00 (neckline breakdown)
⛔️ Invalidation: Close back above 151.00 (right shoulder high)
🎯 Target 1: 126.90
→ 📉 Move: -1,832 pips
🎯 Target 2: 118.80
→ 📉 Move: -2,547 pips
🔭 Both targets are based on measured move logic from the height of the head to the neckline, projected downward.
⚠️ Key Observations:
Sideways price action forming the right shoulder = distribution zone
Breakdown would shift trend from bullish to bearish on a long-term scale
Potential for carry trade unwind and safe-haven yen demand if macro tensions rise
💬 Are we on the verge of a major USD reversal vs the yen?
📌 Watch for a confirmed weekly break below 137.00 — this setup could define Q3–Q4.
#USDJPY #Forex #HeadAndShoulders #JPYStrength #TrendReversal #TechnicalSetup #TargetTraders
Wednesday 2 July: USD to recover short term? The general market mood remains positive, and particularly sentiment for the USD remains in the douldrums. All of a sudden, there is talk of three FED cuts by the end of the year (although I think that's a bit ambitious). A soft NFP report could cement multi year USD weakness.
But pre (Thursday's) NFP I suspect we could see some dollar profit taking.
Currently, I see 'risk on' short JPY (or CHF) as very viable, the risk to a trade would be USD liquidity if the dollar continues to weaken.
Recommended trade: AUD JPY long
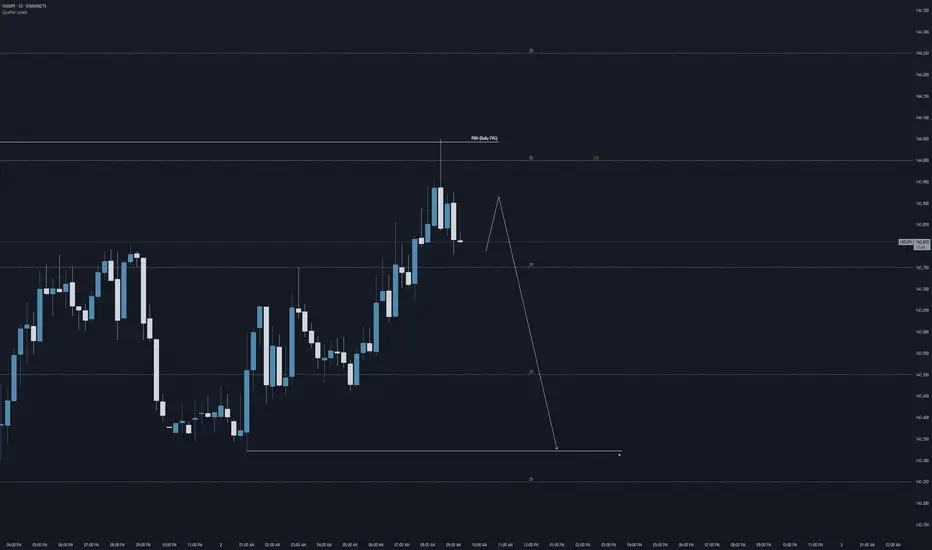
UJ, will we see a bearish leg today?USDJPY looks quite interesting after the wick rejection from key level 144.000. Will this area be respected and give us a bearish leg. Hmm, let's see how price unfolds for this pair today.
Regards,
Aman | SMC Wolf FX
1-1 student onboarding is currently open (website in my signature & profile)
DeGRAM | USDJPY correction 📊 Technical Analysis
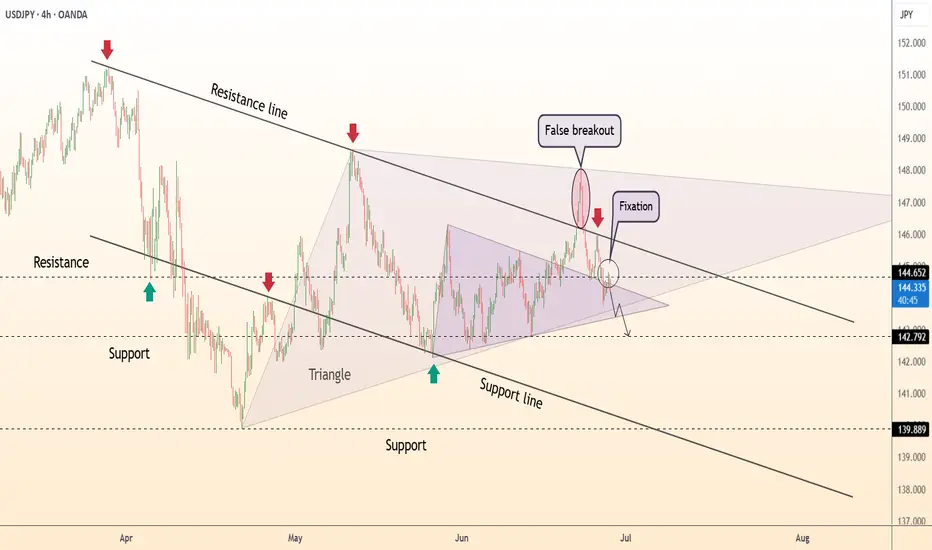
● Monday's rebound above the 4-month falling trend line was quickly repelled, leaving a “false breakdown” candle; price has returned under the line and is now retesting it as resistance around 144.65.
● The rebound also stopped at the top of the triangle and a small bearish flag formed; the height of the pattern points to the 142.80 support band and the broader channel to 139.90 as continuation.
💡 Fundamental analysis
● Softer U.S. core GDP data drove 2-year Treasury yields to two-week lows, reducing the rate differential that favored the dollar.
Meanwhile, Japanese officials again warned that they “do not rule out any measures” against excessive yen weakening, raising the risk of intervention and discouraging new long USD/JPY positions.
Summary
Short 144.4 - 144.65; break below 143.8 targets 142.8 -> 139.9. Bearish view loses strength with a 4-hour close above 145.30.
-------------------
Share your opinion in the comments and support the idea with like. Thanks for your support!
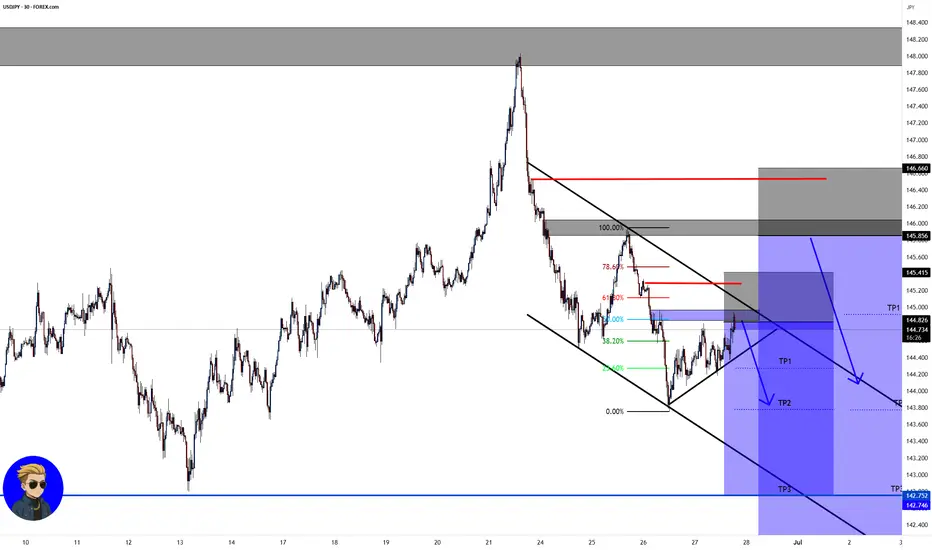
USD/JPY💰Symbol: { USD/JPY }
🟩Price: { 144.790 & 145.856 }
🟥Stop: { 145.415 & 146.660 }
1️⃣profit: { 144.279 & 144.916 }
2️⃣profit: { 143.780 & 143.780 }
3️⃣profit: { 142.746 & 142.746 }
4️⃣profit: { 142.139 }
📊Check your chart before entering.
🚨Check before use to make sure there is no important news.🚨
Waiting to sell USDJPYWait for price to retest the trendline/resisitence zone then watch for an engulfing bearish candle on 15min or 30 minute chart
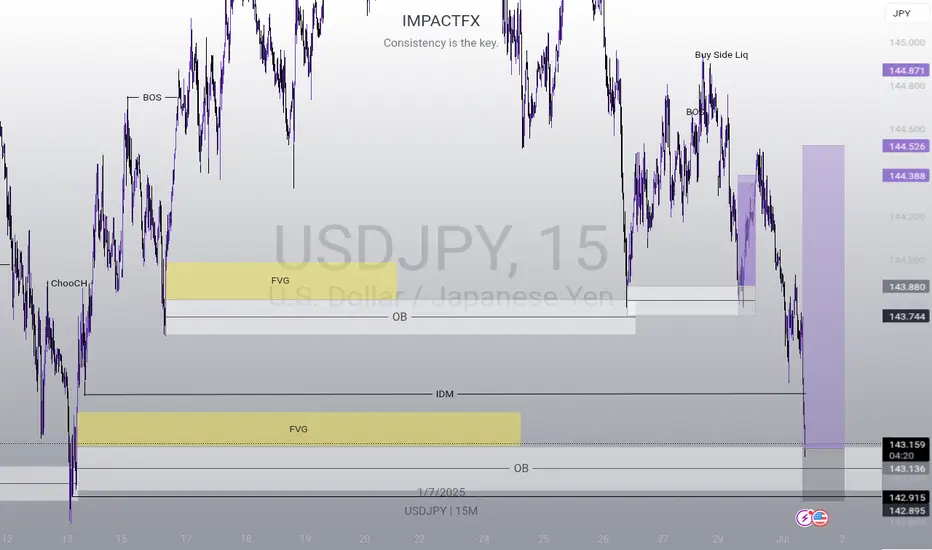
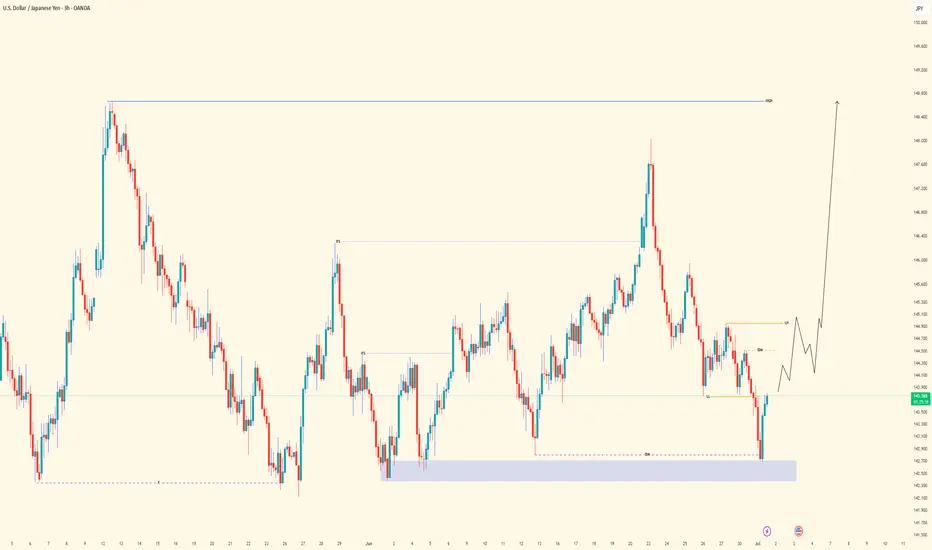
USDJPY| - Weekky OutlookBias: Bullish
HTF Overview (4H):
Price has shown bullish intent by breaching a major internal high and taking out significant sell-side liquidity (SSL) before mitigating the 4H order block below. This suggests a bullish narrative is forming, even though the 4H swing high hasn’t been taken yet.
LTF Confirmation (30M):
Currently showing bearish momentum. I’ll wait for a clean CHoCH to confirm shift in intent. Once price sweeps liquidity and mitigates a valid 30M OB, I’ll look for entries.
Entry Zone:
After liquidity sweep + OB mitigation on 30M (or refinement on 5M), I’ll execute the setup.
Targets:
• Scalp: 5M structure highs
• Short-Term Hold: 30M structure highs
• Extended Hold: 4H structure highs (if price action is strong)
Mindset Note:
Structure tells the story, but price action confirms whether it’s worth riding. Even when structure looks awkward, respect is often still given—so stay fluid, but focused.
Bless Trading!
usdjpy will fallguys this isnt promising but i guess with proper risk management and flexible stop loss you can take this trade tbh
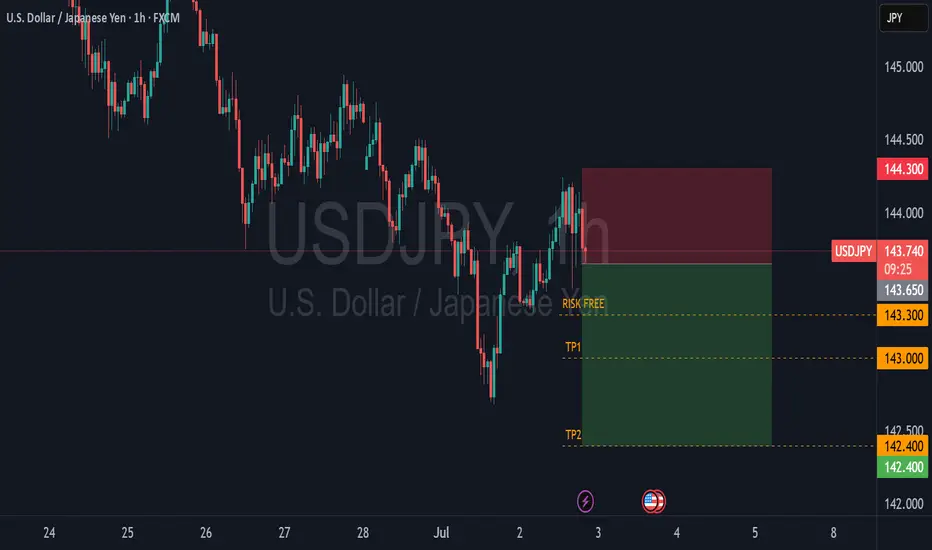
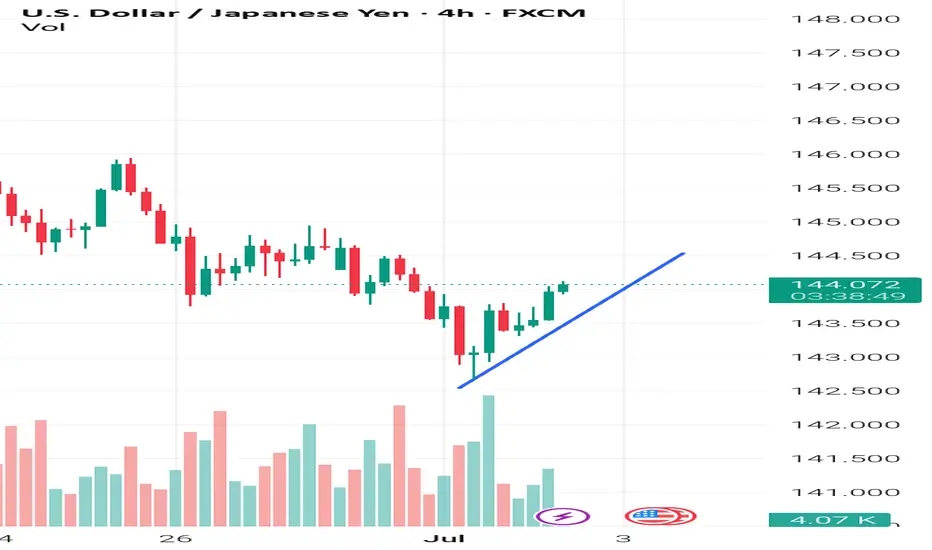
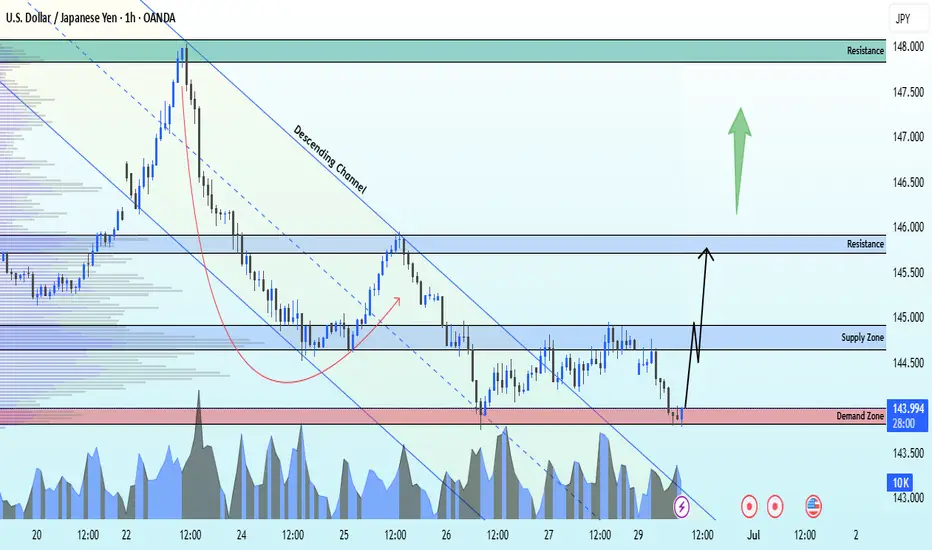
USDJPY Ascending channel breakout buy strong from demand zone📈 USDJPY Bullish Breakout Alert! 🚀
USDJPY has officially broken out of the descending channel from the 143.800 demand zone — showing strong bullish momentum on the 1H time frame! 🔥
🎯 Technical Targets:
1st Target: 145.000 – Supply Zone 💥
2nd Target: 146.000 – Key Resistance
3rd Target: 148.000 – Major Resistance Level
Momentum is building — bulls are in control! 🐂
👇 Like, Follow & Comment your thoughts below!
💬 Join our trading community for more real-time updates and analysis!
#USDJPY #ForexSignals #PriceAction #BreakoutTrade
#LiviaTrades 😜
Quantitative Trading Models in Forex: A Deep DiveQuantitative Trading Models in Forex: A Deep Dive
Quantitative trading in forex harnesses advanced algorithms and statistical models to decode market dynamics, offering traders a sophisticated approach to currency trading. This article delves into the various quantitative trading models, their implementation, and their challenges, providing insights for traders looking to navigate the forex market with a data-driven approach.
Understanding Quantitative Trading in Forex
Quantitative trading, also known as quant trading, in the forex market involves using sophisticated quantitative trading systems that leverage complex mathematical and statistical methods to analyse market data and execute trades. These systems are designed to identify patterns, trends, and potential opportunities in currency movements that might be invisible to the naked eye.
At the heart of these systems are quantitative trading strategies and models, which are algorithmic procedures developed to determine market behaviour and make informed decisions. These strategies incorporate a variety of approaches, from historical data analysis to predictive modelling, which should ensure a comprehensive assessment of market dynamics. Notably, in quantitative trading, Python and similar data-oriented programming languages are often used to build models.
In essence, quantitative systems help decipher the intricate relationships between different currency pairs, economic indicators, and global events, potentially enabling traders to execute trades with higher precision and efficiency.
Key Types of Quantitative Models
Quantitative trading, spanning diverse markets such as forex, stocks, and cryptocurrencies*, utilises complex quantitative trading algorithms to make informed decisions. While it's prominently applied in quantitative stock trading, its principles and models are particularly significant in the forex market. These models are underpinned by quantitative analysis, derivative modelling, and trading strategies, which involve mathematical analysis of market movements and risk assessment to potentially optimise trading outcomes.
Trend Following Models
Trend-following systems are designed to identify and capitalise on market trends. Using historical price data, they may determine the direction and strength of market movements, helping traders to align themselves with the prevailing upward or downward trend. Indicators like the Average Directional Index or Parabolic SAR can assist in developing trend-following models.
Mean Reversion Models
Operating on the principle that prices eventually move back towards their mean or average, mean reversion systems look for overextended price movements in the forex market. Traders use mean reversion strategies to determine when a currency pair is likely to revert to its historical average.
High-Frequency Trading (HFT) Models
Involving the execution of a large number of orders at breakneck speeds, HFT models are used to capitalise on tiny price movements. They’re less about determining market direction and more about exploiting market inefficiencies at micro-level time frames.
Sentiment Analysis Models
These models analyse market sentiment data, such as news headlines, social media buzz, and economic reports, to gauge the market's mood. This information can be pivotal in defining short-term movements in the forex market, though this model is becoming increasingly popular for quantitative trading in crypto*.
Machine Learning Models
These systems continuously learn and adapt to new market data by incorporating AI and machine learning, identifying complex patterns and relationships that might elude traditional models. They are particularly adept at processing large volumes of data and making predictive analyses.
Hypothesis-Based Models
These models test specific hypotheses about market behaviour. For example, a theory might posit that certain economic indicators lead to predictable responses in currency markets. They’re then backtested and refined based on historical data to validate or refute the hypotheses.
Each model offers a unique lens through which forex traders can analyse the market, offering diverse approaches to tackle the complexities of currency trading.
Quantitative vs Algorithmic Trading
While quant and algorithmic trading are often used interchangeably and do overlap, there are notable differences between the two approaches.
Algorithmic Trading
Focus: Emphasises automating processes, often using technical indicators for decision-making.
Methodology: Relies on predefined rules based on historical data, often without the depth of quantitative analysis.
Execution: Prioritises automated execution of trades, often at high speed.
Application: Used widely for efficiency in executing repetitive, rule-based tasks.
Quantitative Trading
Focus: Utilises advanced mathematical and statistical models to determine market movements.
Methodology: Involves complex computations and data analysis and often incorporates economic theories.
Execution: May or may not automate trade execution; focuses on strategy formulation.
Application: Common in risk management and strategic trade planning.
Implementation and Challenges
Implementing quantitative models in forex begins with the development of a robust strategy involving the selection of appropriate models and algorithms. This phase includes rigorous backtesting against historical data to validate their effectiveness. Following this, traders often engage in forward testing in live market conditions to evaluate real-world performance.
Challenges in this realm are multifaceted. Key among them is the quality and relevance of the data used. Models can be rendered ineffective if based on inaccurate or outdated data. Overfitting remains a significant concern, where systems too closely tailored to historical data may fail to adapt to evolving market dynamics. Another challenge is the constant need to monitor and update models to keep pace with market changes, requiring a blend of technical expertise and market acumen.
The Bottom Line
In this deep dive into quantitative trading in forex, we've uncovered the potency of diverse models, each tailored to navigate the complex currency markets with precision. These strategies, rooted in data-driven analysis, may offer traders an edge in decision-making.
*Important: At FXOpen UK, Cryptocurrency trading via CFDs is only available to our Professional clients. They are not available for trading by Retail clients. To find out more information about how this may affect you, please get in touch with our team.
This article represents the opinion of the Companies operating under the FXOpen brand only. It is not to be construed as an offer, solicitation, or recommendation with respect to products and services provided by the Companies operating under the FXOpen brand, nor is it to be considered financial advice.
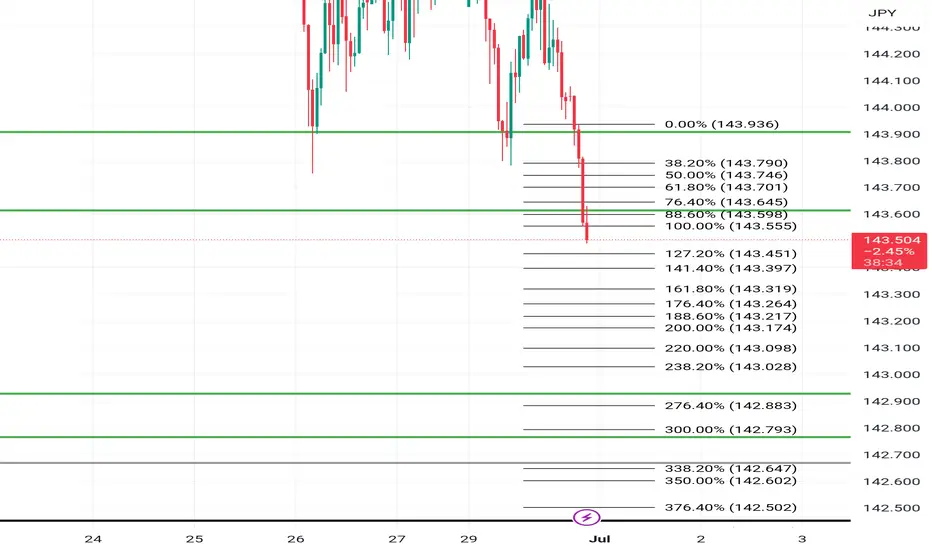
Short sell nowSell this pair now support has been broken which is the green lines on top... which price has pullback too sell now and take profits at the orange lines on. The bottom 300 fib level which is the next level of support where a major reversal is where it initially sold from in the past... look left and you will see
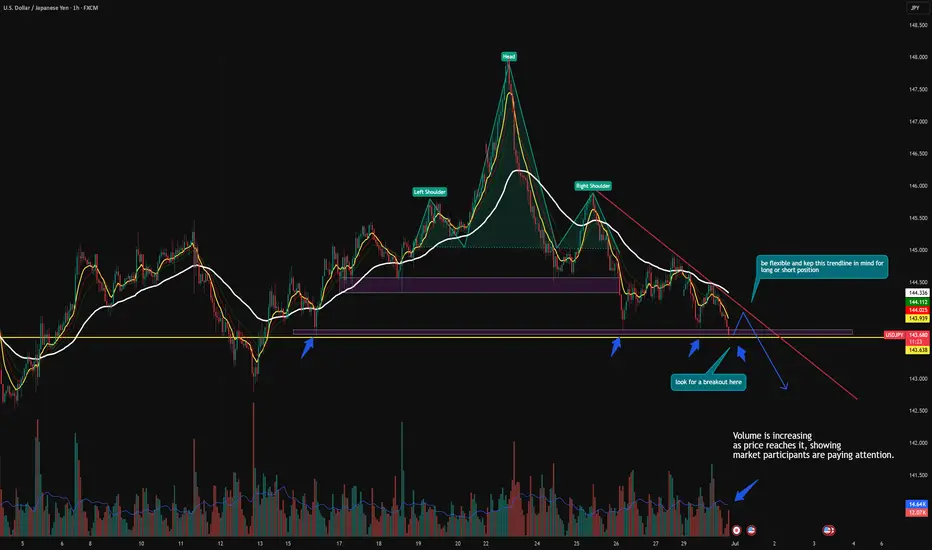
USD/JPY at a key support level tested multiple times🔻 USDJPY Sitting at Critical Support – Decision Point Ahead
USDJPY is currently hovering around the 143.60–143.65 zone — a major support level that has held multiple times in the past.
🔍 Price just completed a clean Head & Shoulders breakdown, and this zone marks the neckline retest area. We're now at a make-or-break point:
Break Below 143.60: Confirms bearish continuation, opens downside toward 143.00 → 142.20
Hold Above 143.60: Could lead to a short squeeze back to 144.20–144.50 zone
📊 Volume is rising as we test this key level — suggesting that big players are stepping in.
Trend remains bearish overall with price trading below the EMAs and rejecting trendline resistance.
⚠️ This is not the place to guess — wait for confirmation. A strong candle close below or a fakeout rejection will show the path.
Trade smart. Wait for the market to speak. No bias, just price action. 🧠
USDJPY SHORT Market structure bearish on HTFs 3
Entry at Daily AOi
Weekly Rejection at AOi
Daily Rejection at AOi
Daily EMA retest
Previous Structure point Daily
Around Psychological Level 145.000
H4 EMA retest
H4 Candlestick rejection
H4 Head and Shoulder Pattern, Retest of the neckline
Levels 3.56
Entry 95%
DUE TO H4 I WILL BE GOING 1/2 A % RISK TO SEE IF MY EDGE WILL WORK
REMEMBER : Trading is a Game Of Probability
: Manage Your Risk
: Be Patient
: Every Moment Is Unique
: Rinse, Wash, Repeat!
: Christ is King.
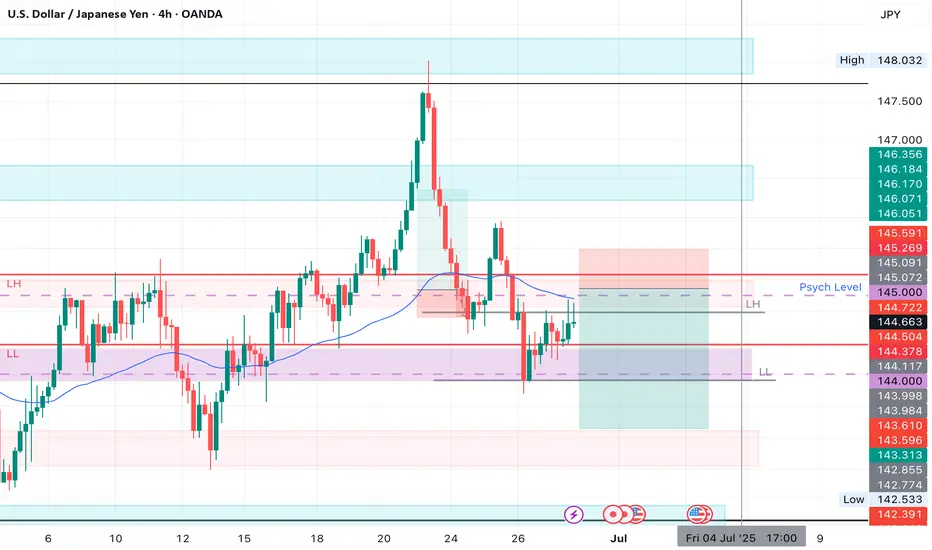
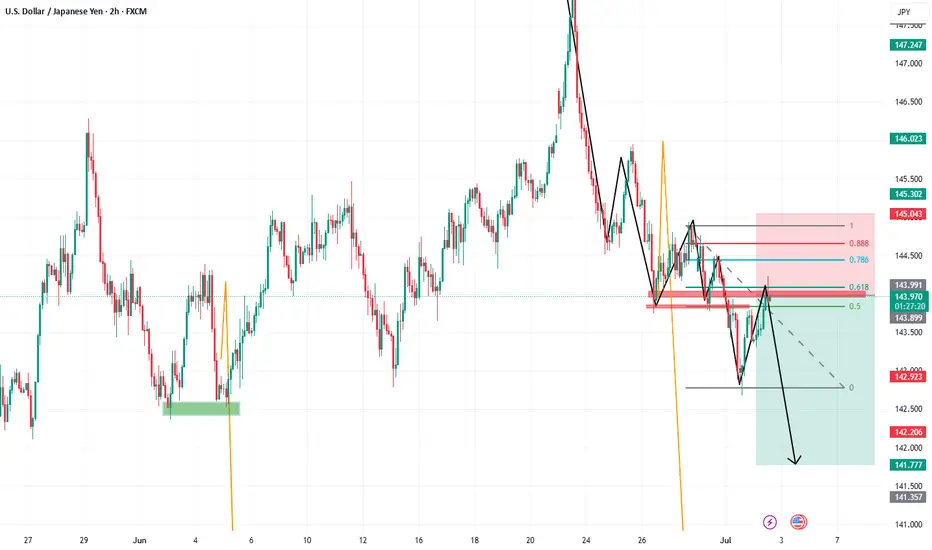
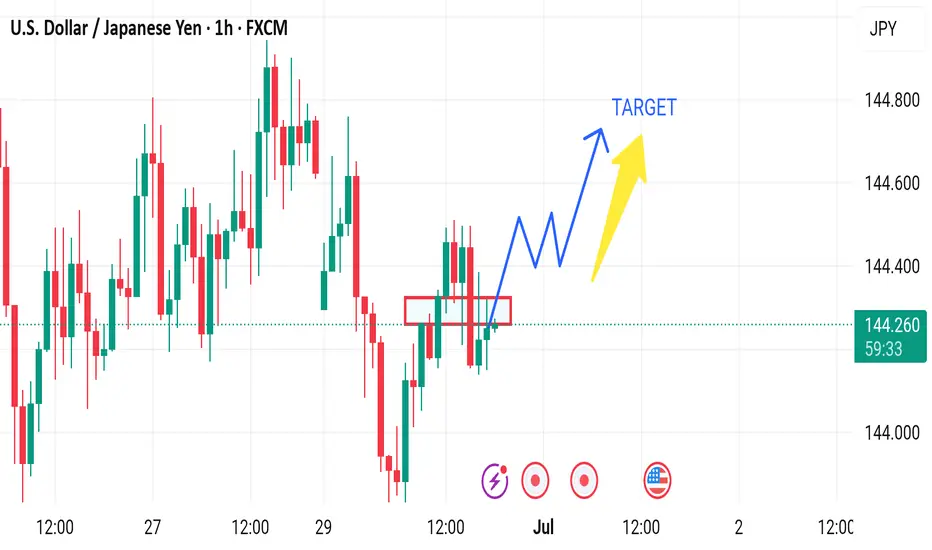
Market next move 🔀 Disruption Analysis – Bearish Alternative Scenario
While the current setup points to a bullish continuation above the support zone (around 144.10–144.20) with a projected target near 144.60, here’s how a bearish disruption could unfold instead:
---
🔻 Bearish Disruption Possibility:
1. Failed Breakout / Bull Trap:
Price may fake a move upward to trap breakout buyers near 144.40–144.50, then sharply reverse.
This would indicate a false breakout and potential reversal setup.
2. Rejection at Resistance:
Repeated failure to close above 144.40 may signal exhaustion.
Bearish divergence could form on momentum indicators (like RSI) as price rises.
3. Break Below Support Area:
A decisive break below the red support zone (around 144.10) may shift momentum bearish.
That would confirm a lower high and suggest downside continuation.
4. Next Bearish Target:
Initial support lies at 143.85, with further potential drop toward 143.60.
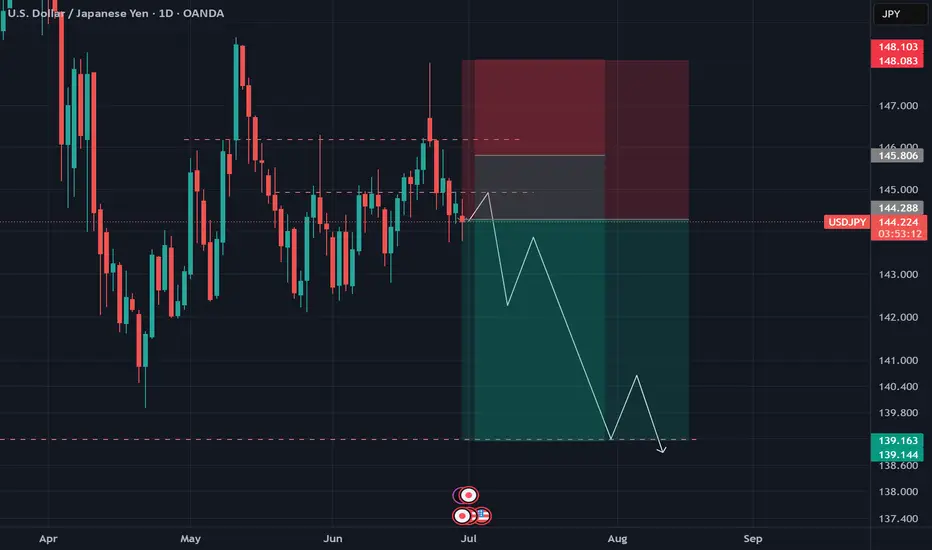
USD/JPY Analysis – June 29, 2025
🚨 Don’t miss the opportunity on yen right now.
From a technical perspective, price action has followed our previous projections almost perfectly —
and now, strong fundamental signals are also emerging following the latest BOJ meeting.
📉 This could be a good time for a Sell position:
either from the current level (for aggressive traders),
or slightly higher around the 145 resistance zone.
🎯 The expected target lies around 139,
in line with the broader corrective structure.
This setup offers a high-potential move — especially for those tracking both TA and FA closely.