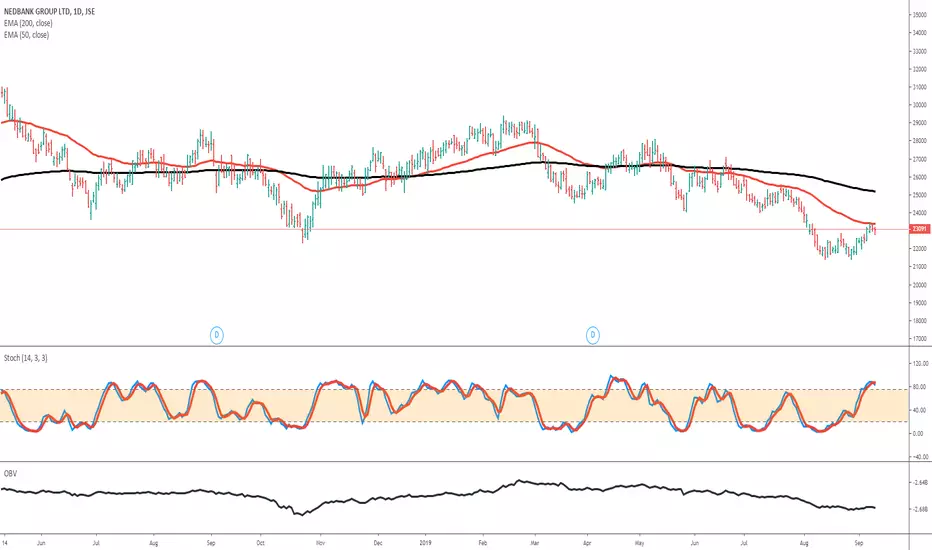
Im liking the banks!We closed above the weekly tenkan. Failed to actually cross it, indicating bearish weakness. Two weeks ago on the weekly we had a convincing bullish candle which pierced that same tenkan,so a test of that break was coming and we seem to have got it this week.That bullish weekly candle also confirmed a higher high after reaching a low mid August. This could be a major trend reversal from a bearish trend that started end of June.
Entry: Close of Friday candle 23269
SL 23266
TP: 25061
NED trade ideas

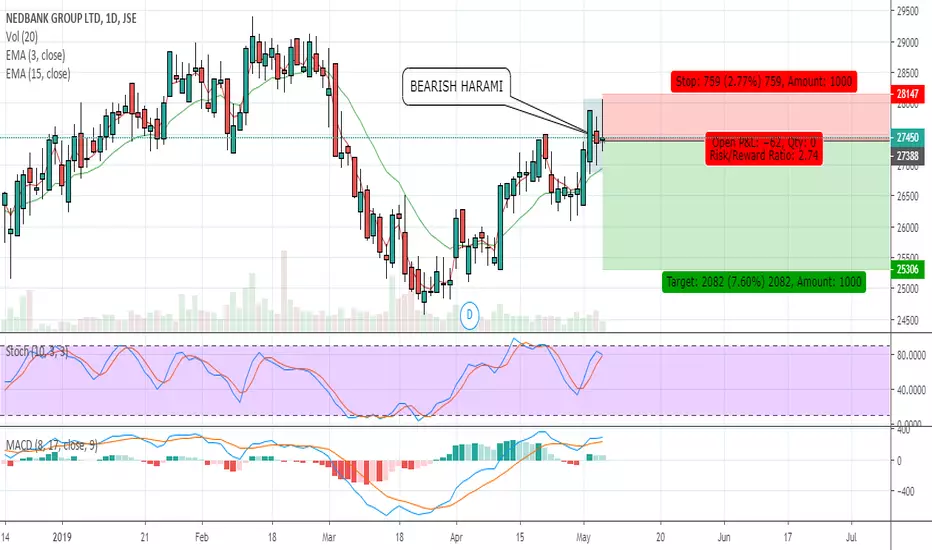
Nedbank - Harami at ResistanceJSE:NED has formed a bearish harami at a strong resistance level which it has failed to breach. It is looking good for a short position with the stochastic confirming. If it breaks through yesterday's low, I will enter a short position.
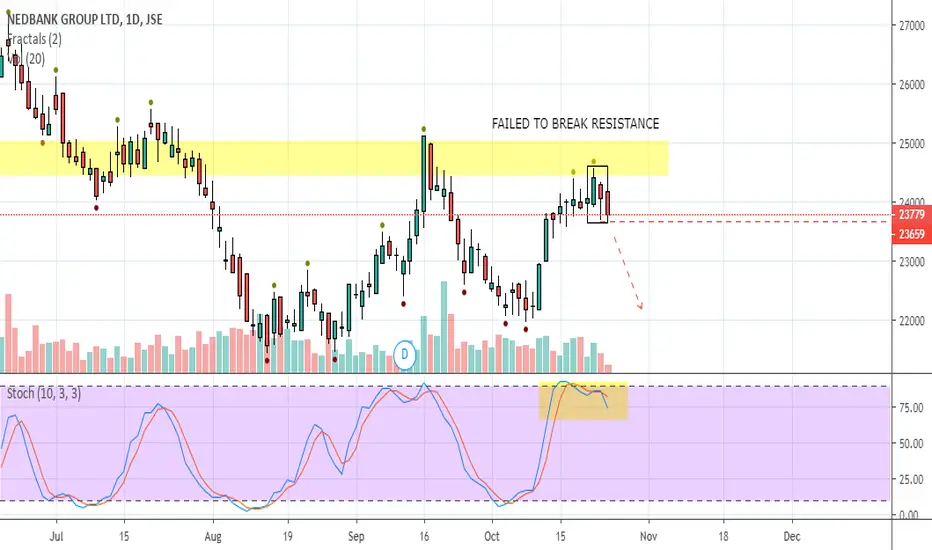
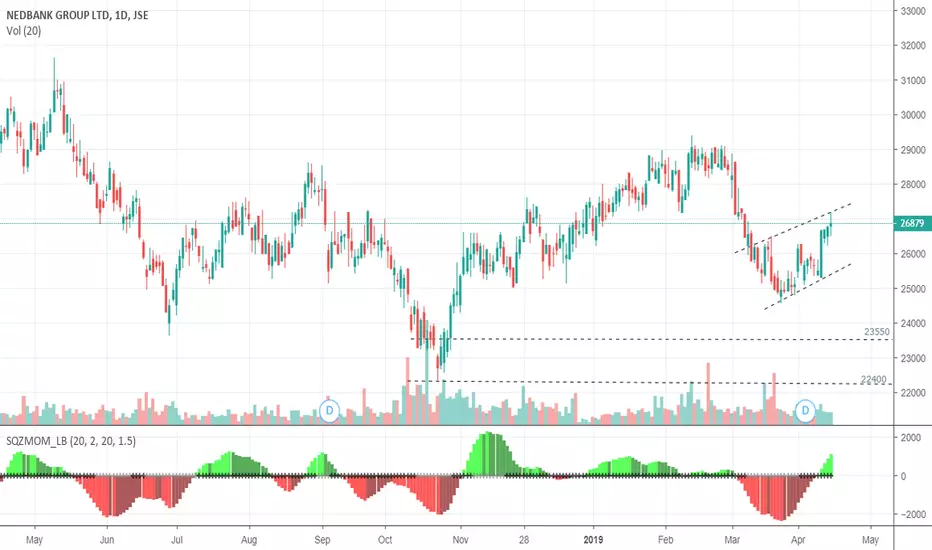
JSE:NED Nedbank Some Downside to ComeNedbank has been steadily increasing but after breaking the upward stride and breaking below the key 25000 level it seems that there is some distribution taking place. In the distribution, we see increasing volume on the declines and decreasing volume on the increases. Volume spikes are at the peaks. Looking for some markdown to take place.

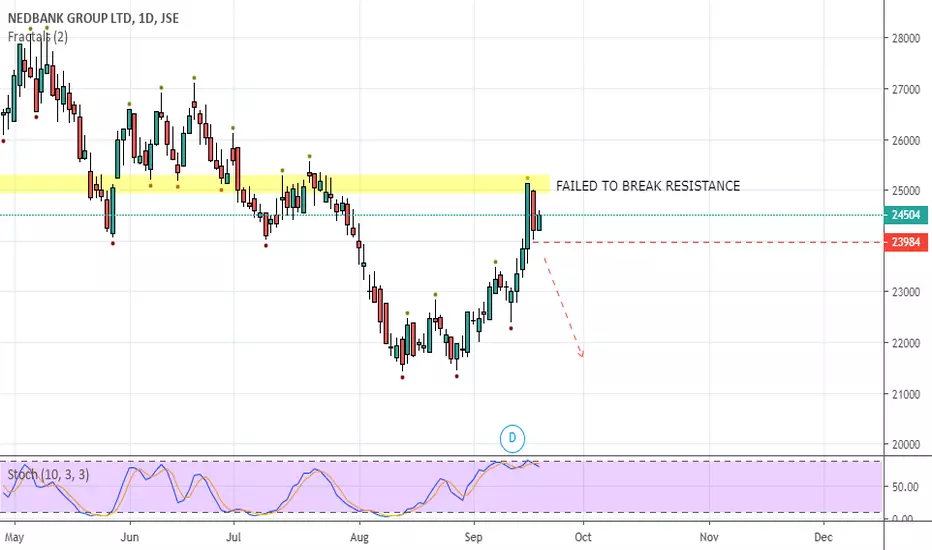
Nedbank fail at resistanceJSE:NED failed to break through a resistance level and seems to be bouncing into a downward direction. If it confirms, I will enter a short.
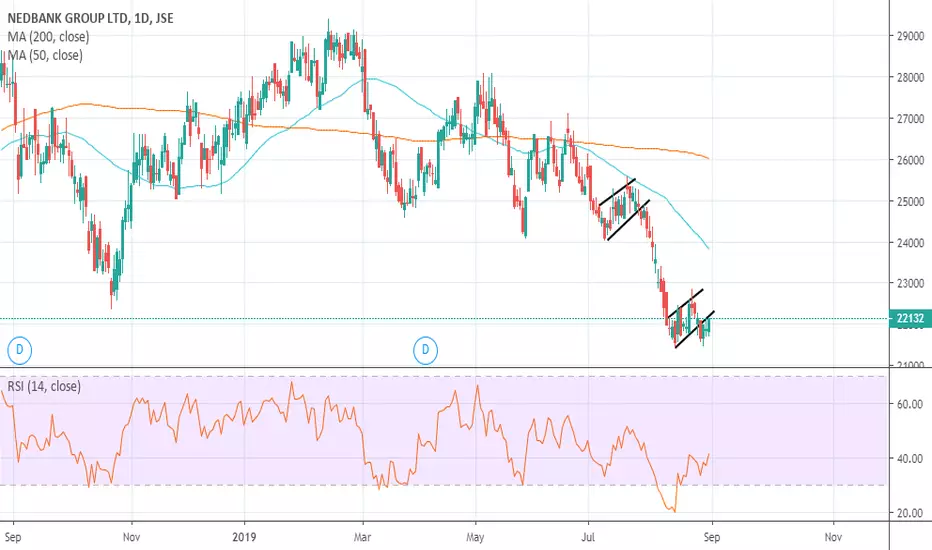
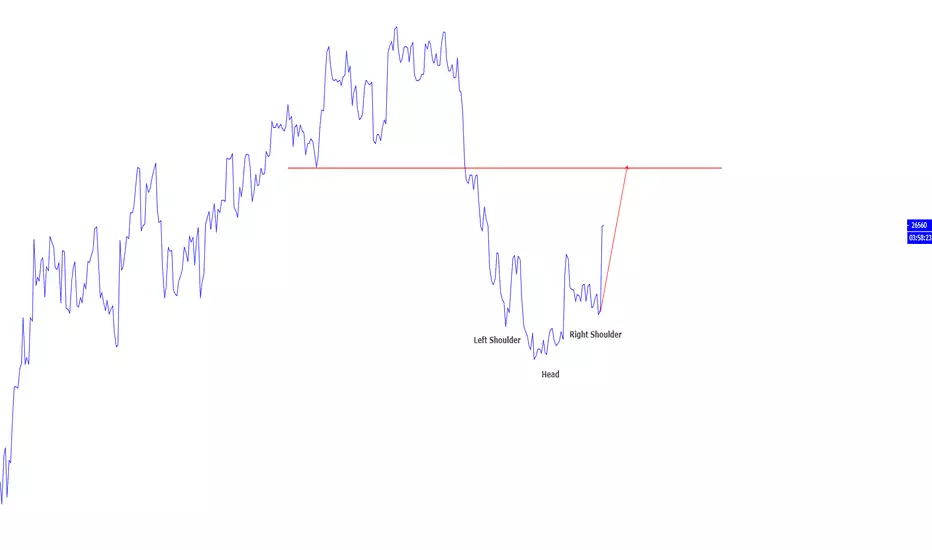
Nedbank 4hr bullish double bottom break up.Nedbank bullish breakup of a double bottom pattern on the 4hr charts, targets around R243 mark.
R:R 1:1.5
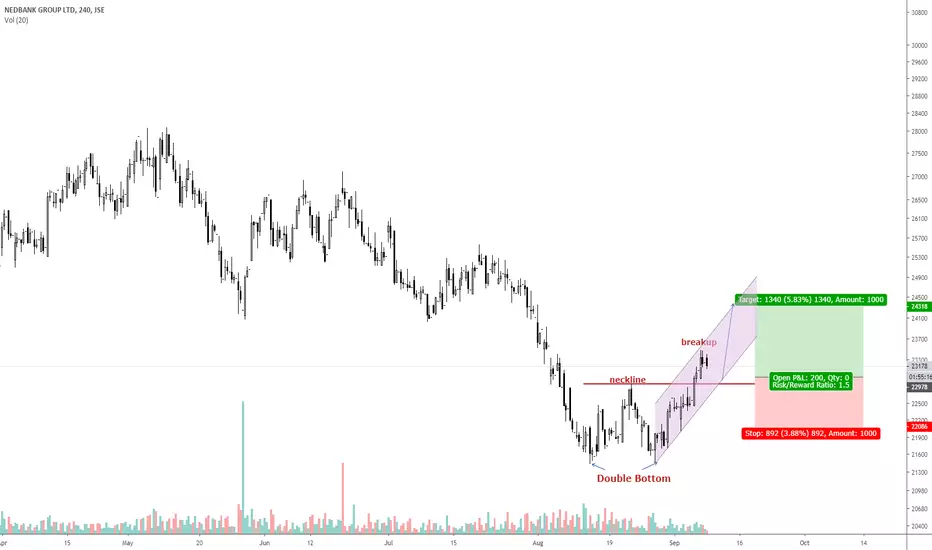
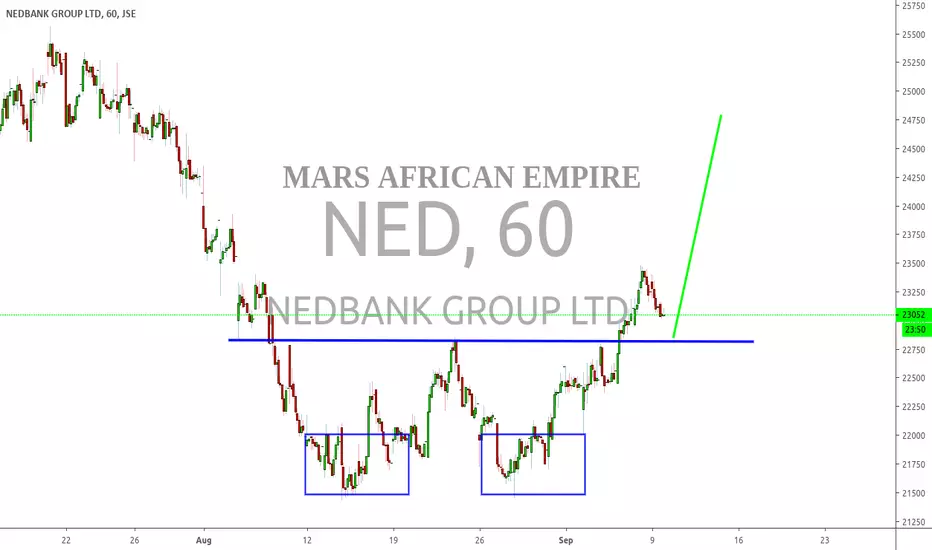
Double BottomJSE:NED is showing a double bottom pattern. A double bottom usually signifies a change of direction so we can look at a possible long position if it confirms.

Another bear flag on NEDI'm previously 'guilty' of banking my previous short on NED early.
But the same set up I took my previous short on, the bear flag,has presented itself again.
I'm short from R219, I'm targeting R200.
If the trend is indeed your friend, then I should be on the correct side of the trend.
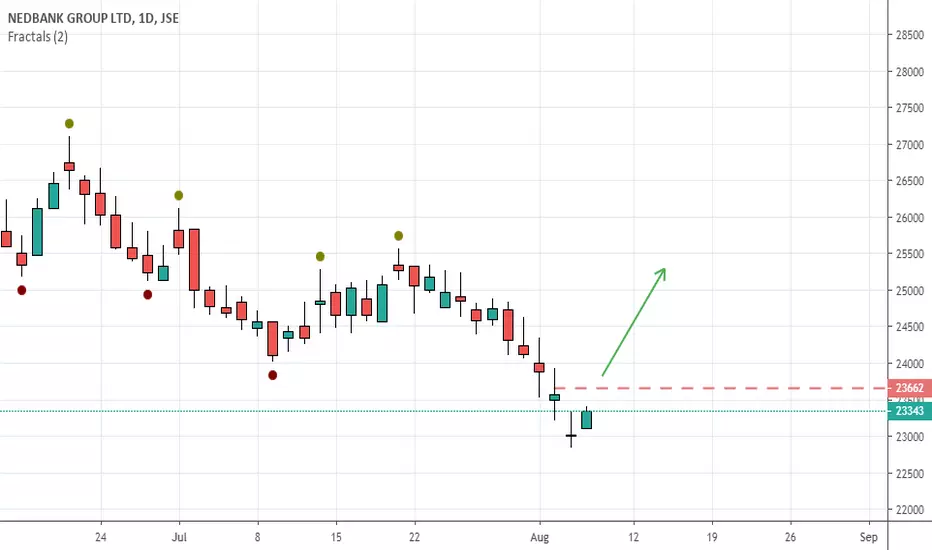
NED - Possible reversal imminent JSE:NED formed a doji candle yesterday which means that the market has lost it's sense of direction and is vulnerable to change. Keep an eye on it and if it breaches around the 23600 level, I will consider a long position.

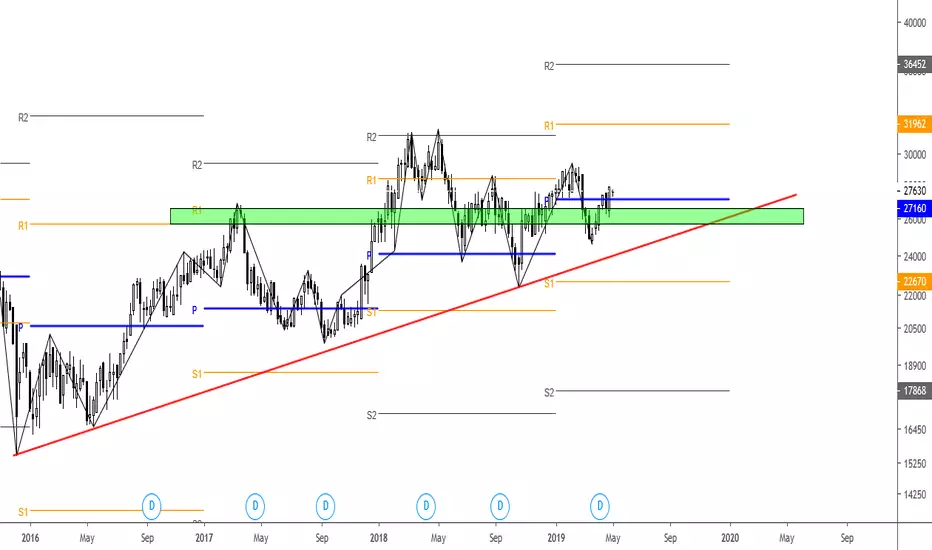
NED - Crossroads We may derive the following from the Weekly NED chart:
1. Price is near a weekly trend support.
2. Bears have dragged the price down for many weeks.
3. Price i.m.o should continue to fall further, but there is potential for buyers to come in at the current price.
4. I would consider waiting for more clear price action.
5. As always - maintain your risk.
Note: The views provided herein do not constitute financial advice.

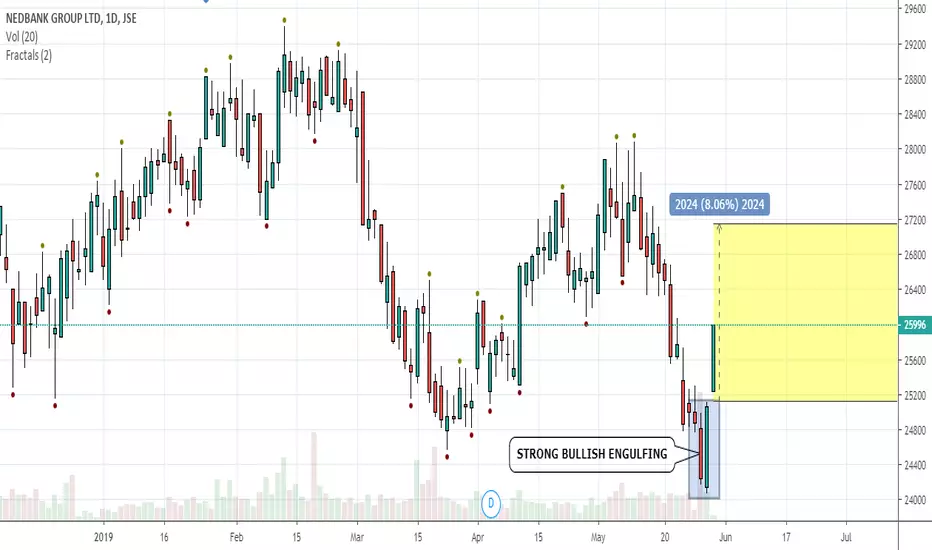
Strong Bullish Engulfing Signal on NEDJSE:NED has formed a strong bullish engulfing candle which shows great upward momentum.
Bearish Harami Reversal on NedbankJSE:NED is showing a bearish harami pattern, so is ready for a short position.
NEDBANK LONGWith the strong news coming out about Nedbank's Renewable energy Bonds i like Nedbank here
The pivots have all opened higher on the weekly showing good momentum
The First Target is R1 and the stops are below the green pivot extension
NEDBANKNEDBANK H4 (240 Minutes) Timeframe
Reasons For Entry:
- 61.8 Fib Retracement
- Wave "B" Correction Entry
Everything Good Yearns Patience And Time
Disclaimer: Trading stocks, commodities, futures and forex has a level of risk and may not be suitable for all investors.
This Page has many charts to show setups and patterns for illustrative purpose and no set up given should be taken as a recommendation. This is purely what I see in the market, trading the setups is at your own discretion and risk.
$JSENED Bear flag ? A potential bear could be forming on Nedbank. Still early days, but something to keep an eye on.
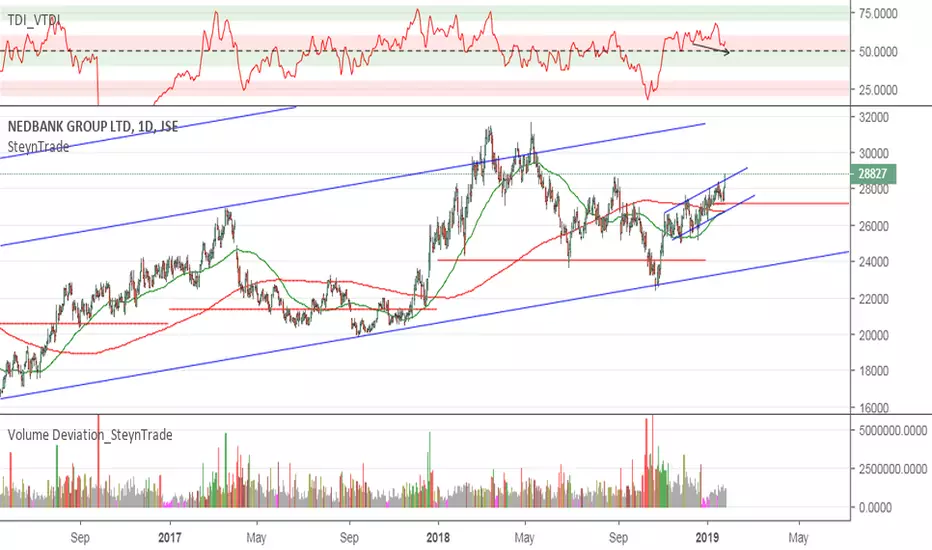
JSE:NED Nedbank Re-accumulationNedbank has been in an upward slanting re-accumulation range over the festive season. With some volume returning we see a continuation of the move to the top of the channel. There is some negative divergence in the Volume RSI and a good momentum bar on Friday.
Strong Reversal Possibility on NedbankJSE:NED is showing signs of a possible reversal.
A few days ago a bearish harami formed at a very strong resistance level which at the same time formed a double top.
Planning on entering a short position if it trades a bit lower.

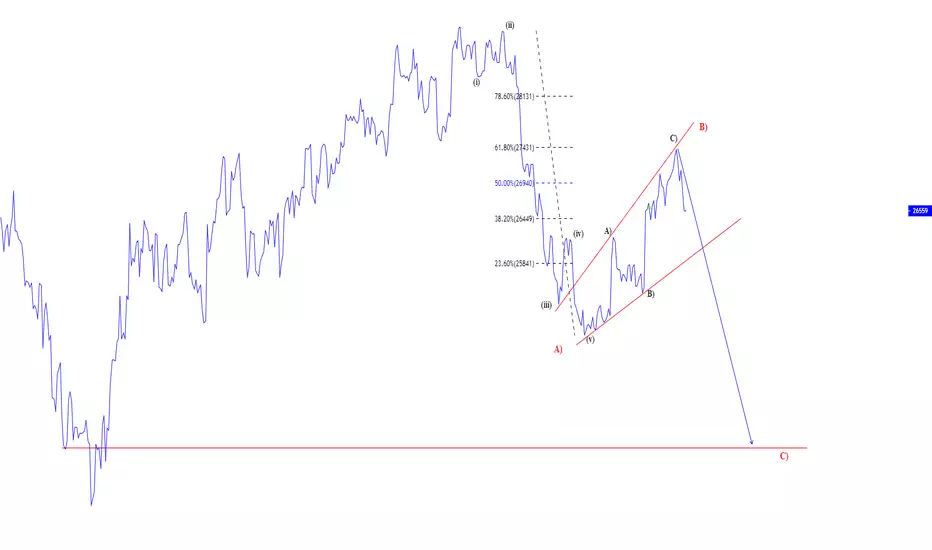
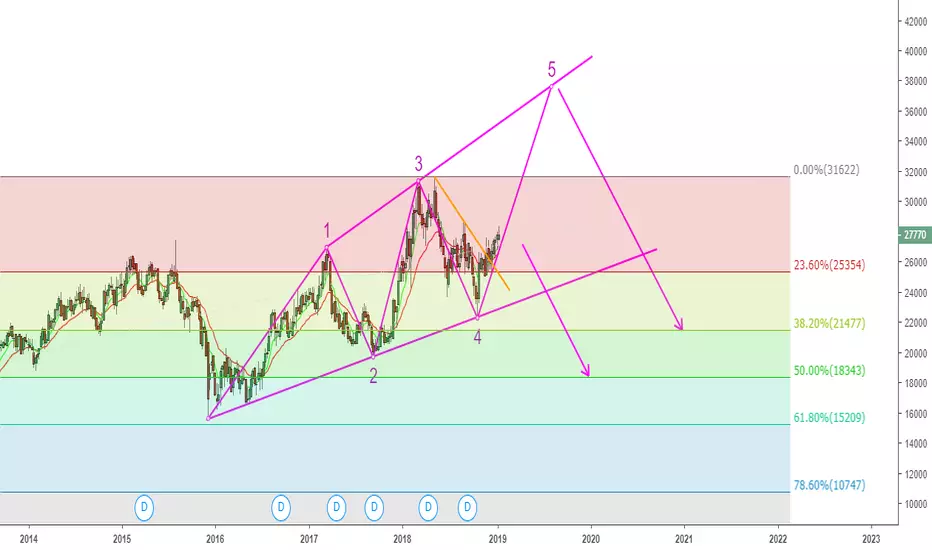
Wave 5 Up or Break Down for Nedbank?Nedbank Group is one of SA’s four largest banking groups by assets and deposits, with Nedbank Ltd. being its principal banking subsidiary. Nedbank Group is a JSE Top 40 company with its ordinary shares listed on the JSE since 1969 and on the Namibian Stock Exchange since 2007. The group's market capitalisation was R128 billion at 31 December 2017. Old Mutual plc is Nedbank Group's majority shareholder, with a 54.05% ownership of the group. The group provides a wide range of wholesale and retail banking services and a growing insurance, asset management and wealth management offering through four main business operations, namely Nedbank Corporate and Investment Banking, Nedbank Retail and Business Banking, Nedbank Wealth and Rest of Africa.
Technicals
This is a bearish structure formation so ultimately I expect a break to the downside. AS things stand now, I am expecting wave 5 to complete before the downside will occur. Price broke above the orange trend line indicated on the chart which leads me to believe that wave 5 is likely. There is however a possibility that a larger correction will form so be weary of reversal signs.
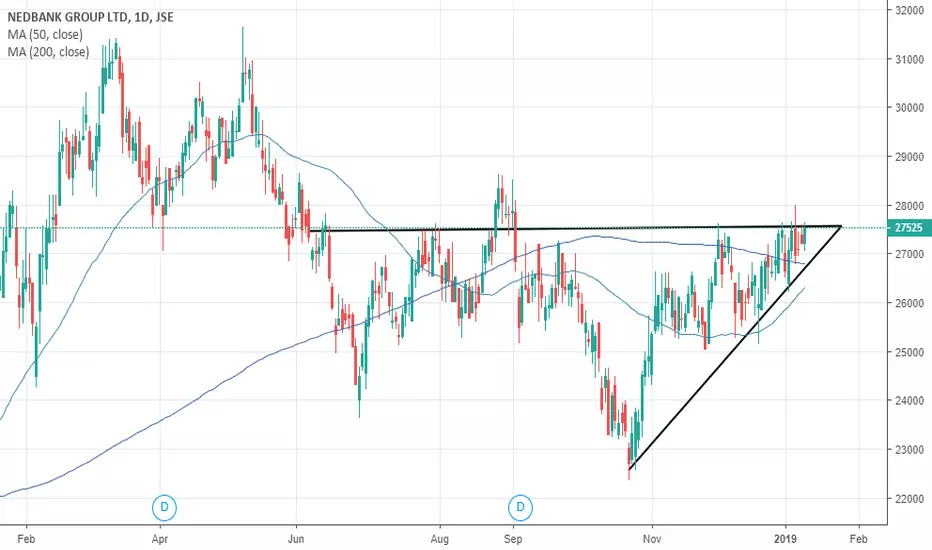
Nedbank attempting to break to the upside?Nedbank daily chart showing price attempting to break to the upside of an ascending triangle pattern that has formed.
Resistance is at R275. During the past week we have been seeing intra-day highs above this area, but still managing to close below it.
NED Long positionJSE:NED looking good for a long position as it has broken through the resistance of the ascending triangle pattern that it has been following.
It came back down and tested the support, and if it continues up, it should be a good long position.
