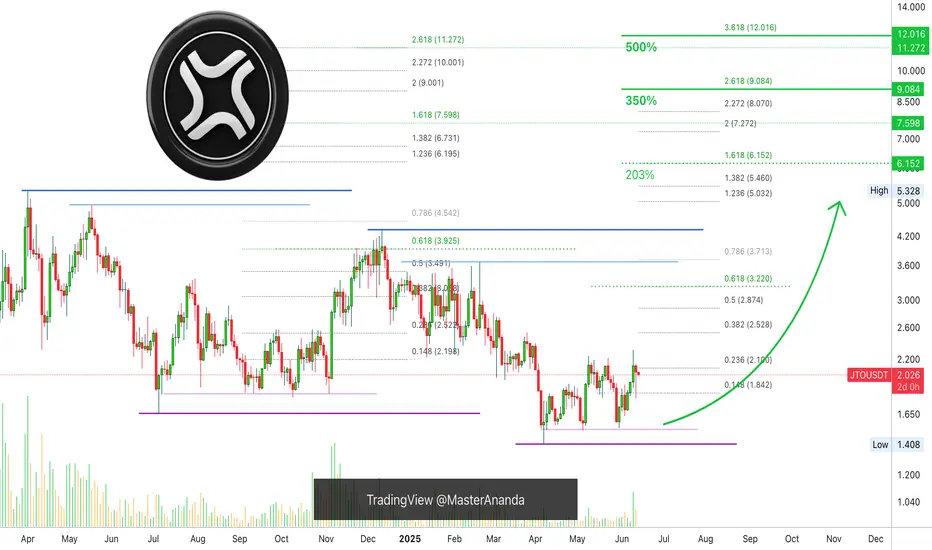
JITO Long-Term Accumulation Phase, Whales, Exchanges & 500% PPThe same market conditions prevail on this chart as with many other altcoins. The low is in. The low has been in for months, since 7-April 2025.
The advance has been happening very slowly and this is good. There will be a point where everything is up "out of the blue." No blue here, no surprise. Wh
JTOUSDT Forming Bullish WaveJTOUSDT is currently shaping a promising bullish wave pattern, signaling potential continuation of an upward trend in the coming days or weeks. This wave formation is often associated with renewed buying interest and signals that price action is building strong momentum for another leg higher. Coupl

#JTO/USDT#JTO
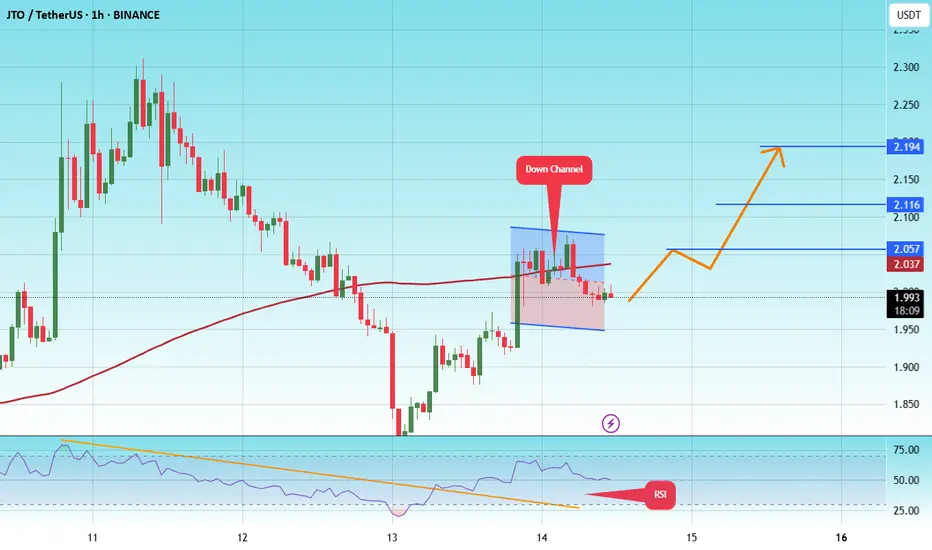
The price is moving within a descending channel on the 1-hour frame and is expected to break and continue upward.
We have a trend to stabilize above the 100 moving average once again.
We have a downtrend on the RSI indicator that supports the upward move with a breakout.
We have a support a
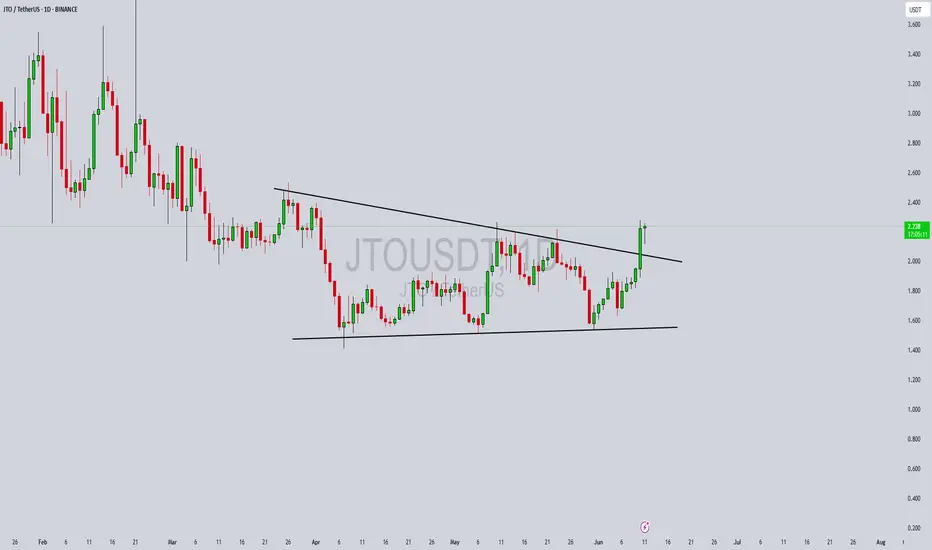
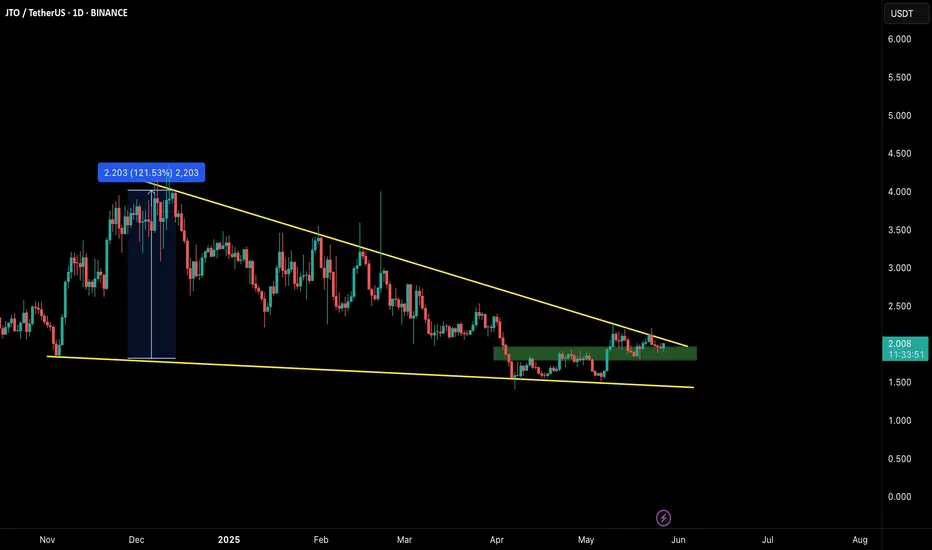
JTOUSDT Forming Symmetrical TriangleJTOUSDT has recently broken out of a well-defined symmetrical triangle pattern, signaling a potential bullish continuation. The breakout is backed by solid volume, indicating strong interest from market participants and confirming the breakout’s legitimacy. This technical setup often precedes a sign
Can JTO pull a BNB All-Time-High Move??BNB made a similar pattern that led to it's previous ATH.
Since we are still waiting on the new ETH a time highs, followed by altseason, we can expect to see altcoins beginning to increase when ETH trades sideways. More on that here :
We can also expect to see rallies across other altcoins:
an

JTOUSDT 1D AnalysisJTO ~ 1D Analysis
#JTO Buy gradually from here if you still have confidence in this coin with a short term target of at least 15%+ from here.
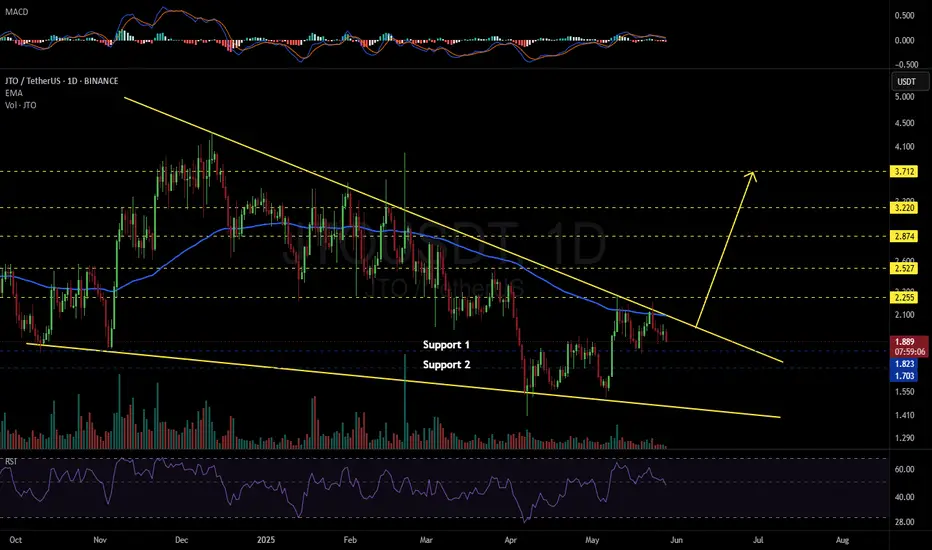
JTOUSDT 1D#JTO has formed a Falling Wedge pattern on the daily chart — a classic bullish setup. 📉➡️📈
📍 Consider buying near the support levels:
$1.823 and $1.703
In case of a breakout above the wedge resistance and the daily EMA100, the upside targets are:
🎯 $2.255
🎯 $2.527
🎯 $2.874
🎯 $3.220
🎯 $3.712
⚠️ A
JTO will pump 20%JTO is building value above the pmProfile. That´s bullish and not bearish, because people are accepting the price above the profile. This "building value" tells us that the price is preparing for another leg to the upside -> We have to find out main targets above the current range. There are some un

JTO Approaching Breakout Point – Watch This Wedge!🚀 JTO Falling wedge Formation – 100%+ Potential Incoming?! 👀🔥
Hey Traders! If you're all about high-conviction plays and real alpha, smash that 👍 and tap Follow for more setups that actually deliver! 💹💯
JTO has been consolidating within a falling wedge on the daily timeframe for months and is now
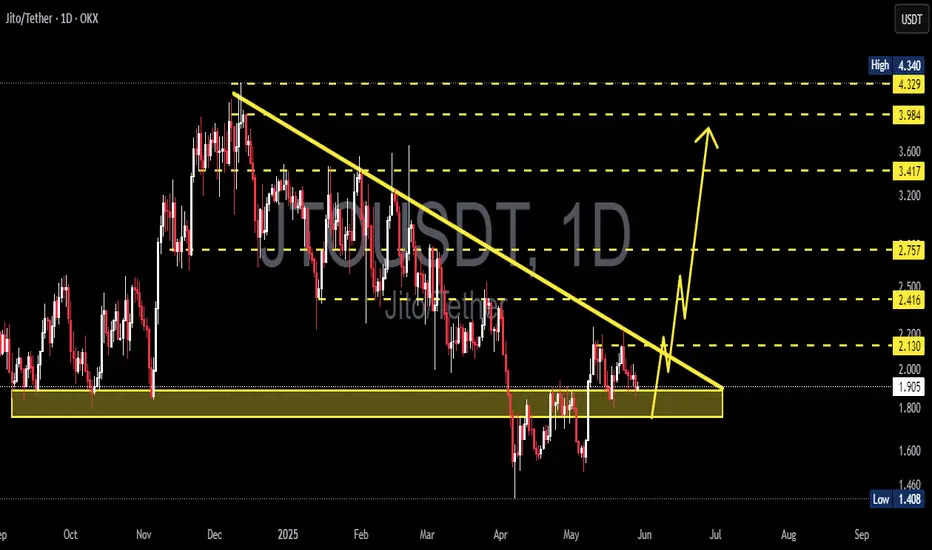
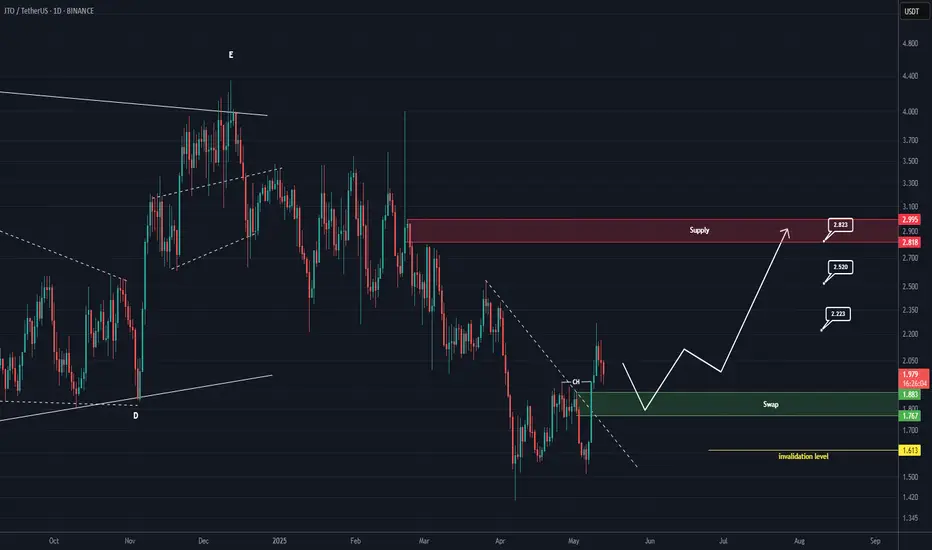
JTO Buy/Long Setup (1D)It appears that JTO is in a bearish pattern on the higher timeframe, but it shows a bullish structure on the lower timeframes and could move to the upside.
The trigger line has been broken, and we have a bullish CH (Change of Character) on the chart.
We are looking for buy/long positions around th
See all ideas
Summarizing what the indicators are suggesting.
Oscillators
Neutral
SellBuy
Strong sellStrong buy
Strong sellSellNeutralBuyStrong buy
Oscillators
Neutral
SellBuy
Strong sellStrong buy
Strong sellSellNeutralBuyStrong buy
Summary
Neutral
SellBuy
Strong sellStrong buy
Strong sellSellNeutralBuyStrong buy
Summary
Neutral
SellBuy
Strong sellStrong buy
Strong sellSellNeutralBuyStrong buy
Summary
Neutral
SellBuy
Strong sellStrong buy
Strong sellSellNeutralBuyStrong buy
Moving Averages
Neutral
SellBuy
Strong sellStrong buy
Strong sellSellNeutralBuyStrong buy
Moving Averages
Neutral
SellBuy
Strong sellStrong buy
Strong sellSellNeutralBuyStrong buy
Displays a symbol's price movements over previous years to identify recurring trends.