Bullish Cypher Pattern Forming on JUPUSDT (4H)A textbook bullish Cypher pattern has completed at point D, showing clear harmonic symmetry and strong reaction from a key confluence support zone.
🔍 Pattern Breakdown:
XA leg shows strong impulsive movement, confirming initial bullish momentum.
AB retracement held near 0.382-0.618 Fibonacci zone

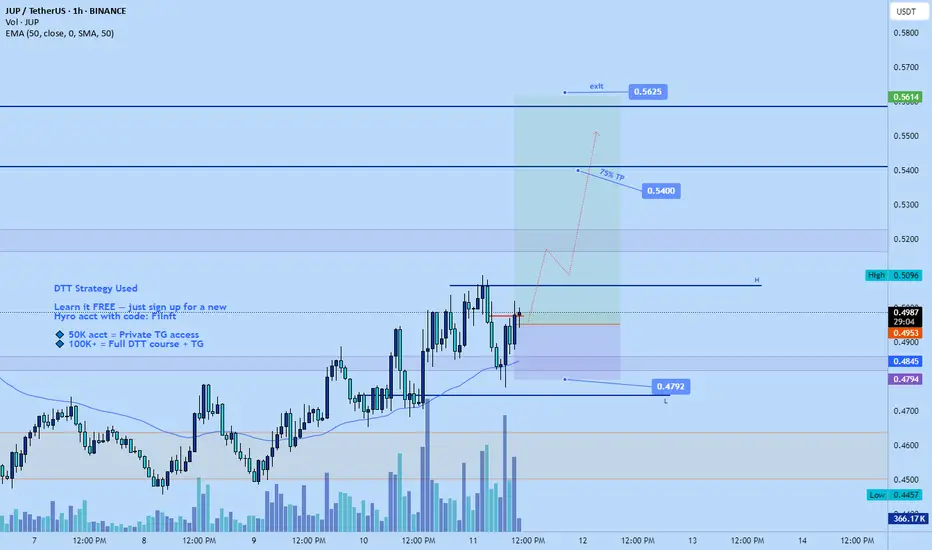
Jupiter long to $0.5625I opened a long position on Jupiter not too long ago.
Aiming for the daily downtrend structural lower at 0.54 and weekly higher high point a bit above around $0.5625
3-4RR trade
Time sensitive
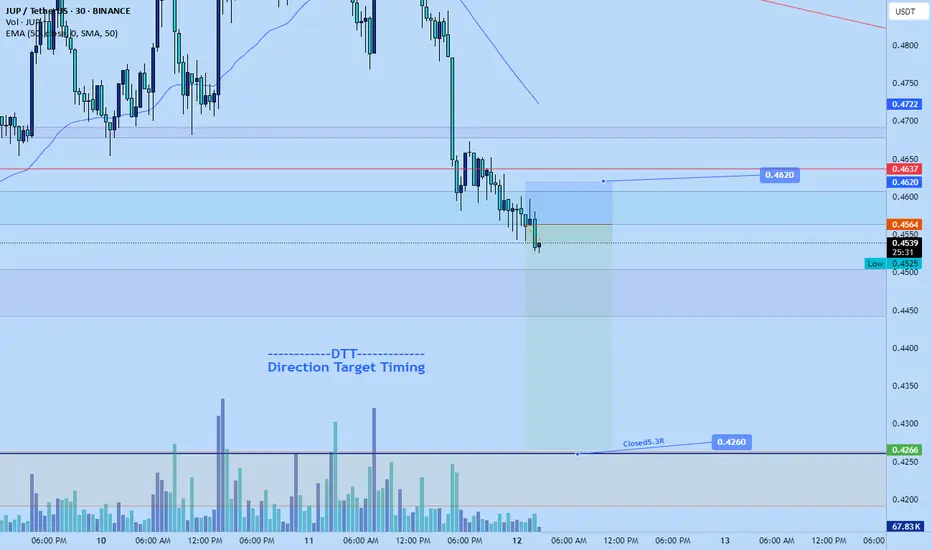
Jupiter short down to $0.426Just recently entered a short position on jupiter
Target is $0.4260
Stop: $0.4620 or higher
Time sensitive
Still can get like 3+RR from it.
My DTT setup applied.
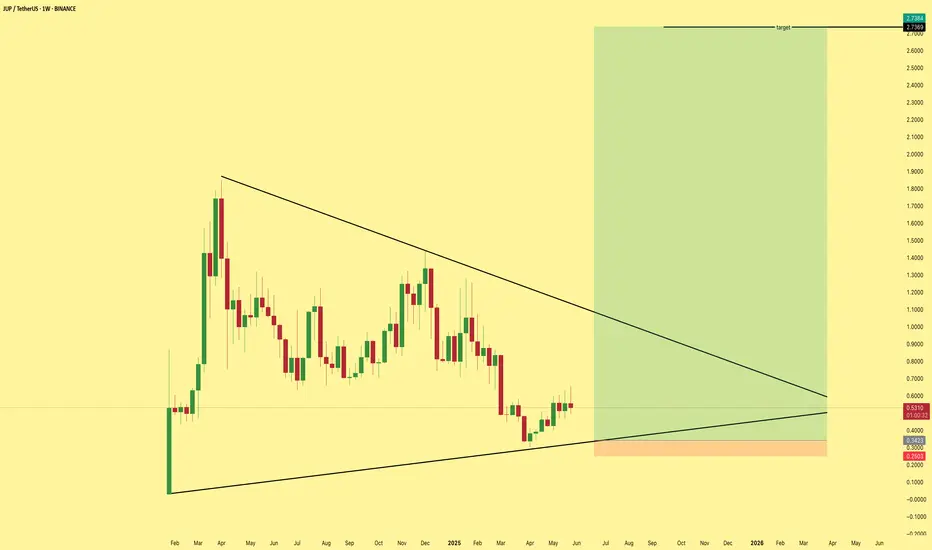
JUP/USDTThere’s a potential 700% upside for LSE:JUP , with a maximum time horizon of around 300 days. However, given the current market dynamics, I believe this move could materialize much sooner, likely within 200 days.
This setup is also a strong indicator for an upcoming altcoin season.
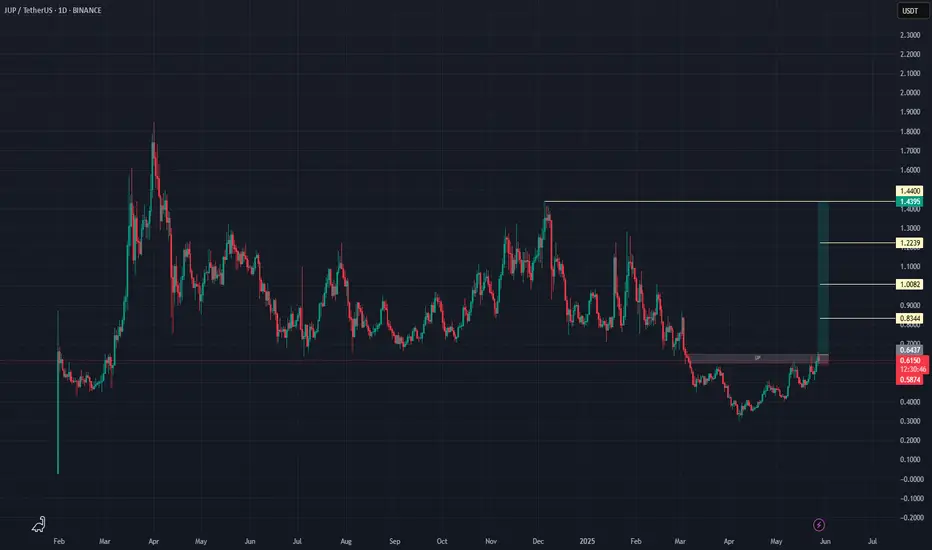
JUP USDT Possible Bullish Breakout!
Price has broken above the key resistance at $0.64, signaling a potential bullish structure. I’ve personally taken a position here, targeting the next levels: $0.83, $1.00, $1.22, and possibly $1.44.
If price holds above this zone, we could see a strong move upward.
📈 What
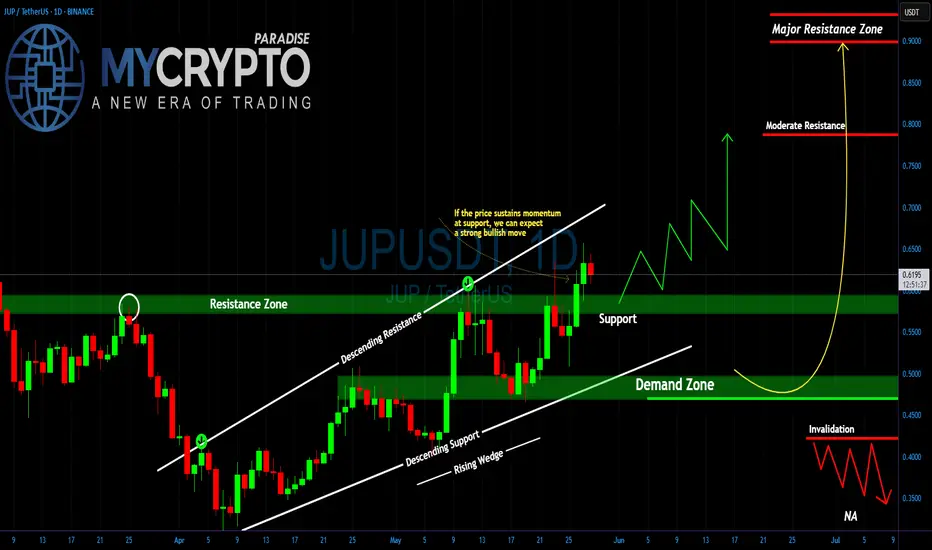
JUPUSDT Breakout... or Classic Bull Trap?Yello Paradisers are you truly prepared for one of the cleanest and most deceptive setups we've seen on JUPUSDT in weeks? A decisive move is building, but so is a very well-placed trap and only those who remain disciplined will navigate it safely.
💎#JUPUSDT has broken above a key resistance level
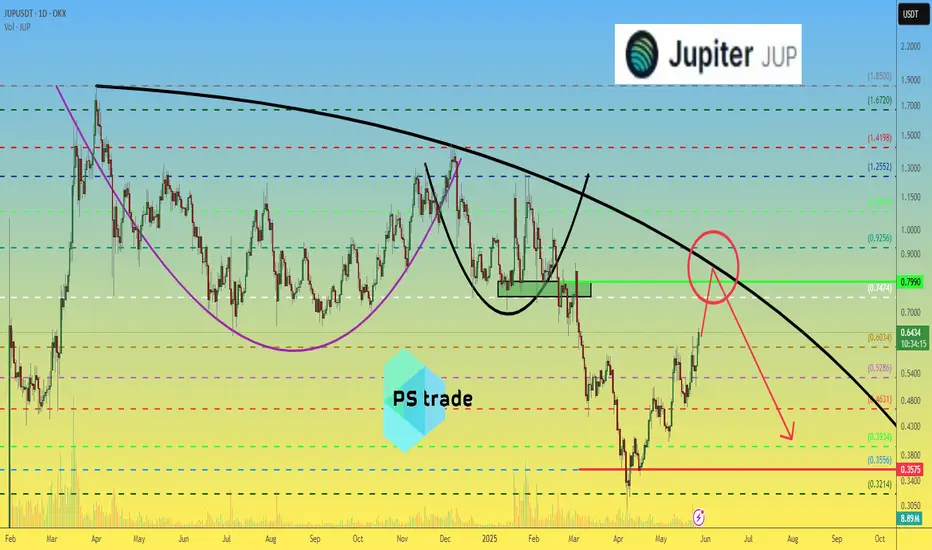
Jupiter JUP price analysisThe price of OKX:JUPUSDT did not live up to the “multifaceted promises” of marketers and disappointed us...
So we will get rid of #Jup from our portfolio in the designated area.
May all the gods, headed by Zeus, help #Jupiter rises from its knees and cross the $0.80 mark at least for a while
Ther
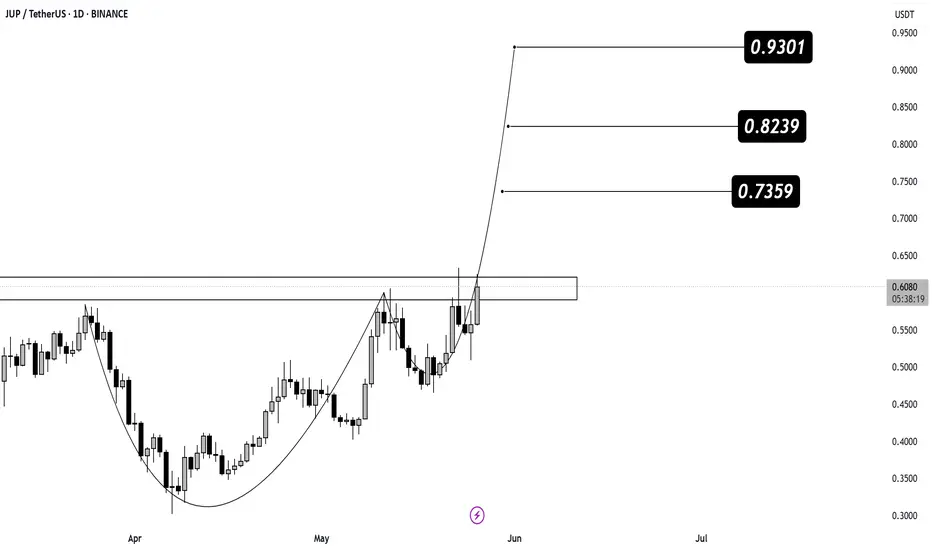
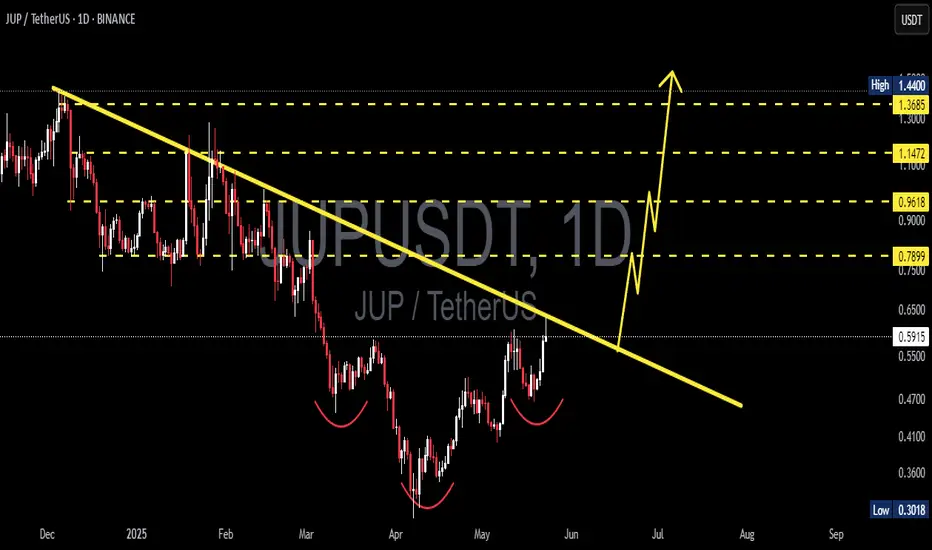
JUP Breakout Watch – Cup Formation in Play
LSE:JUP is completing a cup formation and is now testing a key resistance zone. A strong breakout above this level could spark the next leg up.
📍 Breakout Zone: ~$0.60
📈 Targets on Breakout:
🎯 Target 1: $0.7359
🎯 Target 2: $0.8239
🎯 Target 3: $0.9301
Watch for a daily close above the resista
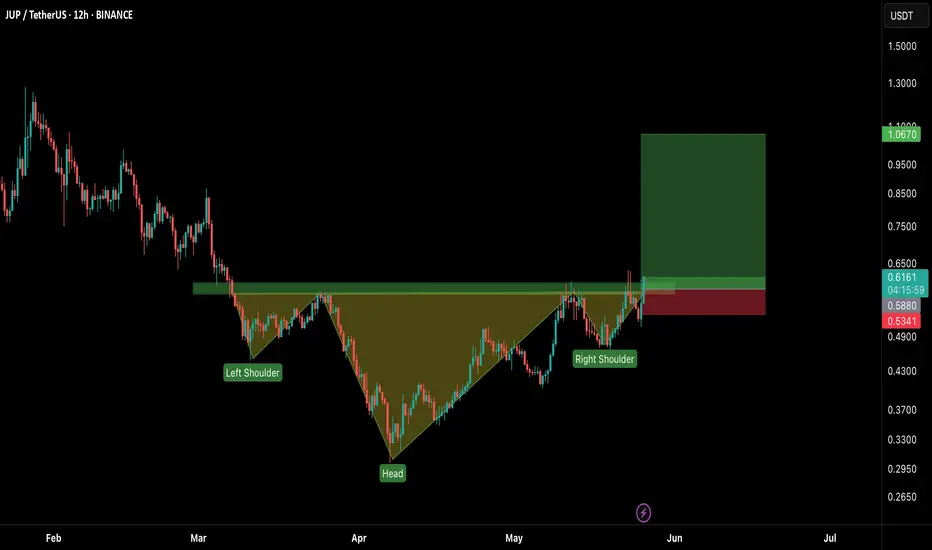
JUP/USDT: Classic Inverse Head & Shoulders Breakout!🚀 JUP Inverse Head and Shoulder Breakout – 80% Potential Incoming?! 👀🔥
Hey Traders! If you're all about high-conviction plays and real alpha, smash that 👍 and tap Follow for more setups that actually deliver! 💹💯
JUP is breaking out of a textbook Inverse Head and Shoulders pattern on the 12H timefr
JUPUSDT 1D AnalysisJUP ~ 1D Analysis
#JUP Buy gradually after successfully breaking through this resistance line with a short-term target of at least 10%+ from here.
See all ideas
Summarizing what the indicators are suggesting.
Oscillators
Neutral
SellBuy
Strong sellStrong buy
Strong sellSellNeutralBuyStrong buy
Oscillators
Neutral
SellBuy
Strong sellStrong buy
Strong sellSellNeutralBuyStrong buy
Summary
Neutral
SellBuy
Strong sellStrong buy
Strong sellSellNeutralBuyStrong buy
Summary
Neutral
SellBuy
Strong sellStrong buy
Strong sellSellNeutralBuyStrong buy
Summary
Neutral
SellBuy
Strong sellStrong buy
Strong sellSellNeutralBuyStrong buy
Moving Averages
Neutral
SellBuy
Strong sellStrong buy
Strong sellSellNeutralBuyStrong buy
Moving Averages
Neutral
SellBuy
Strong sellStrong buy
Strong sellSellNeutralBuyStrong buy
Displays a symbol's price movements over previous years to identify recurring trends.