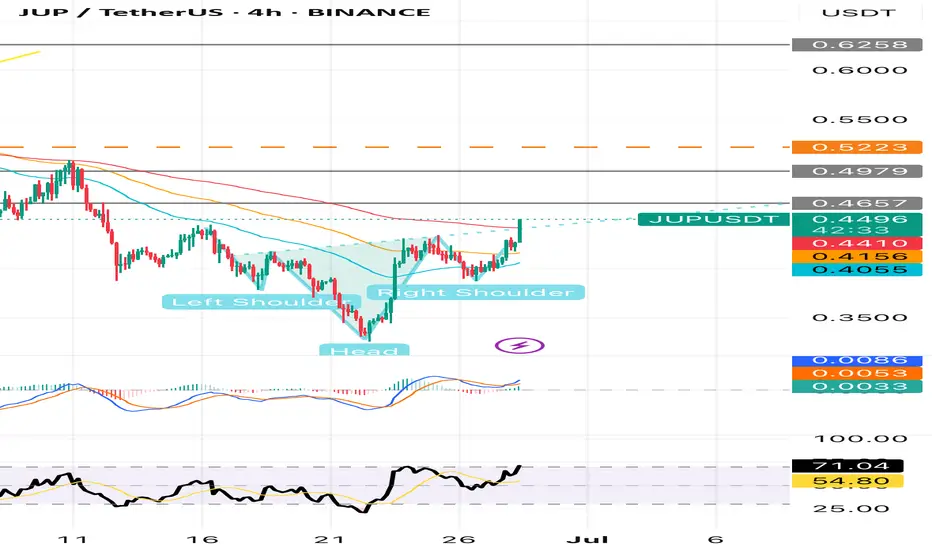
JUP BULLISH PATTERNShoulder Head Shoulder in the rising at 4h.
BTC is showing is still bullish run which could lead to altcoins going bullish as well.
JUP has confirm it, However at 6pm we could wait for another confirmation.
1D it shows a Double Bottom which it confirms the Bullish pattern for JUP.
1D it seems it cou
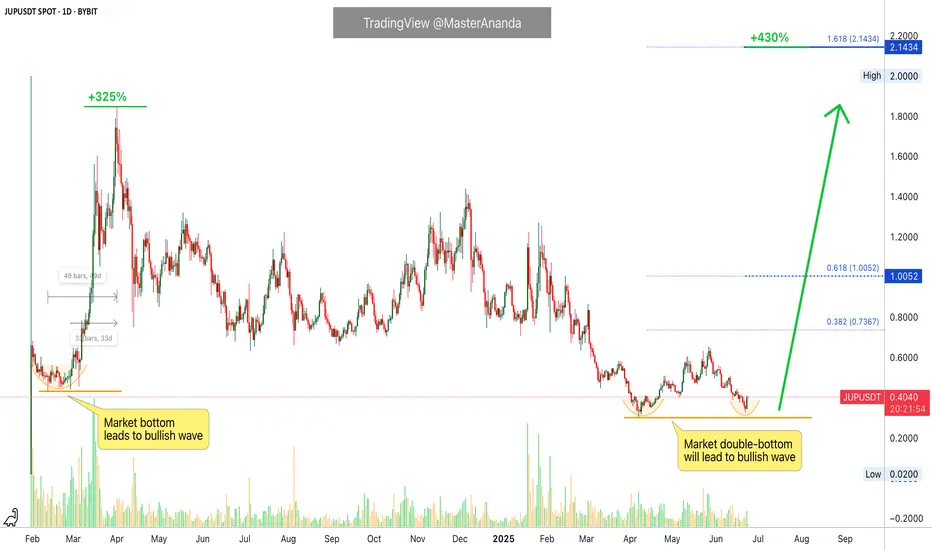
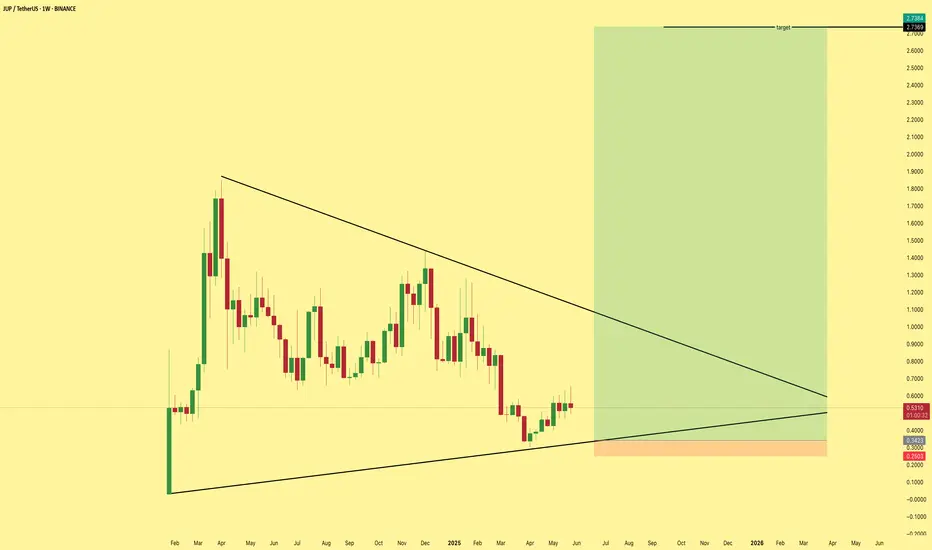
Jupiter, Mapping A 430% Bullish WaveJupiter is set to grow really strong, we agree correct?
When we agree right from the start, I can skip the technical analysis and move straight to the target. Because everybody knows JUPUSDT is set to grow really strong in the coming months.
Back in early 2024 a market bottom led to growth. A 325%
#JUP/USDT#JUP
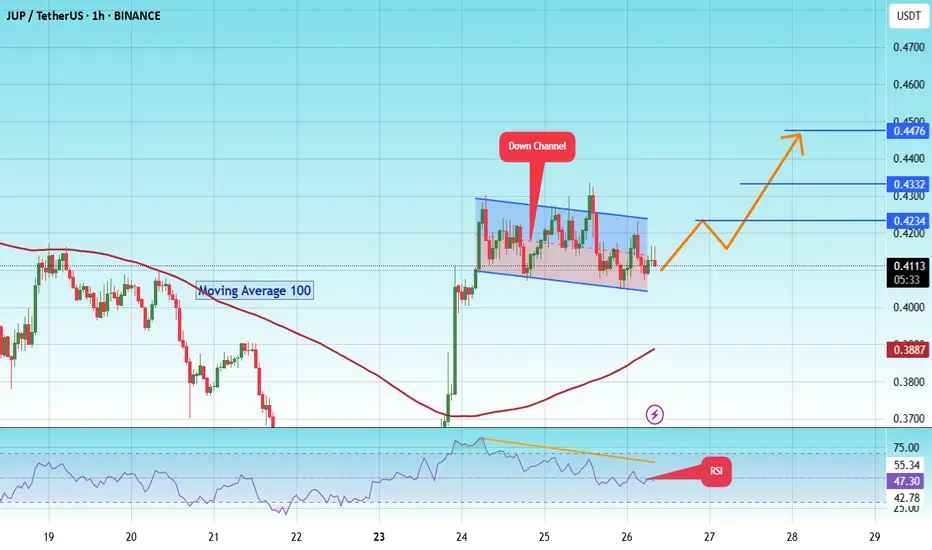
The price is moving within a descending channel on the 1-hour frame and is expected to break and continue upward.
We have a trend to stabilize above the 100 moving average once again.
We have a downtrend on the RSI indicator, which supports the upward move by breaking it upward.
We have a s
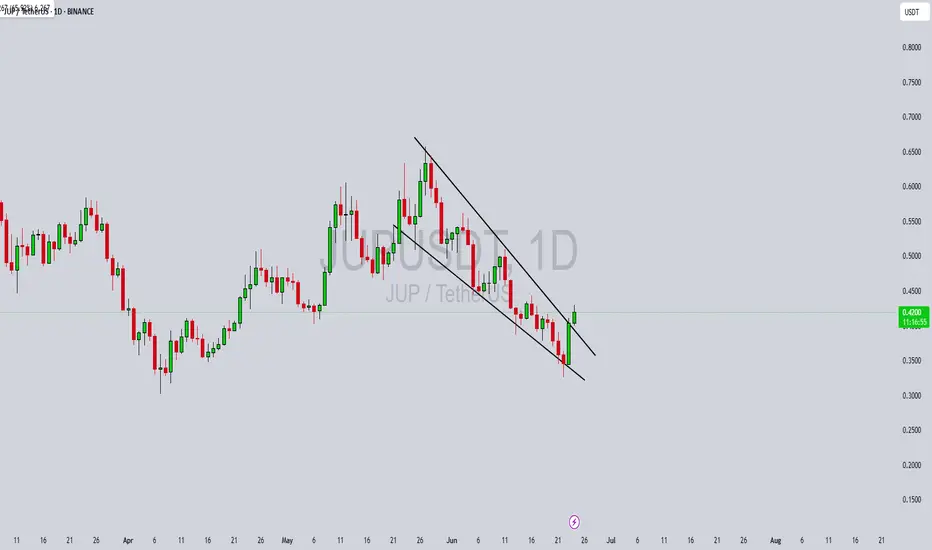
JUPUSDT 1D#JUP is currently trading inside a descending channel on the daily chart.
A breakout above the channel resistance and the MA50 could trigger strong bullish momentum.
If confirmed, the targets are:
🎯 $0.5733
🎯 $0.7366
🎯 $0.8709
🎯 $1.0052
🎯 $1.1964
⚠️ Always use a tight stop-loss to manage risk and

JUPUSDT Forming Falling WedgeJUPUSDT is showing strong bullish potential as it forms a classic falling wedge pattern—a technical setup often preceding significant upward price movement. This pattern, defined by a series of lower highs and lower lows converging into a narrowing channel, reflects declining bearish momentum. With
JUPUSDT Retests Breakout Zone: Rally Ahead?JUPUSDT has broken its downtrend and is now in a retest phase, which could lead to a continuation of the bullish move. If the support area holds, there’s potential for upward momentum to resume. Traders are watching this zone closely as a possible entry point, with bullish structure still intact and
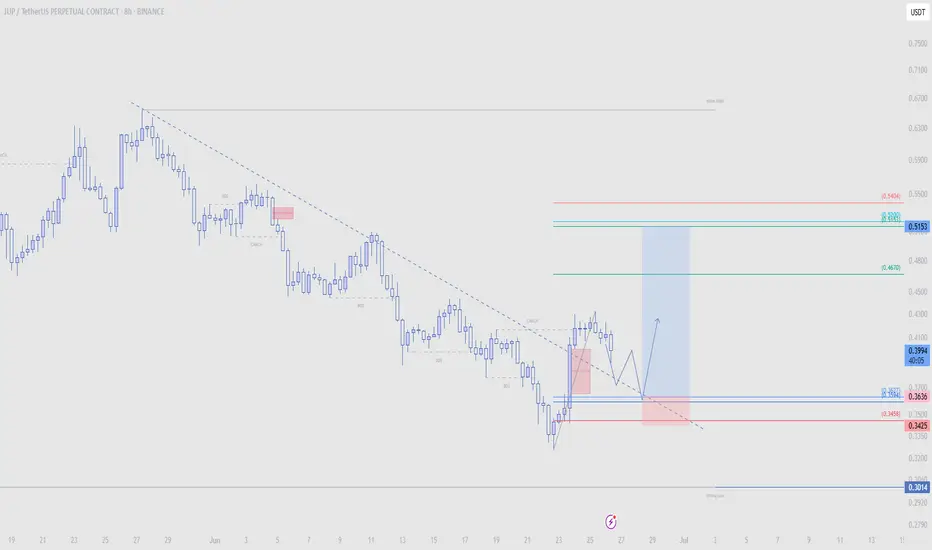
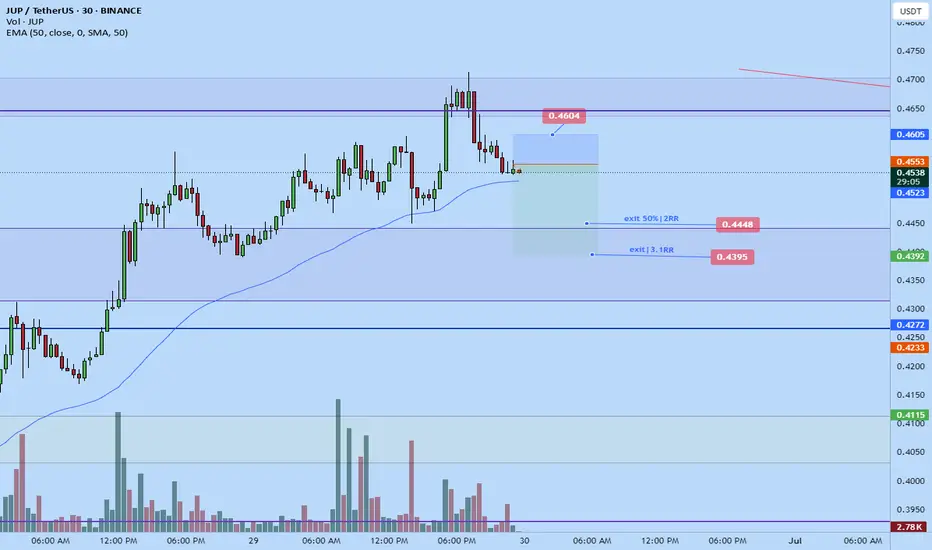
Jupiter short to 0.4395Opened a short position on Jupiter short not too long ago. The market been trending up but right now its quite high and likely to correct back down a bit before continuation.
DTT setup
2-3RR
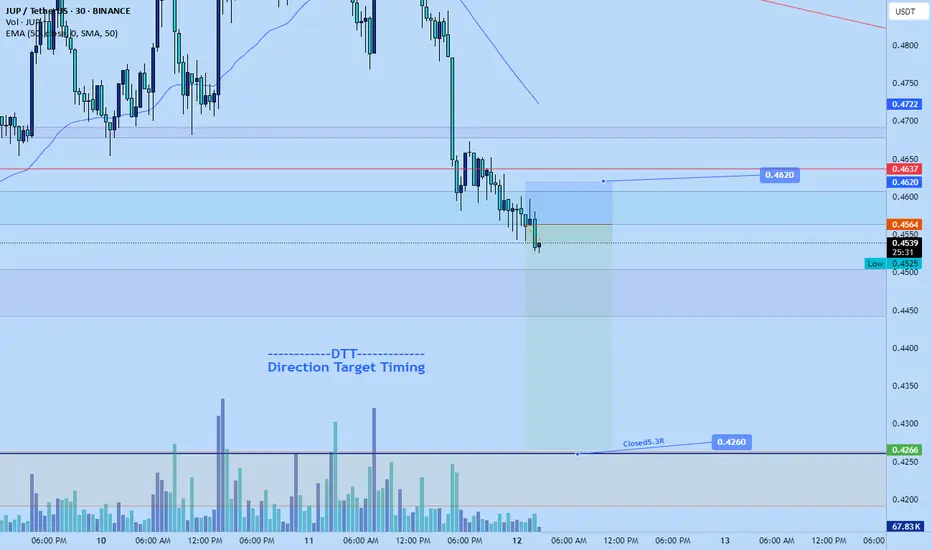
Jupiter short down to $0.426Just recently entered a short position on jupiter
Target is $0.4260
Stop: $0.4620 or higher
Time sensitive
Still can get like 3+RR from it.
My DTT setup applied.
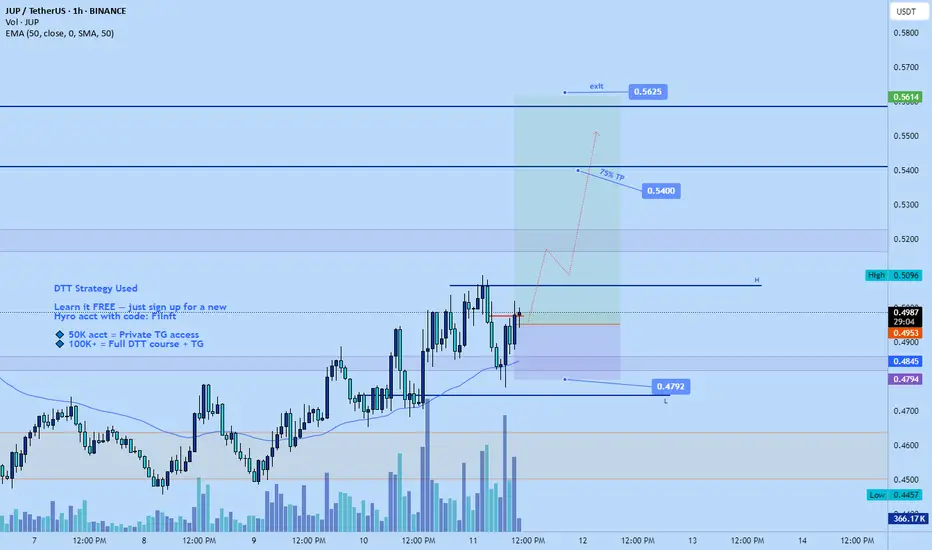
Jupiter long to $0.5625I opened a long position on Jupiter not too long ago.
Aiming for the daily downtrend structural lower at 0.54 and weekly higher high point a bit above around $0.5625
3-4RR trade
Time sensitive
JUP/USDTThere’s a potential 700% upside for LSE:JUP , with a maximum time horizon of around 300 days. However, given the current market dynamics, I believe this move could materialize much sooner, likely within 200 days.
This setup is also a strong indicator for an upcoming altcoin season.
See all ideas
Summarizing what the indicators are suggesting.
Oscillators
Neutral
SellBuy
Strong sellStrong buy
Strong sellSellNeutralBuyStrong buy
Oscillators
Neutral
SellBuy
Strong sellStrong buy
Strong sellSellNeutralBuyStrong buy
Summary
Neutral
SellBuy
Strong sellStrong buy
Strong sellSellNeutralBuyStrong buy
Summary
Neutral
SellBuy
Strong sellStrong buy
Strong sellSellNeutralBuyStrong buy
Summary
Neutral
SellBuy
Strong sellStrong buy
Strong sellSellNeutralBuyStrong buy
Moving Averages
Neutral
SellBuy
Strong sellStrong buy
Strong sellSellNeutralBuyStrong buy
Moving Averages
Neutral
SellBuy
Strong sellStrong buy
Strong sellSellNeutralBuyStrong buy
Displays a symbol's price movements over previous years to identify recurring trends.