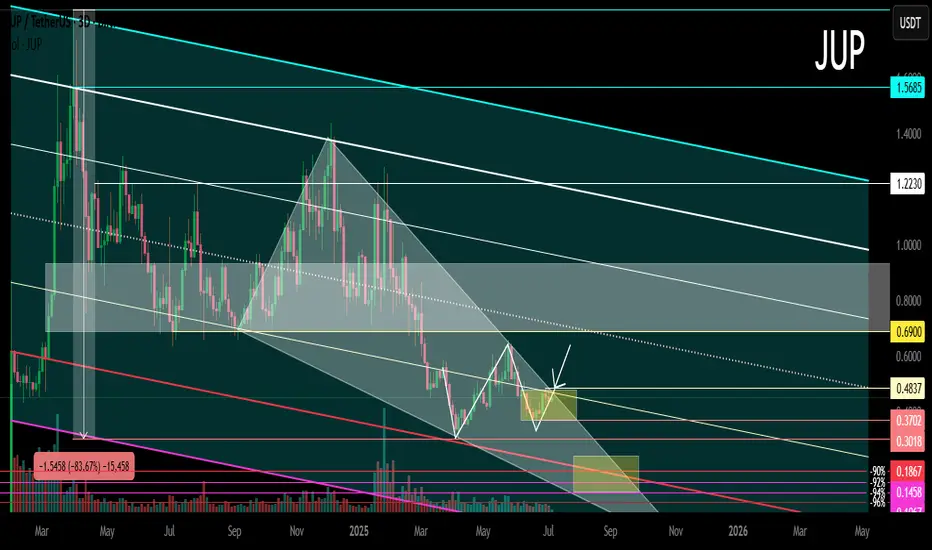
JUP Main trend. Channel. Wedge. Double bottom. 06 07 2025Logarithm. Time frame 3 days. Decline from the maximum -84% (this is not enough), but given the capitalization of 59th place, if the market is positive in the near future, then it is quite possible to reverse this cryptocurrency through a double bottom.
All long-term consolidation above with high v
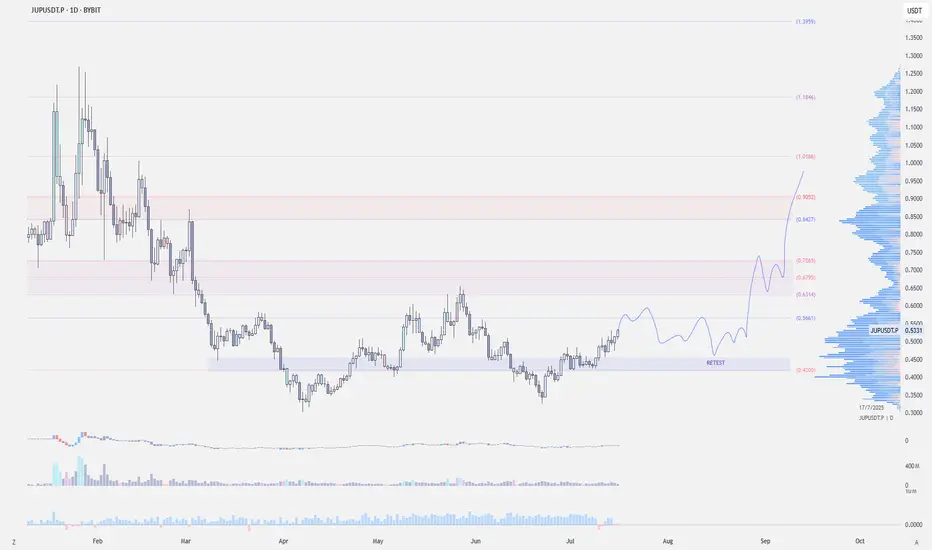
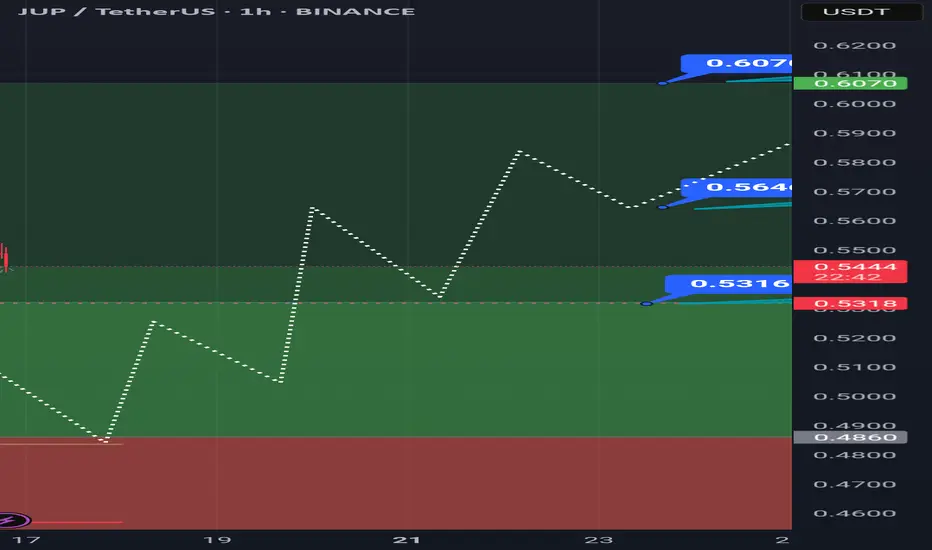
$JUP - Long Trade IdeaBINANCE:JUPUSDT | 1D
Entry: .53 to .50
Stoploss: .477 (prev low)
Initial target .57–.60, if we get a strong rejection here, take full profit and look to re-enter on a retest around .47–.45
TPs:
.57-.60
.67-.72
.82-.90
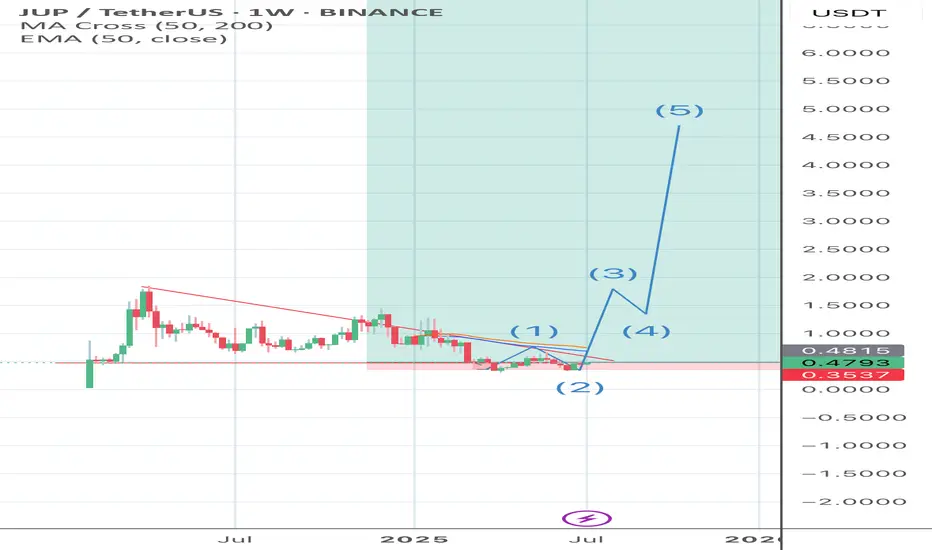
Jupiter long Jupiter has been one of the best exchanges in the solana space.
Seeing big potential here with juplend coming out very soon. It’ll be like the place that degens go borrow liquidity.
I think 5$ is a reasonable goal here.
They also gave away a billion dollars and are trying to actively build the
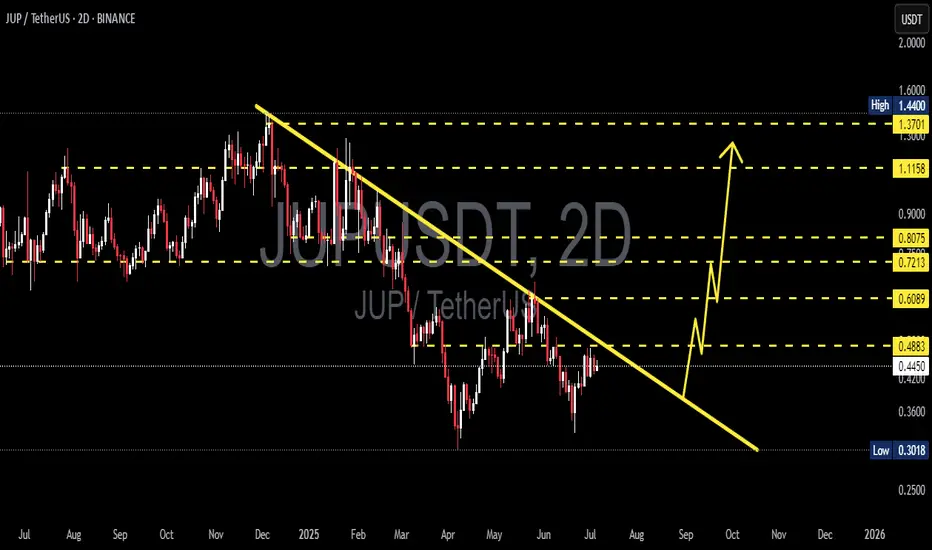
JUP/USDT – Massive Breakout Brewing? Falling Wedge Reversal🧠 Detailed Technical Analysis:
Jupiter (JUP) is currently forming a classic bullish reversal pattern – the Falling Wedge – after months of consistent downward pressure. Since December 2024, JUP has been trending inside a narrowing range of lower highs and lower lows, and it's now approaching a pote
JUPUSDT BullishSorry Guys ,i don't know why they removed my idea , so now Congratulations it achieved the first TP1 🔥💫 and it is Close to the second TP2
اسف يا شباب لان التحليل اختفى ، أنا لا اعرف لماذا تحليلي اختفى من المنصة ، لذا تهانينا الآن أنها حققت أول TP1 🔥💫 وهي قريبة من TP2 الثاني
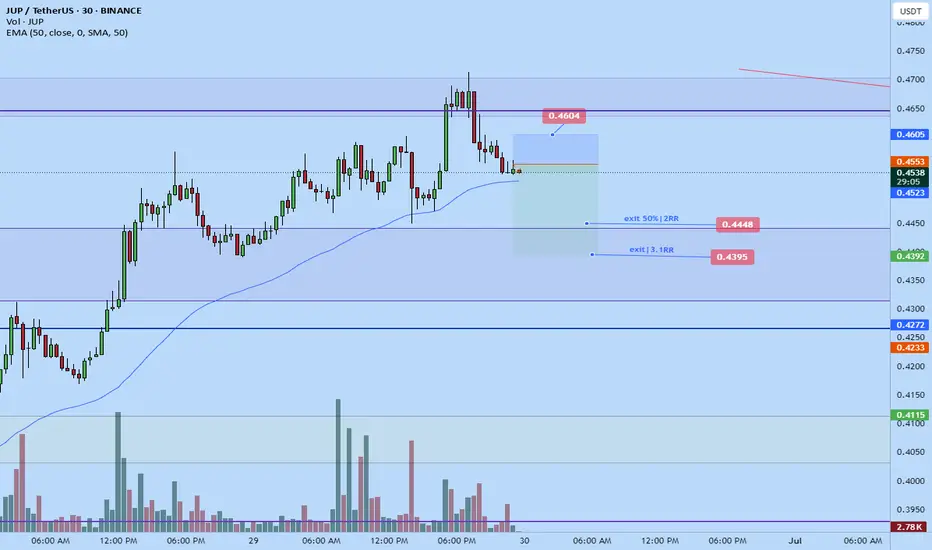
Jupiter short to 0.4395Opened a short position on Jupiter short not too long ago. The market been trending up but right now its quite high and likely to correct back down a bit before continuation.
DTT setup
2-3RR
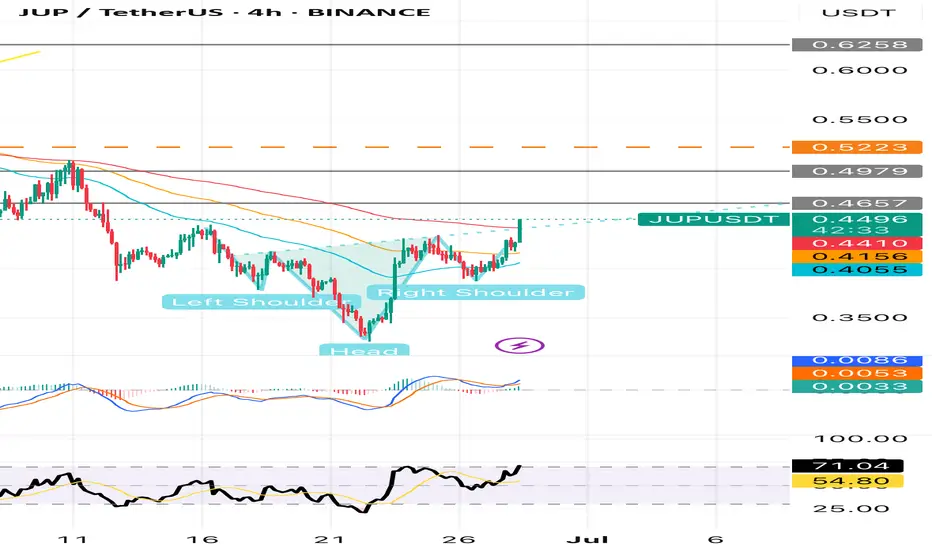
JUP BULLISH PATTERNShoulder Head Shoulder in the rising at 4h.
BTC is showing is still bullish run which could lead to altcoins going bullish as well.
JUP has confirm it, However at 6pm we could wait for another confirmation.
1D it shows a Double Bottom which it confirms the Bullish pattern for JUP.
1D it seems it cou
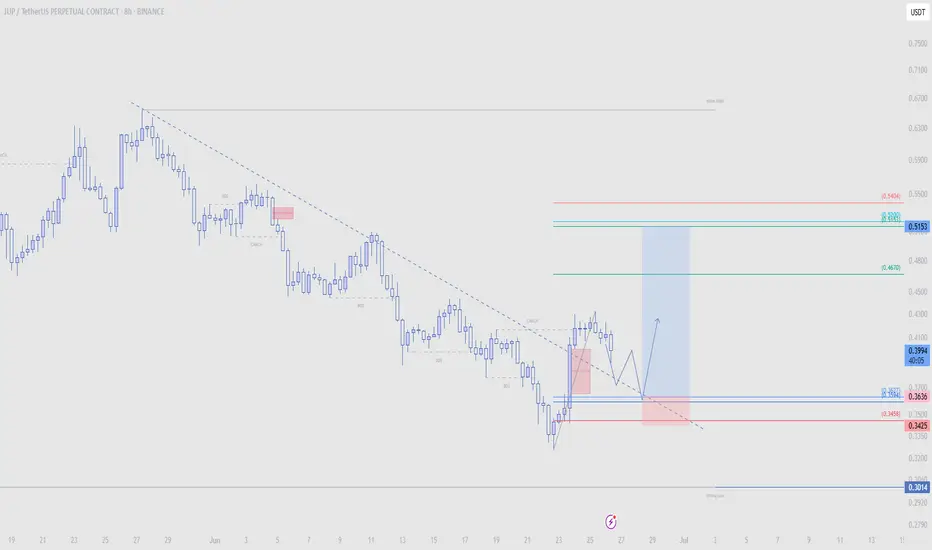
JUPUSDT Retests Breakout Zone: Rally Ahead?JUPUSDT has broken its downtrend and is now in a retest phase, which could lead to a continuation of the bullish move. If the support area holds, there’s potential for upward momentum to resume. Traders are watching this zone closely as a possible entry point, with bullish structure still intact and
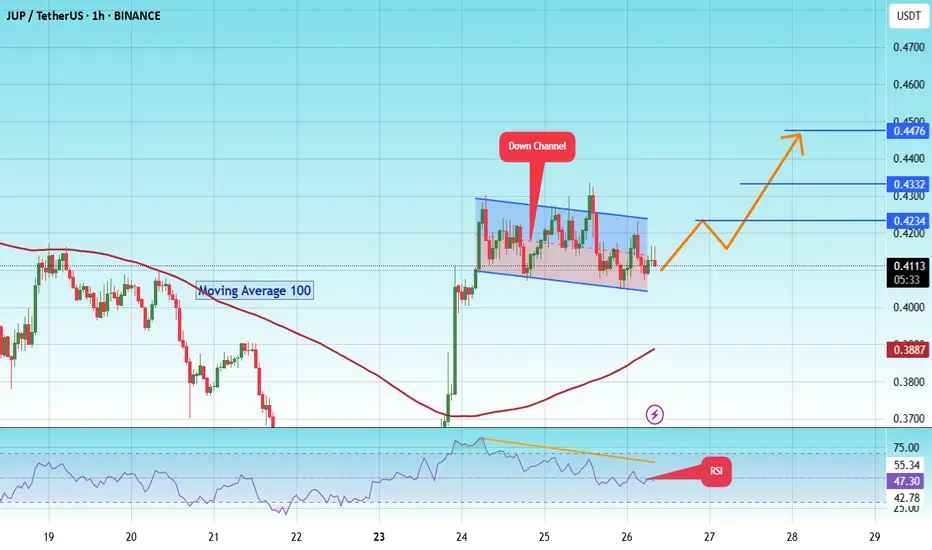
#JUP/USDT#JUP
The price is moving within a descending channel on the 1-hour frame and is expected to break and continue upward.
We have a trend to stabilize above the 100 moving average once again.
We have a downtrend on the RSI indicator, which supports the upward move by breaking it upward.
We have a s
JUPUSDT 1D#JUP is currently trading inside a descending channel on the daily chart.
A breakout above the channel resistance and the MA50 could trigger strong bullish momentum.
If confirmed, the targets are:
🎯 $0.5733
🎯 $0.7366
🎯 $0.8709
🎯 $1.0052
🎯 $1.1964
⚠️ Always use a tight stop-loss to manage risk and

See all ideas
Summarizing what the indicators are suggesting.
Oscillators
Neutral
SellBuy
Strong sellStrong buy
Strong sellSellNeutralBuyStrong buy
Oscillators
Neutral
SellBuy
Strong sellStrong buy
Strong sellSellNeutralBuyStrong buy
Summary
Neutral
SellBuy
Strong sellStrong buy
Strong sellSellNeutralBuyStrong buy
Summary
Neutral
SellBuy
Strong sellStrong buy
Strong sellSellNeutralBuyStrong buy
Summary
Neutral
SellBuy
Strong sellStrong buy
Strong sellSellNeutralBuyStrong buy
Moving Averages
Neutral
SellBuy
Strong sellStrong buy
Strong sellSellNeutralBuyStrong buy
Moving Averages
Neutral
SellBuy
Strong sellStrong buy
Strong sellSellNeutralBuyStrong buy
Displays a symbol's price movements over previous years to identify recurring trends.