TradeCityPro | KAS Ranges Near Top with Bullish Momentum Rising👋 Welcome to TradeCity Pro!
In this analysis, I want to review the coin KAS for you. It’s one of the Layer One projects, and its token currently ranks 40 on CoinMarketCap with a market cap of 2.35 billion dollars.
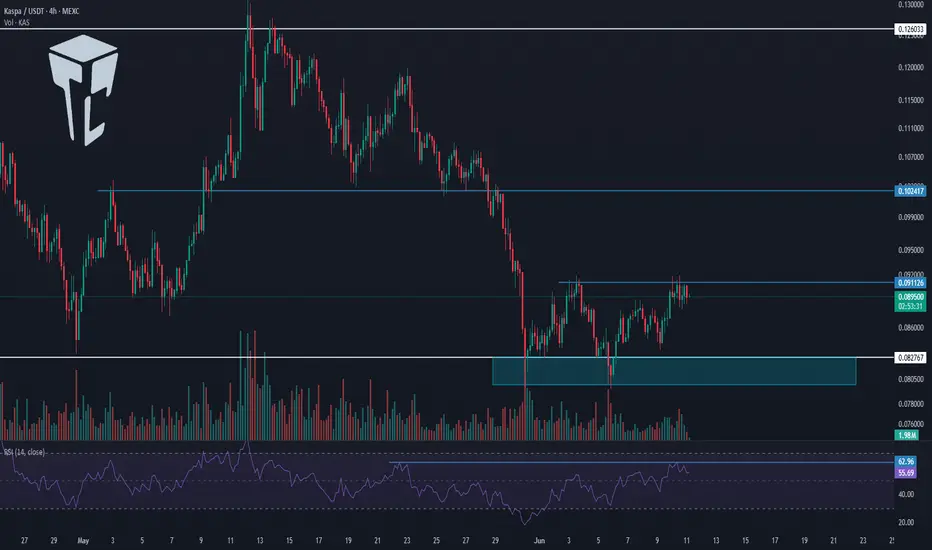
⏳ 4-Hour Timeframe
On the four hour timeframe, the price is moving inside a range box
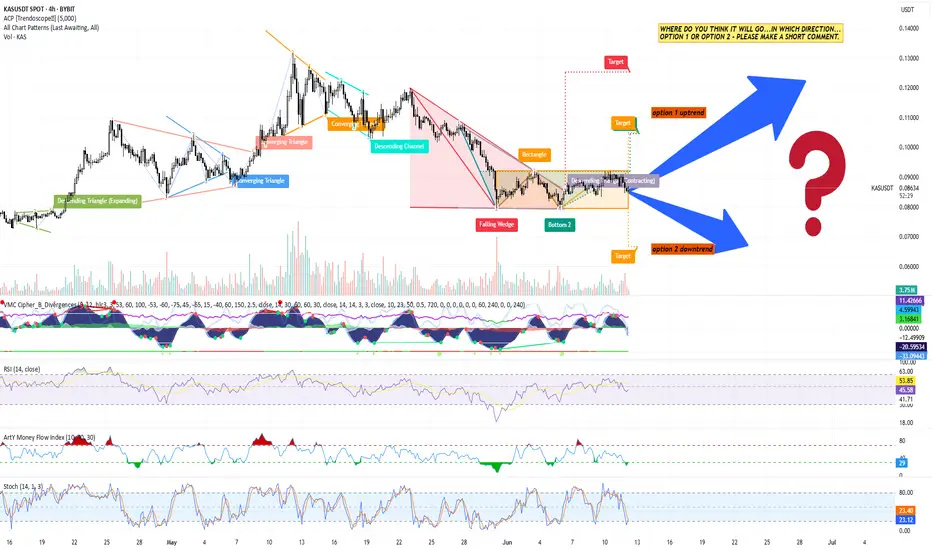
KAS-USDT (Bybit spot), 4-hour candles TA+Trade plan1. Market context & chart structure
Asset / venue / timeframe: KAS-USDT (Bybit spot), 4-hour candles, data to 12 Jun 2025 06:45 UTC (see image).
Primary pattern in play: Price has compressed into a contracting (symmetrical) triangle that began after the 28 May low. The apex is only ~1–2 candles a
KAS AccumulationI am looking for an distribution model 1 to complete a bigger accumulation model 1 or 2 on KAS.
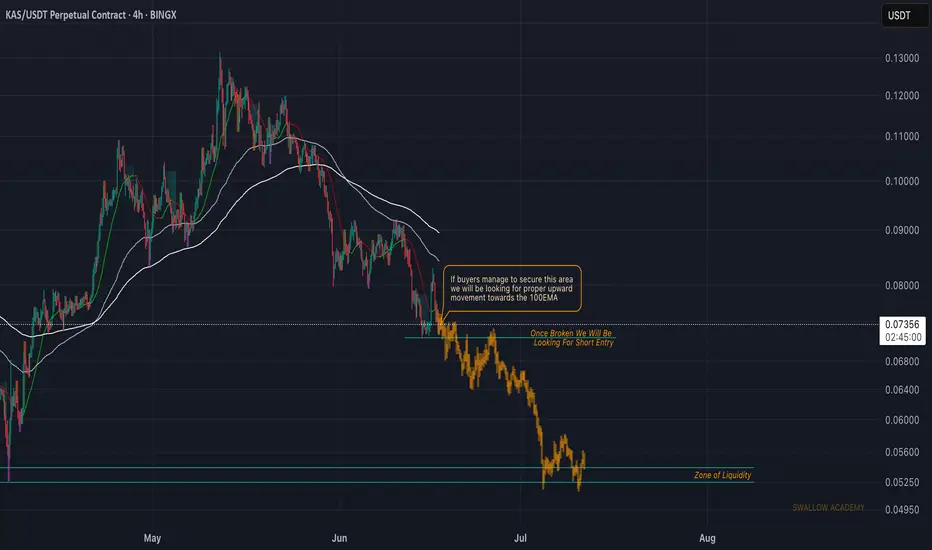
Kaspa (KAS): Seeing Possibility of Break of StructureKaspa coin struggles to have a proper buyside volume, where sellers are showing strong dominance currently, which could lead us to BOS and nasty movement to lower zones (and by nasty I mean big red candle).
Swallow Academy
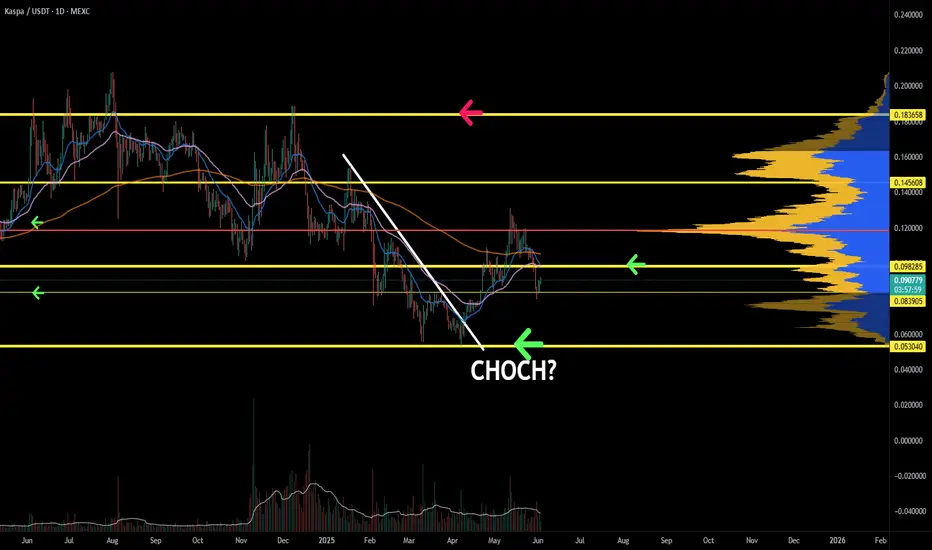
Kaspa reversal here is necessary. CHOCH incoming?KAS is slowly building a structure. This support here is very necessary, without it, a continued downtrend would stress liquidity levels below. Momentum and trend oscillators seem to have a bit more negativity left to make the price fall more; however, as the price reaches closer to invalidation, RR
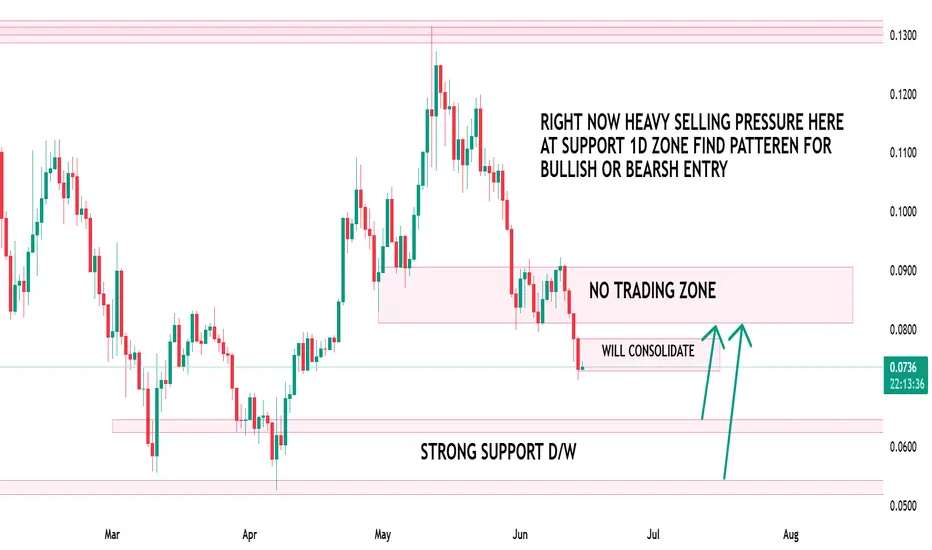
KAS 0.53 ZONE IS BEST SUPPORTBINANCE:KASUSDT.P is right now facing heavy selling pressure, should plan at 0.052-0.054 zone, not a financial advise, DYOR
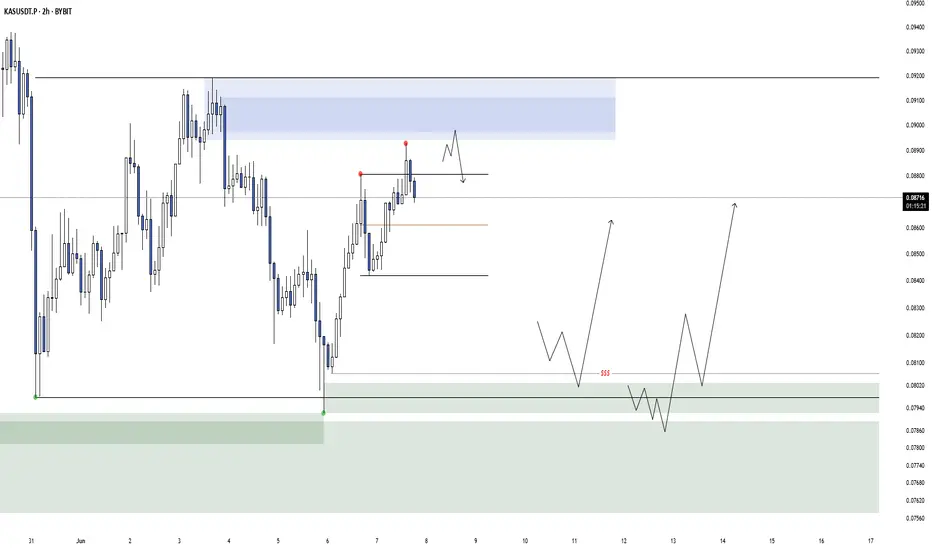
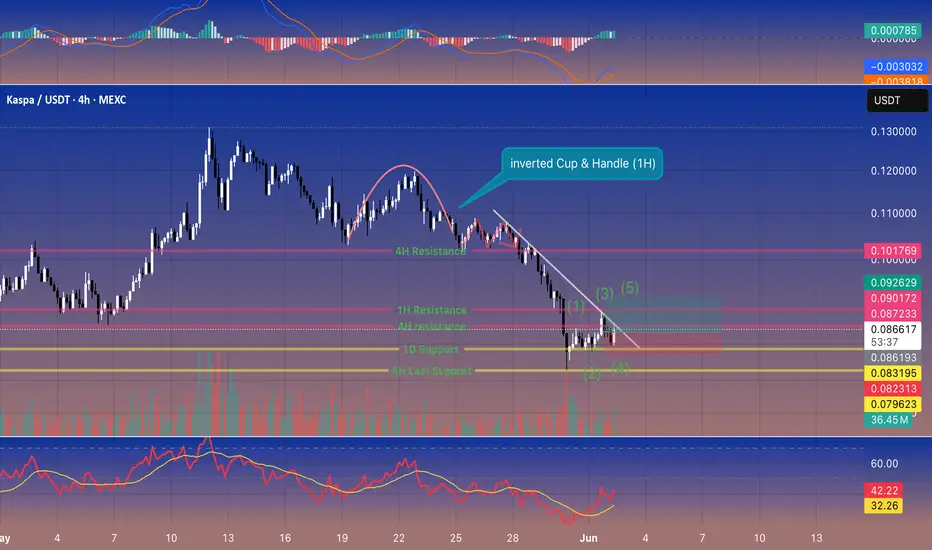
KAS/USDT Analysis (4H/1H)1️⃣ 🟢 KAS/USDT
KAS/USDT found a bottom at 0.0831 USDT and is now tracing a quick five-wave rally. A clean 4H candle close above 0.0875 USDT flips the bias bullish. First target: 0.0901 USDT. 🚀✨
2️⃣ Wave Structure
• Wave (1) peaked near 0.0872 USDT
• Wave (2) held at 0.0831 USDT (strong flip)
• Wav
TECHNICAL ANALYSIS – KASPA/USDT (Daily Chart) + TRADE PLANTECHNICAL ANALYSIS – KASPA/USDT (Daily Chart)
Chart Pattern & Price Action:
Descending Channel (Falling Wedge): KASPA has been trading within a falling wedge pattern, typically a bullish reversal setup.
Breakout Zone Approaching: Price is currently testing the upper resistance of the wedge (~$0.
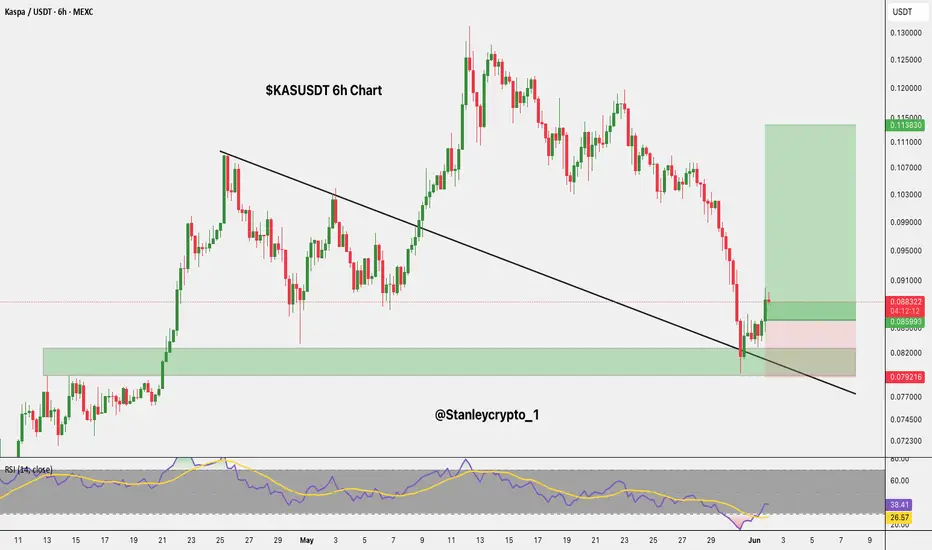
$KASUSDT Breaks Trendline CRYPTO:KASUSD Breaks Trendline
Kaspa KASUSDT has broken out of the downtrend and bounced strongly from the key support zone.
Price reclaimed the demand area and is now aiming for the $0.114060 resistance.
As long as it holds above $0.085916, the bullish setup remains valid. Invalidation is bel
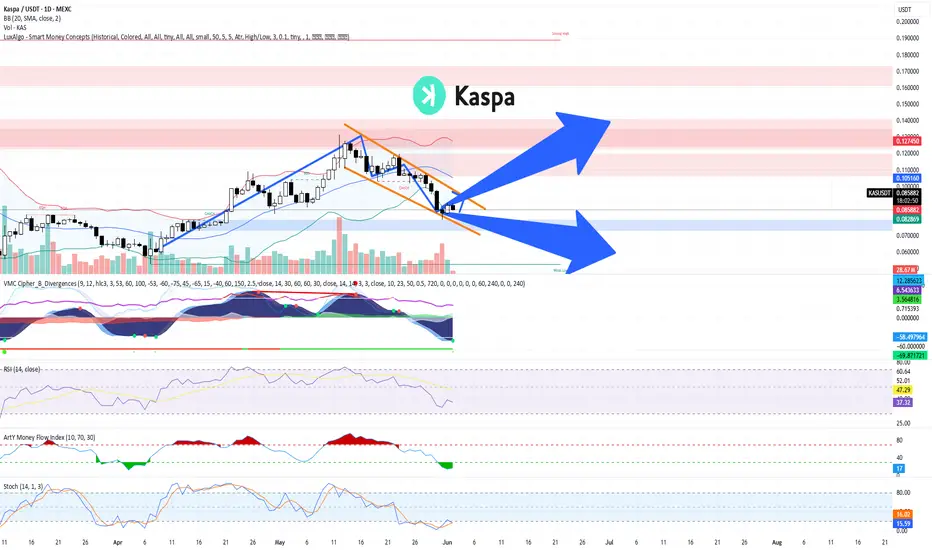
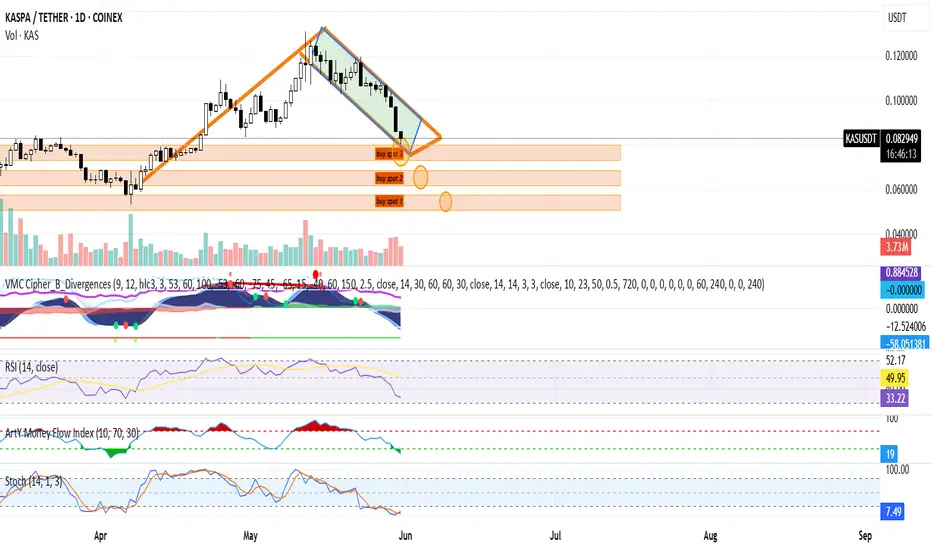
Technical Analysis – KASPA/USDT (1D) + spot trade planTechnical Analysis – KASPA/USDT (1D)
Trend Structure & Price Action
KASPA experienced a strong bullish rally (highlighted in orange) starting in mid-April, followed by a descending channel (bullish flag) correction (highlighted in green).
Currently, the price is approaching major support zones,
See all ideas
Summarizing what the indicators are suggesting.
Oscillators
Neutral
SellBuy
Strong sellStrong buy
Strong sellSellNeutralBuyStrong buy
Oscillators
Neutral
SellBuy
Strong sellStrong buy
Strong sellSellNeutralBuyStrong buy
Summary
Neutral
SellBuy
Strong sellStrong buy
Strong sellSellNeutralBuyStrong buy
Summary
Neutral
SellBuy
Strong sellStrong buy
Strong sellSellNeutralBuyStrong buy
Summary
Neutral
SellBuy
Strong sellStrong buy
Strong sellSellNeutralBuyStrong buy
Moving Averages
Neutral
SellBuy
Strong sellStrong buy
Strong sellSellNeutralBuyStrong buy
Moving Averages
Neutral
SellBuy
Strong sellStrong buy
Strong sellSellNeutralBuyStrong buy
Displays a symbol's price movements over previous years to identify recurring trends.