POTENTIAL LONG FOR KASPA (KAS)Timeframe: 1-Day and Weekly Charts
Current Price: $0.097946 (as at July 29, 2025)
Pattern Analysis:
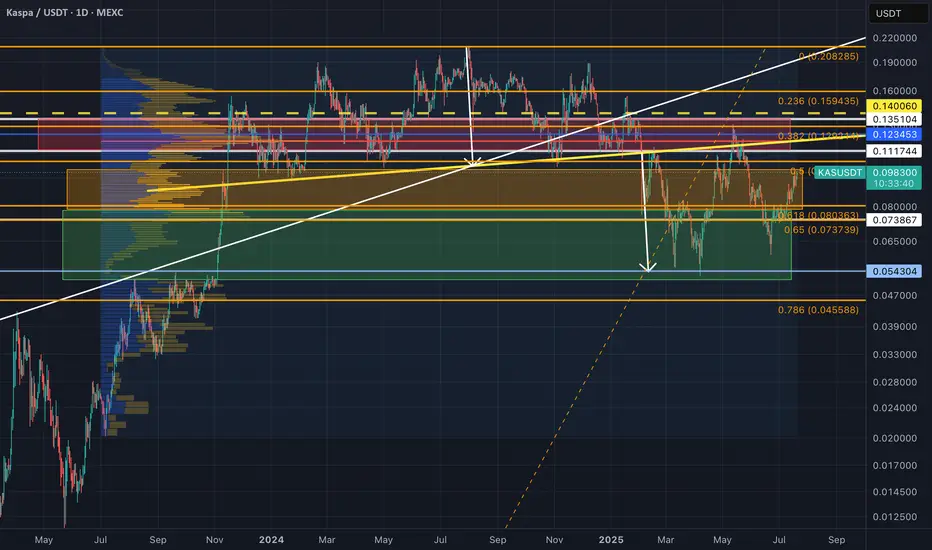
Weekly Chart: Potential double bottom pattern with lows at $0.0527 and $0.0545, and neckline resistance at $0.098995. Current price of 0.0979 is testing this neckline. A breakout above $0.0990 wi
Related pairs

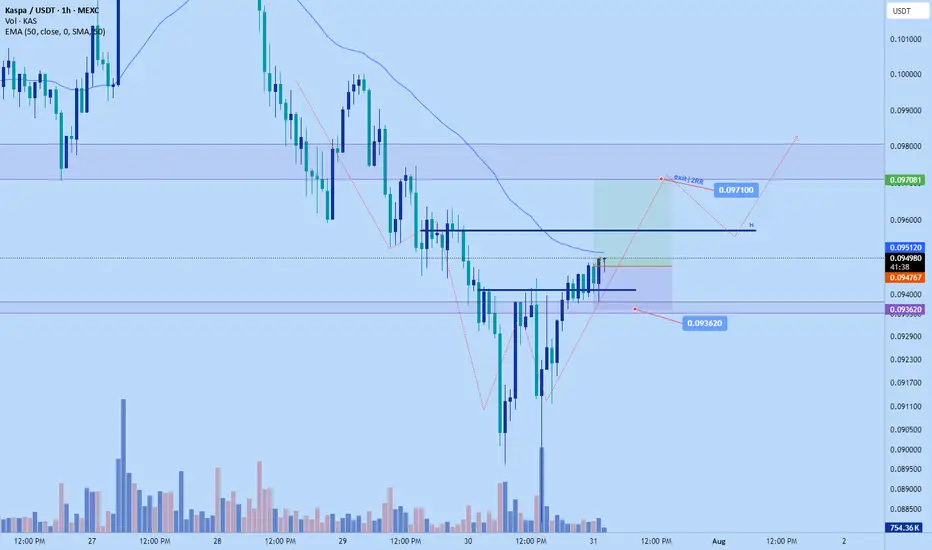
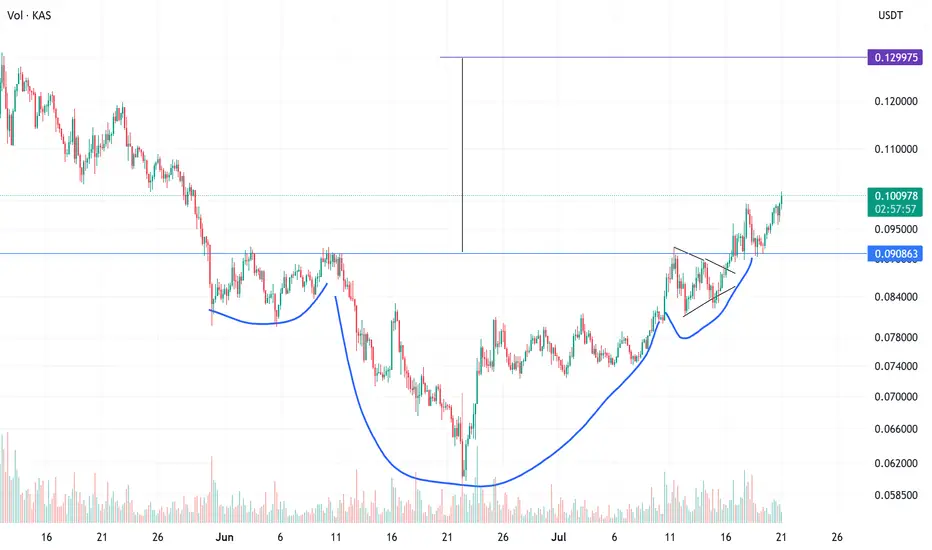
Kas scalp long to $0.0971Just now opened a long position on Kas. Based on the bulls are gaining control right now and the price is relatively low on htf
Setup aligns wit my DTT strategy
Sl: $0.093620
Time sensitive.
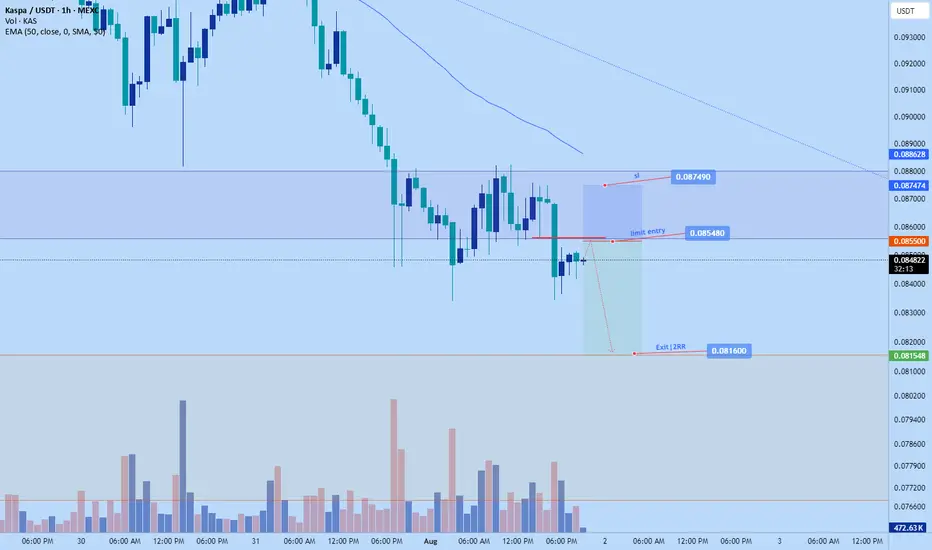
Kas short to $0.0816Just now opened a short on KAS.
Sl: $0.08749
limit entry: $0.08548
Tp: $0.0816
Risk to reward: 1:2
DTT analysis applied - learn more on X
Kas short to $0.10226Just now opened up a short position on Kas. I think structurally the market is high and likely to correct down a bit more before continuation to the upside
Sl: $0.106690
TP: $1.102841-$0.102263

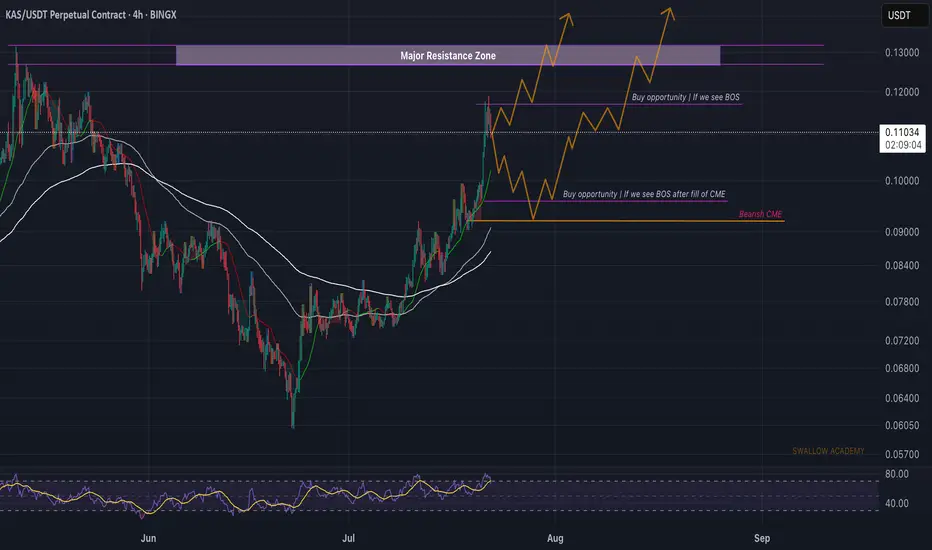
Kaspa (KAS): Looking For Break of Structure, Here or Near CMEKaspa looks pretty bearish right now, possibly going for that MSB currently, but despite that, as we are overall in a bullish trend, we are going to look for buyside movement and trading opportunities here.
So we detected 2 zones for us, one slightly above the current market price and another near
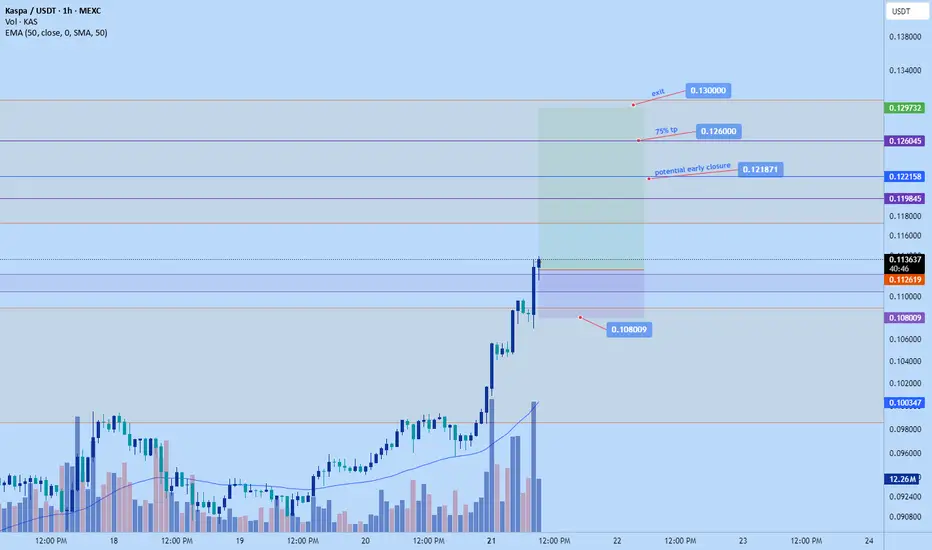
Kasusdt long to $0.13Just hopped into Kas long. Its been ripping today. Caught it late but still have good stop and the move hasn't reach target yet.
time sensitive
Sl: $0.108... can chance a tigher stoploss at your own risk. Its been pushing quite impulsively so might not correct big if happens.
Tps on chart
Very simple strat using 15min and 90 min PARVery simple strat using 15min and 90 min PAR. Mainly for scalping trades takling 1-6 hrs

KASPA | Back in Trading RangeKASPA is back in the trading range, presenting a potential bullish setup after flipping the long-term resistance around $0.094 into support. This flip represents a significant technical milestone that often precedes major upward moves.
Key Observations:
Successfully converted major resistance at
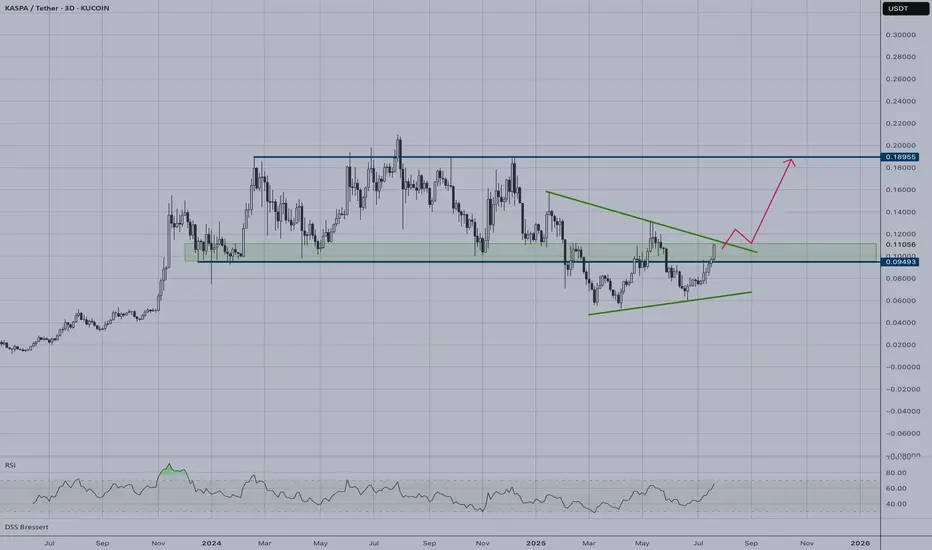
iH&S Triggered and moving to send KAS to 0.13Technical pattern iH&S has triggered with a target 0.13.
Last chance to reaccumulate Kaspa while it is below 10 cents?Second chance to accumulate CSE:KAS at below 10 cents after its correction down to 5 cents from its 20 cents ATH is coming to an end?
Previously, technicals looked great for CSE:KAS (and other ALTs too) with a breakout from a cup-&-handle pattern in July/Aug2024, but market says otherwise with
See all ideas
Summarizing what the indicators are suggesting.
Oscillators
Neutral
SellBuy
Strong sellStrong buy
Strong sellSellNeutralBuyStrong buy
Oscillators
Neutral
SellBuy
Strong sellStrong buy
Strong sellSellNeutralBuyStrong buy
Summary
Neutral
SellBuy
Strong sellStrong buy
Strong sellSellNeutralBuyStrong buy
Summary
Neutral
SellBuy
Strong sellStrong buy
Strong sellSellNeutralBuyStrong buy
Summary
Neutral
SellBuy
Strong sellStrong buy
Strong sellSellNeutralBuyStrong buy
Moving Averages
Neutral
SellBuy
Strong sellStrong buy
Strong sellSellNeutralBuyStrong buy
Moving Averages
Neutral
SellBuy
Strong sellStrong buy
Strong sellSellNeutralBuyStrong buy
Displays a symbol's price movements over previous years to identify recurring trends.
Frequently Asked Questions
The current price of KAS/TETHERUS (KAS) is 0.08358 USDT — it has fallen −0.40% in the past 24 hours. Try placing this info into the context by checking out what coins are also gaining and losing at the moment and seeing KAS price chart.
KAS/TETHERUS price has fallen by −12.87% over the last week, its month performance shows a 11.23% increase, and as for the last year, KAS/TETHERUS has decreased by −58.05%. See more dynamics on KAS price chart.
Keep track of coins' changes with our Crypto Coins Heatmap.
Keep track of coins' changes with our Crypto Coins Heatmap.
KAS/TETHERUS (KAS) reached its highest price on Aug 1, 2024 — it amounted to 0.20780 USDT. Find more insights on the KAS price chart.
See the list of crypto gainers and choose what best fits your strategy.
See the list of crypto gainers and choose what best fits your strategy.
KAS/TETHERUS (KAS) reached the lowest price of 0.05266 USDT on Apr 7, 2025. View more KAS/TETHERUS dynamics on the price chart.
See the list of crypto losers to find unexpected opportunities.
See the list of crypto losers to find unexpected opportunities.
The safest choice when buying KAS is to go to a well-known crypto exchange. Some of the popular names are Binance, Coinbase, Kraken. But you'll have to find a reliable broker and create an account first. You can trade KAS right from TradingView charts — just choose a broker and connect to your account.
Crypto markets are famous for their volatility, so one should study all the available stats before adding crypto assets to their portfolio. Very often it's technical analysis that comes in handy. We prepared technical ratings for KAS/TETHERUS (KAS): today its technical analysis shows the sell signal, and according to the 1 week rating KAS shows the sell signal. And you'd better dig deeper and study 1 month rating too — it's neutral. Find inspiration in KAS/TETHERUS trading ideas and keep track of what's moving crypto markets with our crypto news feed.
KAS/TETHERUS (KAS) is just as reliable as any other crypto asset — this corner of the world market is highly volatile. Today, for instance, KAS/TETHERUS is estimated as 6.85% volatile. The only thing it means is that you must prepare and examine all available information before making a decision. And if you're not sure about KAS/TETHERUS, you can find more inspiration in our curated watchlists.
You can discuss KAS/TETHERUS (KAS) with other users in our public chats, Minds or in the comments to Ideas.