KASPA $KASCRYPTOCAP:KAS enjoys the peace and quiet around him until it starts pumping again. Many people are anxious because they have bought higher and are now doubting or selling. This will be a fatal mistake looking forward. This will test the longest support line until it is time to send the thing to the moon. Our first overriding target in the next 2 months is clearly $0.60.
KASUSDT trade ideas

Valuezone 5cThe fair value and demandzone is around 5c. It only needs 3-4 weeks to do it. The reason for this extreme 70% drop is because of how the supply is distributed. We have about 1000 people owning 70% of the supply. Good luck to the bagholders

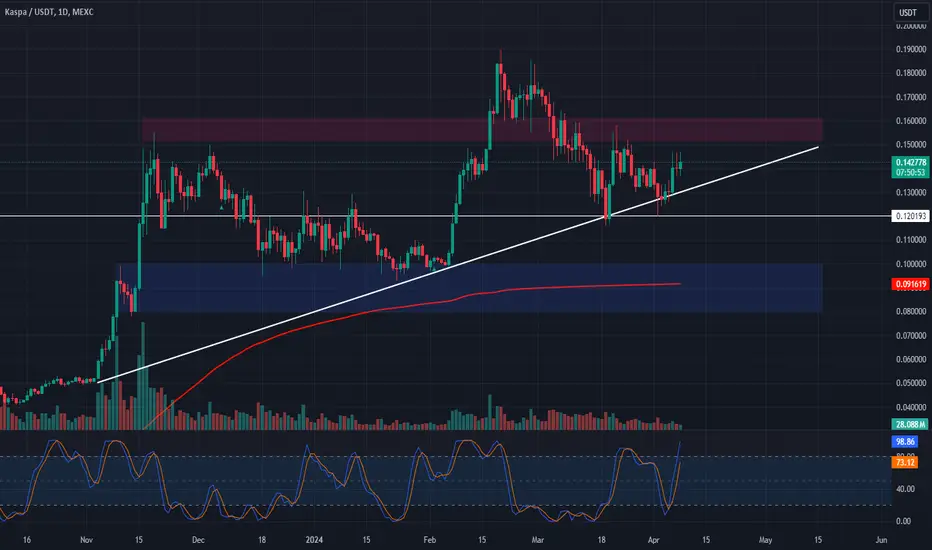
One more Pulldown until we have another Rally to the Upside Price is currently ranging around 12/13 cents as we speak, 13.9/14.5 cents is a huge area of resistance, price would most likely react to that zone than continue going down until we reach 0.09/0.093 cents, after that price should continue going to the upside breaking ATH

🔄💱 KAS Trade Plan! 💱🔄📊 Analysis:
Support Reaction: KAS has demonstrated a positive response at the $0.12500 support level, accompanied by a structural change on lower timeframes.
Entry Range: Consider entering the trade between $0.12 to $0.13, aligning with the current support or look for lower support around $0.10.
Profit Targets: Target profits at $0.155 or $0.25, representing potential resistance levels.
Risk Management: Implement effective risk management strategies to protect against potential losses.
📈 Trading Strategy:
Entry: Initiate a long position within the specified entry range based on support levels.
Targets: Take profits at the identified resistance levels of $0.155 or $0.25.
Risk Control: Employ appropriate risk mitigation measures, such as stop-loss orders, to manage downside risk effectively.
🚨 Note: Stay vigilant and adapt your approach as market conditions evolve! 📊🔍 #KAS #TradingPlan #CryptoAnalysis 🌟📈

KASPA Before you LONG, read this.This is one of the coins that I talk to my members for a long setup, but.. People are simply used to this coin that the price goes up non-stop, with certain corrections.
But the same pattern emerged before this impulse(Nov-DEC. 2023).
Wait for the zone to confirm it, because if we look at the chart we will see the first testing of the distribution on March 7 and then again. Then on March 15th there is a price break of 0.14 and a retest twice and a rejection? Wait for it to leak, do not engage in manipulations.. When the structure shows the first signs, a HIGH top, then a small correction that holds the price, we can entry.
The chart shows the zones I am looking at.
All this is valid only if 0.13 drops.

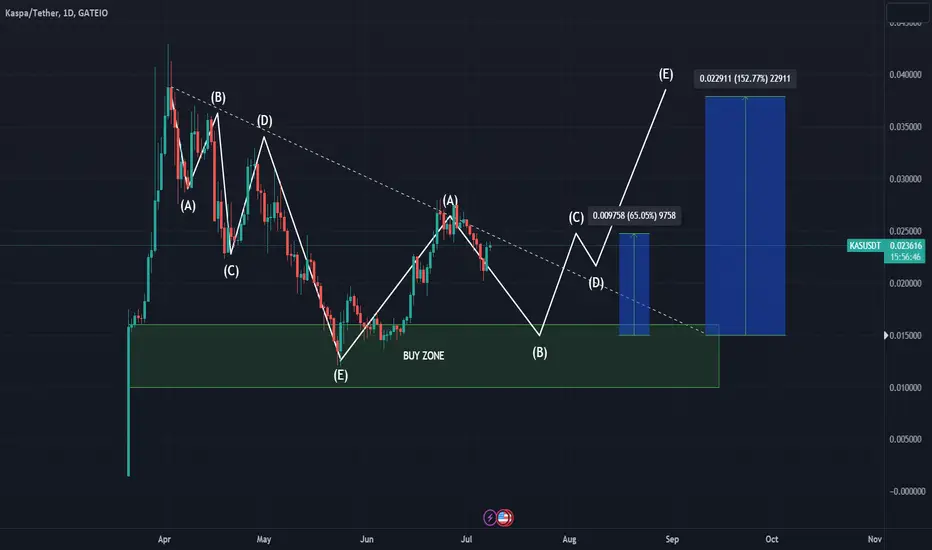
Layer 1 ... Open Source We all Know Layer Potential. KASPAOn the Day time frame wait for the pattern formation to complete and touch the buy zone. Long term hold potential or short term swing trade. A quiet project making silence moves. Still early.
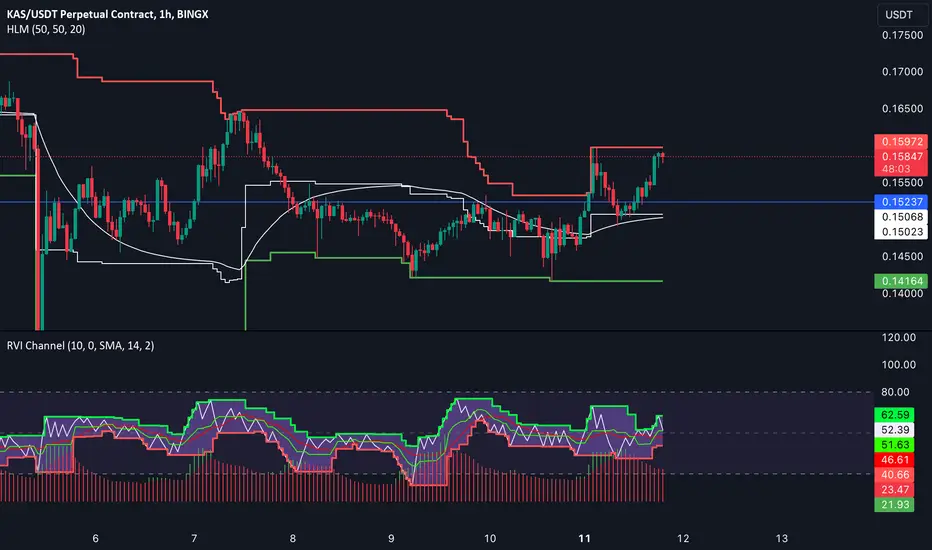
Next leg up for Kaspa before testing top of channelDue to the solid build up, I'm expecting the next move for Kaspa to reach close to the top of the channel around $0.153. This may test and retest or break straight through for much higher gains.

🐺 double bottom formation for KAS ? 🐺Hello my friends ! 🐺
As you can see in the chart , in the higher time frame , KAS is in the ascending channel but in the last couple of weeks kas is in the correction phase , so in my opinion based on the ascending channel which we are testing it right now , and this current W pattern formation we could expect a trend reversal for KAS and expect continuation of the up trend .

🔄 KAS Analysis Update 📈🔍📊 Key Insights:
Consolidation Phase: KAS has been consolidating above $0.12, indicating a potential bottom formation.
Higher Low Formation: Setting a higher low at $0.127 suggests a positive trend continuation.
Trend Continuation: Expectations of a trend continuation to all-time highs (ATHs) if price gains acceptance above $0.16.
Position Building Strategy: Watch for indications of a trend shift and build positions on higher lows.
📈 Trade Plan:
Entry: Initiate trades between $0.13 to $0.14500, focusing on higher lows.
Take Profit: Target take-profit levels around $0.25 or $0.35, aiming for potential upside.
Stop Loss: Set stop loss if price loses support at $0.12, managing downside risk.
📈🔍 Outlook: With a strategic entry approach and potential for trend continuation, KAS presents an opportunity for traders to capitalize on the anticipated price movement. 🚀📊 #KAS #TradeOpportunity
$Kas king of the cup and handle Will CRYPTOCAP:KAS hit the third cup and handle in a row?
It did it previous 2 times
will history repeat?
Chart tells it will

Current KAS FRACTAL I took SIAM Kidds Fractal chart played out and tried to project where we are now and I think I have identified a buying opportunity for the next 7-10 days before a major pump

KAS Set upSetting up to break the upper trendline. Similar to previous break. Will follow and provide some daily udpates.
Thanks for reading. Cheers

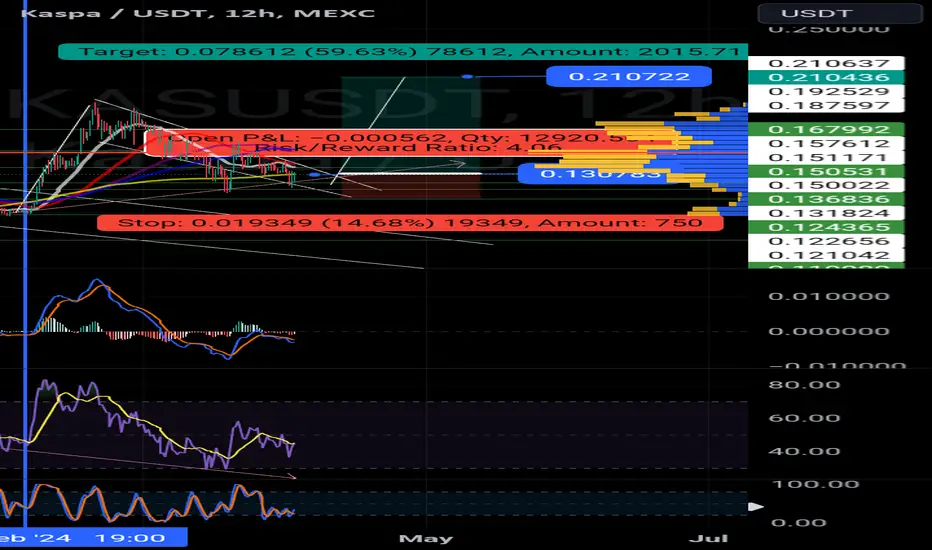
KaspaPotential hidden bullish still in play
Falling wedge/flag
Potential to hit .21
Stochastics has gas ⛽️
Has space to move up
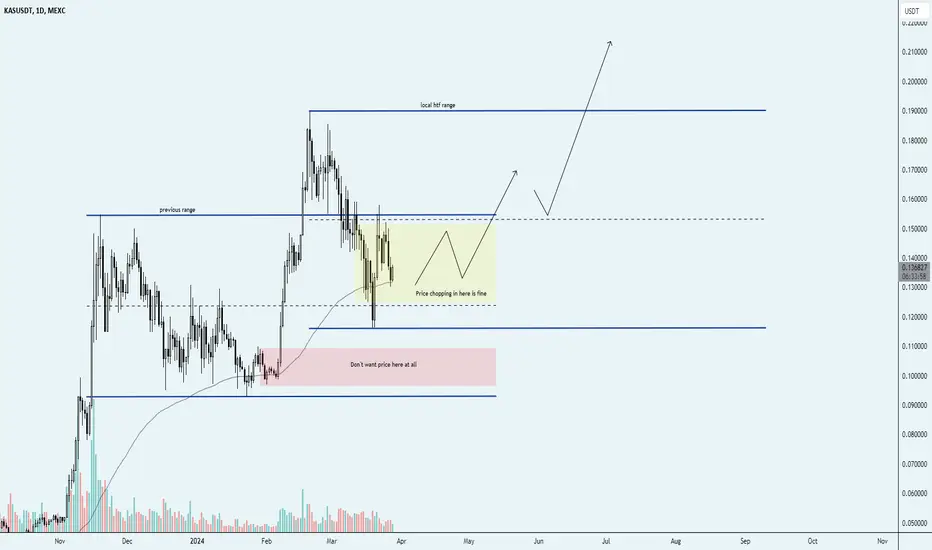
KASPA is going so much higher imoNotes on chart, but I've been watching this beast for months now and it has shown massive relative strength time and time again.
Absolutely going higher in my opinion, bullish high time frame price structure. Maintaining HL's and still within its local range.
I do like to note the previous range as well as I think it has some influence still.
Reclaim above yellow though and it is game on friends.
KAS should be a top performer this run.
Vatsik
✴️ Kaspa | Advanced Trading Tips RevealedKaspa (KASUSDT) is one of the best performing pairs in the Cryptocurrency space and for this we advise, caution.
➖ There are many different approaches we can use to trade Cryptocurrencies.
➖ There are many different methods we can employ to read charts.
➖ There are many great tools available for us to use but, when it comes to the pairs, which ones will you choose?
We looked at Kaspa a month or so ago and we said, "No!" Based on the chart.
The reason is that the pair had already grown too much.
Even if it keeps on growing, the growth would be minimum compared to the potential growth other pairs trading at bottom have to offer.
➖ KASUSDT produced a pick November 2023.
I did a small retrace and sideways consolidation and then a new high.
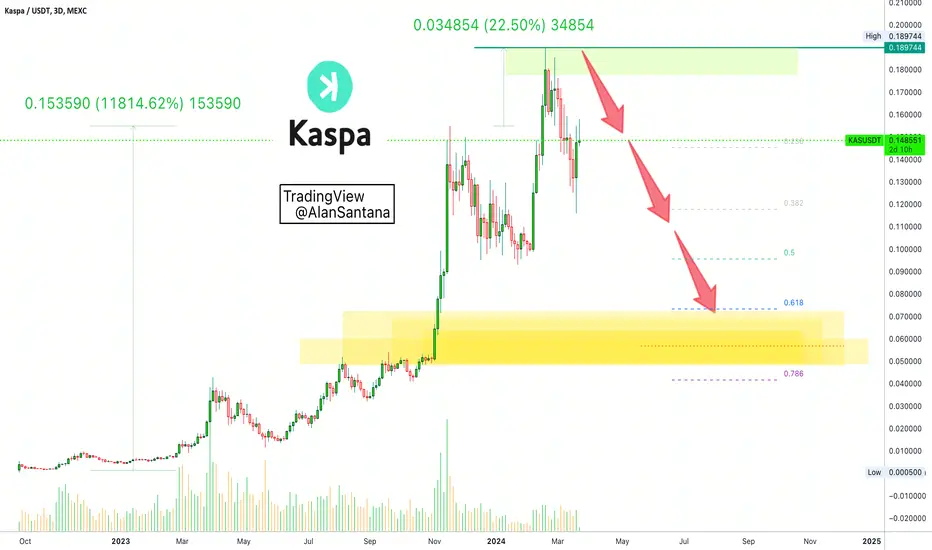
Here is the thing, from peak to peak, November 2023 vs February 2024, Kaspa (KASUSDT) grew less than 23%. It took the pair more than four months to achieve this milestone.
At this same time, hundreds and hundreds of pairs grew between 100% and 900%. Some pairs grew 1,000%, 2,000%, 3,000%, 4,000%, etc.
Why is this?
Because Kaspa had already grown by 11,800%+ between October 2022 and November 2023, so there isn't much room left for additional growth.
As for the bearish side, there is plenty of room available for prices to drop.
Pairs like this, we look at them for selling/short or taking profits.
➖ When prices are high up, we either stay away or sell, regardless of the pair.
➖ When prices are down, we look to buy and hold long-term, until the bullish action develops and pays up. When prices are high, we sell and collect profits multiplying our Bitcoins. Wait for the Bitcoin wave and sell Bitcoin at the top.
➖ With the Altcoins you can multiple your BTC.
➖ With BTC you can multiple your USD.
➖ With USD you can buy your lambo, your jet, your yatch, your mansion, your beach.
But it can take lots of hard work and dedication...
Are you ready for a challenge?
Do you believe you too can win?
Trading can be profitable and fun but not necessarily easy.
Trading can be done if approached in the right away.
It is easy to win trading Cryptocurrency if you read everything we have to say.
Thanks a lot for your continued support.
There are endless opportunities, there is no need to rush.
Thanks a lot for reading again.
I hope to count with your continued support.
Remember, I am with you for the long-term.
Namaste.
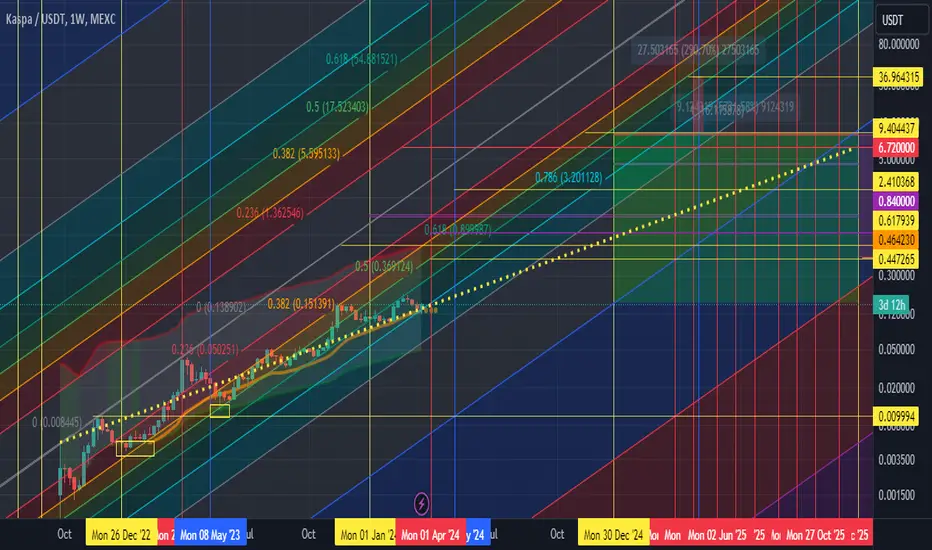
Kaspa macro price flow for 2024/2025By simply drawing a straight dotted line through all the indicators and Fibonacci zones along with the Beam band etc...... we can see that this protocol is a unique one in that it follows the Bitcoin protocol very similarly in pattern and sequence. Both have similar mining protocols and both have similar inflation and deflation algorithms. Both have the same consensus type of objectives although Bitcoin has lost its original purpose with a P2P consensus and this is where Kaspa comes in for the rescue, globally. This dotted line takes us into this green box area by the 2025 calendar year. Now, we can move between this dotted line on either the top or bottom. Price will be determined between this line which can be very volatile at times. I am guessing we can see between $6 on the top side verses $2 on the bottom.
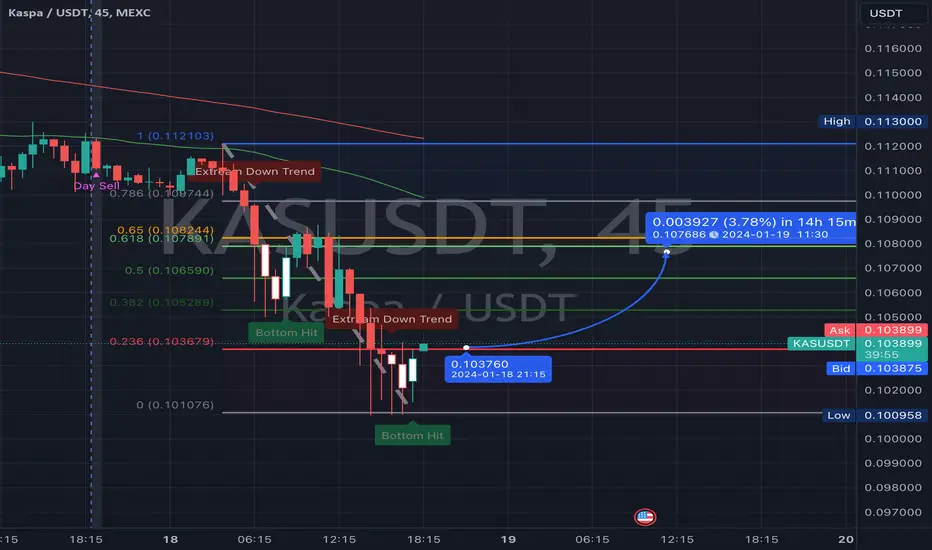
3% increase from bottom touch within next 24hrs?Based on the analysis of the previous price movements and the current market trends, KASUSDT seems to be exhibiting a pattern of short-term upward movement followed by a subsequent drop. The Fibonacci retracement tool has been applied to the 45-minute candles, and it indicates a 3% uptrend before the expected drop. However, market predictions are not always accurate, and it is essential to keep an eye on the market conditions for any sudden changes.
Getting to a Quick Scalp with x5 Lev.
KAS back in Buy ZoneMeasuring from the wick down on 3 Jan up to the recent ATH, KAS has now retraced to the 0.618 Fib level, with the 0.786 at at the 10 cent mark, which is also current 200 daily EMA level. Daily RSI back at levels not seen since last June, signalling a potential buy opportunity, though whether or not the bearish divergences formed from mid Nov to mid Feb have played out remains to be seen.


KAS back to local support level as buy siognals flash on dailyEyes on KAS now as it retraced from its previous local high back to a local support level. A buy signal is also showing on the Stupid Willy indicator at the time of writing, though it may fall further yet. Hopefully it will get down to the golden pocket fib zone from its recent pump. 200EMA on the 4hr will be at 13 cents soon.

Kaspa keeps bouncing off support.Kaspa keeps bouncing off support, 30% back to resent ATH, some bullish divergence detected on RSI/ RTI

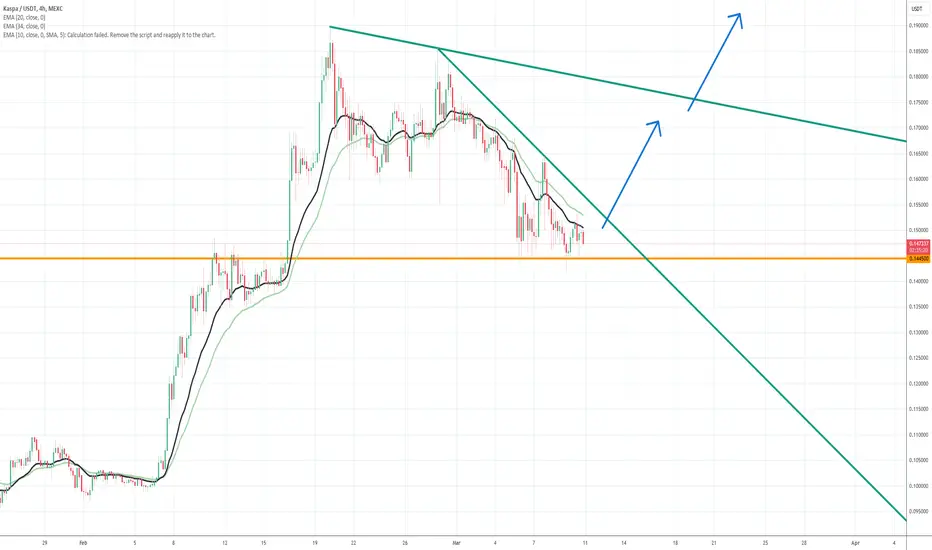
KASPA right before break up downtrend line?Is KASPA right before break up downtrend line?
I think 0.145 is a good support line... so, BUY near this support... and wait for BOOM...
KAS-USDT + MAV-USDT resultsHello! It's me again. I'm back with some thoughts on KAS-USDT. I previously wrote about MAV-USDT and the results are below:
The blue line was the entry point and it had went up around 15% since my original posting about this cryptocurrency, still up about 10% from the original entry. Unfortunately I had misjudged the volatility of MAV and the 50% target wasn't reached, however a profit of 50% would have been reached with if traded with leverage, and it wouldn't have been liquidated had you sold at a 50% profit (although soon after the recent peak it looked like a liquidity trap had occurred).
Looking at KAS-USDT now and see some potential for a short term profit. I would say that a bullish trend has occurred based on my own personal technical indicators I had coded to spot trends. Adjusting my holding time and volatility for this new halving date and bullish season (I keep forgetting its not 2020 anymore and volatility isn't as strong, it'll continue to decrease as time moves on), here are my thoughts below:
SYMBOL: KAS-USDT
POINT OF SALE: $0.20
MAX LEVERAGE: 17x
TIME: 1-2 Weeks
Generally when I post speculation of a cryptocurrency I aim to write about soon before a large uptrend occurs or when it is moving directionally towards the sell point with minimal distress on the trend. Good luck to all of you who are looking to or have invested in KAS, we'll see how we'll it performs these next few weeks.