It needs to happenThis needs to happen, this is a biased TA. I can not see the future, but I feel this happening, can not explain why.
KASUSDT trade ideas
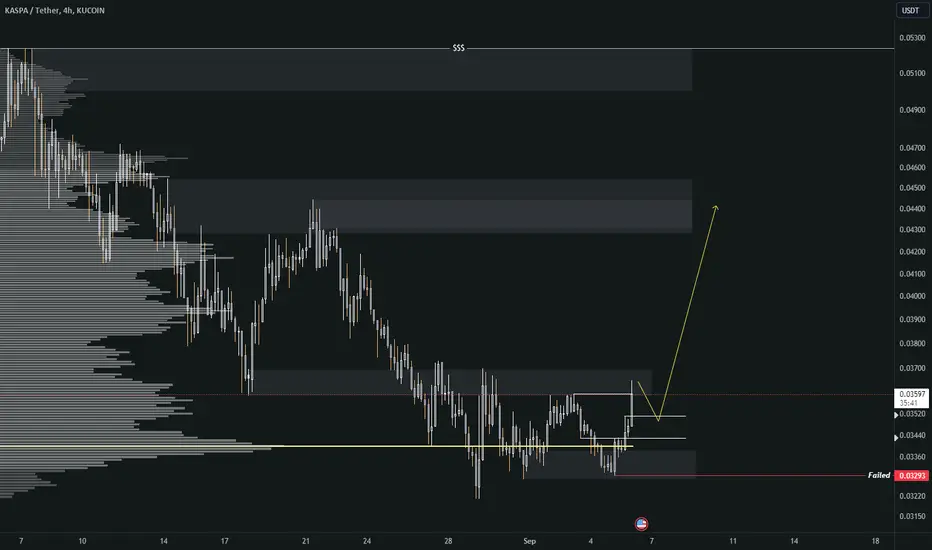
KAS/USDT planning downward move? 👀 KASPA Today AnalysisParadisers, gear up for a compelling opportunity with KASUSDT! After experiencing a notable uptick, it now seems to be gearing up for a potential downward shift👀
💎In our previous observations, we noticed that what was once a supply zone has transformed into a demand area. The price disregarded the bearish Order Block and soared, only to face resistance at the 0.050924 level. KAS now hovering around a retest of the demand zone.
💎Interestingly, the price has failed to establish a new higher high, and buying pressure appears to be waning. This suggests that selling pressure could be imminent.
💎The fixed volume profile also indicates significant volume at our target level, where the price of KASPA may face rejection. Additionally, there's a bullish Order Block at this level.
Keep your charts updated and Stay one step ahead of the market 🌟 🌴

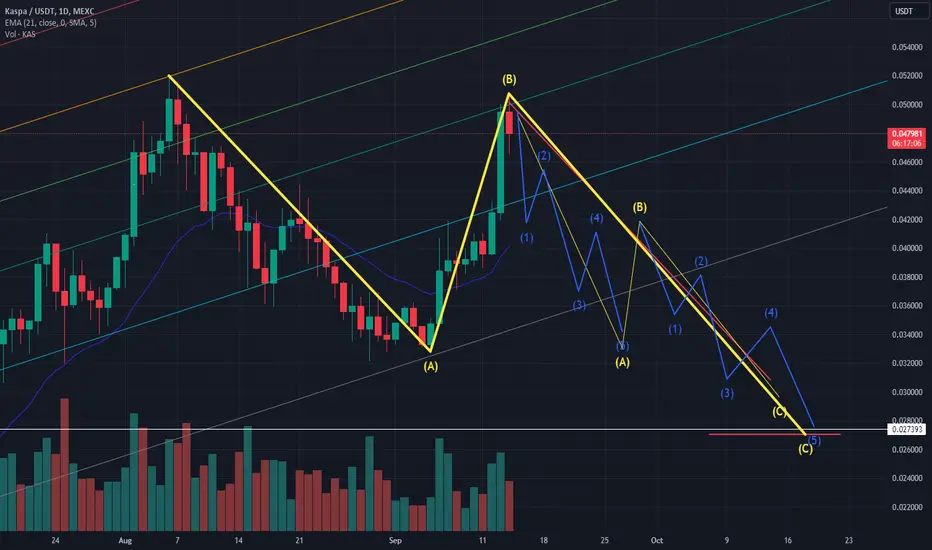
Red or Blue ?Hi there!
Situation is little complex.
We have two high probability scenarios.
-The Blue scenario is 12345 and smaller ABC to the 50 % Fibonacci retracement level
or as alternative it can be with bigger forming ABC to the 61.8 % Fibonnaci level!
In both of cases the next wave to the upside can be huge as big wave 3!
-The red scenario is 1234 and waiting for fifth wave! Also, we have a nice impulsive wave to the upside so after correction it can be continued to the upside as wave 5.
If market will be sideway, consolidate or temporary bullish we keep this scenario but if market turns strong bearish Kaspa can also erase this scenario!
Check S&P500 before you trade BTC, check BTC before you trade any Alt coin, is my moto!
Good luck traders.

Kaspa bull trend into its 3rd halving 2024Kaspa is proving to be a force to be reckoned with and many are starting to take notice. Kaspa is the child of Yonatan Sompolinsky who is a brilliant coder/programmer with an impressive Harvard degree in his field of expertise in cryptography. He has developed the very first BlockDag of its kind which is a more superior blockchain than what we know with Bitcoin. Please do your research and understand why this is so and you may learn to appreciate why this technological breakthrough that has taken nearly over 11 years in the making.
I using fib channels along with Beam bands and price points reflected by fib time zones. I am also using fractals for possible future price action. I may be wrong but if my estimates are correct we could possibly be seeing a price of $0.84 the month before the next halving which is on May 7th 2024.
Please take all this information with your own research and a grain of salt as all is highly speculative.

Navigating Kaspa's Turbulent Waters: A Road to 0.027?As we step into the current market dynamics where Kaspa is navigating through choppy waters, it is glaringly obvious that the necessary volume to instigate a bullish reversal is just not there. Let us deep dive into what the technicals are signaling for the short-term trajectory of Kaspa.
Volume Analysis
The foundation of any sustained upward movement is volume. Unfortunately, Kaspa has been witnessing dwindling volume which paints a bleak picture of its current state. The anemic trading volumes are a glaring red flag, indicating a stark lack of interest from the bulls, and a potential harbinger for further downtrend. Without sufficient volume, any bullish rally might just be a mirage, a setup for a more extended ABC correction which seems to be on the horizon.
ABC Correction Extension
Building on the existing ABC correction pattern, it’s quite evident that we have not reached the nadir of this cycle. The pain threshold has not been met, and this could potentially mean we are bracing for a further downward spiral, as the market seeks to find its true bottom. With the "C" wave still in play, it hints towards a potential further downfall before we witness a genuine reversal.
Psychological Barrier at 0.027
The looming shadow of the 0.027 level acts as a pivotal psychological barrier that needs to be revisited before we can even start discussing a bullish re-entry. This level represents a critical support zone where we anticipate a congregation of bulls to marshal their forces, leveraging the lower prices to build substantial long positions. It is a zone where value meets opportunity, and only reaching this point will give the bulls the confidence and conviction to re-enter with full force.
A Word of Caution
In such a precarious landscape, it becomes essential to ward off the “only up” mentality. This is not a market to be fooled with over-optimism. Prudence dictates a cautious approach, avoiding the trap of a false bullish rally which can very quickly turn into a bear trap. It is imperative to adopt a realistic stance, understanding that further pain might be in store before we witness a robust and sustained recovery.
Conclusion
To sum it up, Kaspa is currently threading in deep waters with a sinking volume and a potential extension of the ABC correction phase. The market narrative right now is one of caution and restraint, eyeing the 0.027 level as a potential battleground for the bulls to regain their footing with full conviction. Till then, it would be wise not to fall for the “only up” mentality and remain vigilant to the market signals for a safer trading strategy.
Investors are advised to keep a close watch on the evolving market dynamics and tread cautiously in the current environment. Stay tuned for further updates as we closely monitor the Kaspa landscape, hoping for signs of a reversal in the future.
Disclaimer: This analysis is based on personal observations and should not be considered as financial advice. Always conduct your research before making any investment decisions.

KAS / KASUSDTGOOD LUCK>>>
• Warning •
Any deal I share does not mean that I am forcing you to enter into it, you enter in with your full risk, because I'll not gain any profits with you in the end.
The risk management of the position must comply with the stop loss.
(I am not sharing financial or investment advice, you should do your own research for your money.)
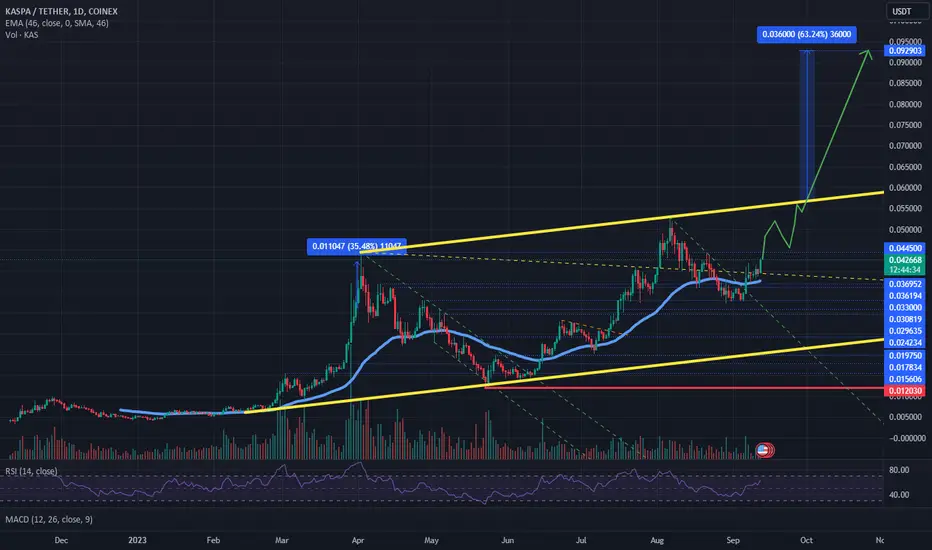
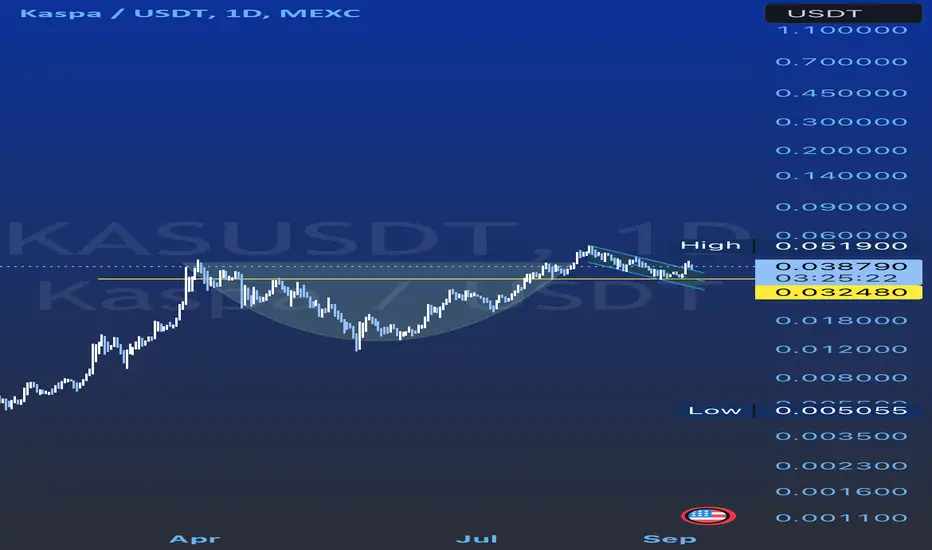
$KAS larger cup-and-handle play?It looks like a larger cup-and-handle could be playing out. We still have a ways to go. Assuming a breakout of the neckline on Oct 1, target is ~0.093. Good luck!
$KAS
#KAS/USDT 4h (ByBit) Broadening wedge on resistanceKaspa is facing 200MA where it already got rejected once, seems likely to retrace down to 50MA support.
⚡️⚡️ #KAS/USDT ⚡️⚡️
Exchanges: ByBit USDT
Signal Type: Regular (Short)
Leverage: Isolated (6.7X)
Amount: 5.0%
Current Price:
0.03945
Entry Targets:
1) 0.04020
Take-Profit Targets:
1) 0.03540
Stop Targets:
1) 0.04260
Published By: @Zblaba
$KAS BYBIT:KASUSDT.P #Kaspa #L1 #PoW kaspa.org
Risk/Reward= 1:2.0
Expected Profit= +80.0%
Possible Loss= -40.0%
Estimated Gaintime= 4-8 days

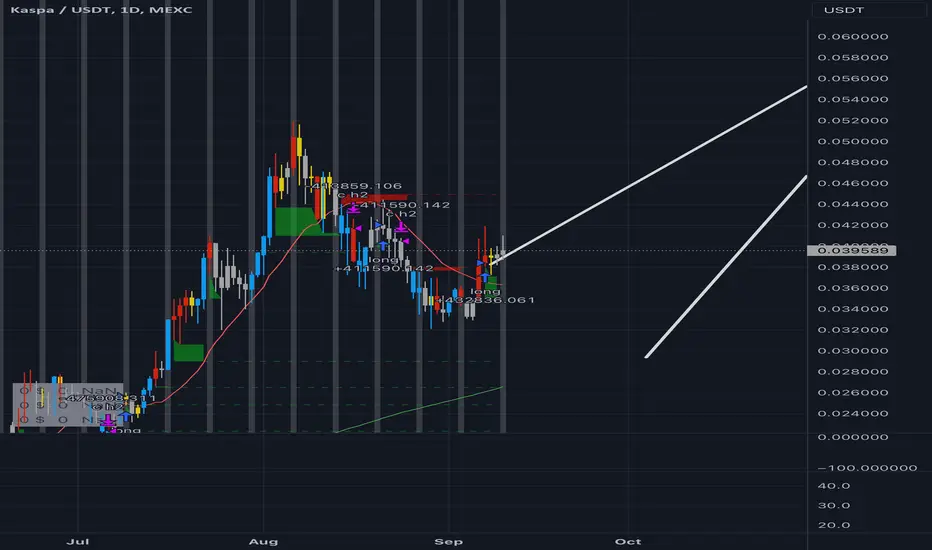
KASUSDT LONG MEXC:KASUSDT Long position
Cryptocurrency Pair: KAS/USDT
Entry Price (Long): 0.038720
Stop Loss: 0.039
Take Profit: 0.069
Risk-Reward Ratio: 4:1 (4 for profit and 1 for stop loss)
Description of the long position:
Long Entry: You open a long position in the KAS/USDT pair at a price of 0.038720, which means you are buying the cryptocurrency KAS using Tether (USDT) with the expectation that the price of KAS will increase.
Stop Loss: You place a stop loss at 0.039, which means if the price falls to that level, the position will automatically close to limit your losses. This level is below your entry price and acts as a protective measure.
Take Profit: You set a take profit at 0.069, which means if the price rises to that level, the position will automatically close to secure your profits. This level is above your entry price and represents the point where you want to realize gains.
Risk-Reward Ratio: The risk-reward ratio is 4:1, which means you are willing to risk 1 unit of loss (if the price reaches the stop loss at 0.039) to gain 4 units of profit (if the price reaches the take profit at 0.069).
kaspa long on new fair value gapkaspa long on new fair value gap
exit when price is below 18 sma
was a profitable strategy in the past
KASPA $KAS, potential level to start DCAing again.Bought back a little into $KAS at $0.0325, around the first (green arrow) measured move target.
Higher low and higher high established on the 4hrly, and bullish divergence on the MACRS, with the 50/15 FG indicator histogram turning green again. Will DCA more if candle closes above the green 50 SMA on the 4 hrly.
However, note that the Ichicloud remains bearish, exerting resistance for the current price from recovering toward the 38.2% Fib level.
Expect $KAS to fall to ca. $0.027 though if price falls below $0.0309, towards where the 2nd measured move (orange arrow) target lies.

KAS Inverted head and shoulder break outlooks like we are breaking out. Might travel to the next POC marked as well.

KASPA kas/usdt (Head and shoulder) ?In trading, the term "head and shoulders" refers to a popular chart pattern used in technical analysis to predict potential trend reversals. The head and shoulders pattern typically forms after an uptrend and is considered a bearish reversal pattern. It consists of three peaks or highs, with the middle peak (the "head") being higher than the two surrounding peaks (the "shoulders"). Here's how the pattern is typically identified:
Left Shoulder: This is the first peak and occurs during an uptrend.
Head: The highest peak of the pattern, representing a brief consolidation or continuation of the uptrend.
Right Shoulder: This is the third peak, usually lower than the head, and forms after a minor rally from the head.
The pattern is considered complete when there is a confirmation of a trend reversal. Traders often look for specific criteria to confirm the pattern:
Neckline: Draw a line connecting the lows of the left shoulder and the right shoulder. The neckline serves as a key support level.
Breakdown: A breakdown occurs when the price of the asset falls below the neckline, indicating that the pattern is valid and a trend reversal may be underway.
Volume: It's common to see a significant increase in trading volume when the breakdown occurs, confirming the pattern.
Once the head and shoulders pattern is confirmed, traders often use it as a signal to open short positions (sell) or to close long positions (take profits) in anticipation of a bearish move in the price of the asset.
It's important to note that while the head and shoulders pattern is a widely recognized and studied technical pattern, it is not foolproof, and false signals can occur. Traders often use additional technical analysis tools and indicators to confirm their trading decisions and manage risk.
In summary, the head and shoulders pattern in trading is a bearish reversal pattern that forms after an uptrend and is characterized by three peaks, with the middle peak (the head) being higher than the two surrounding peaks (the shoulders). It can be a signal that a trend reversal is imminent, but traders should use additional analysis and risk management strategies when trading based on this pattern.

KAS USDT By HesamUNTHey traders
look at KAS , back to the ATH !!!
can we break it up ?
still bearish as long we play below this lvl
share ur thoughts and leave a comment
"@timbrecoin1 bro u know the rules"
wish you the best :x

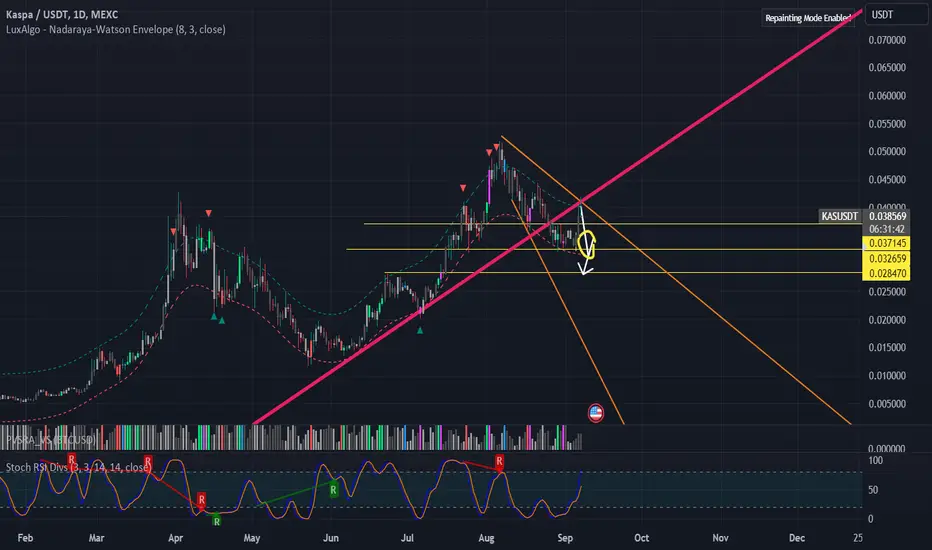
Kaspa trend directionWe are in a down trend as of 0.0369 confirmed if we do not break the local high on the 4hr we continue the trend next liquiity level indicated in the yellow circle
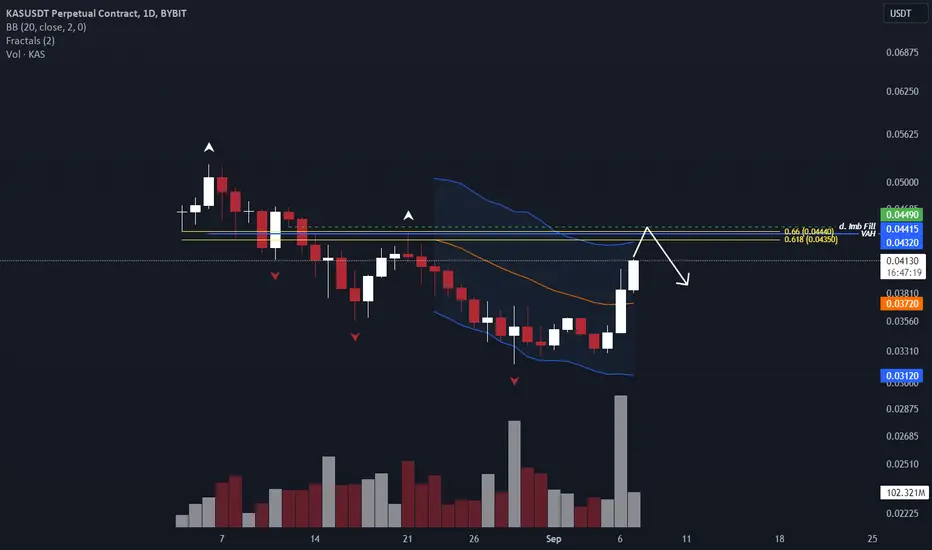
KAS USDT - Don't be getting so Bullish Kas is heading into strong resistance with this macro value area high lining up with the fib golden pocket. I will be looking to short around here.
$KAS - Kaspa with Ascending ChannelKASPA looks like will bounce inside the huge ascending channel formarions.

Trend reversal coming soon, Bearish KASusdt/KaspaThis analyse is ANTI FOMO/FUD, this ananalyse is realistic. I hear stories from KASPA believers that Kaspa will defeat Bitcoin, that it will only go UP. we heard those stories million times with other projects, just to mention Luna, Solana, matic, FTT and so many more. what did they ALL HAVE IN COMMON? they ALL DUMPED.
So now, i look at kaspa, i see LOW volume, i see overbought RSI, i see bearish divergence, i see more than 30,000% price increase, i see almost 1 year of uptrend, this is all SIGNS of exhaustion and signs of TREND REVERSAL. nothing goes UP forever, when you see indicators flashing ALERTS, its time to LEAVE.
i predict with GOOD market condition and stable BTC, kaspa MAY STILL go to around 0,055 or 0,08 MAX.
BE CAREFUL. #kasusdt #bitcoin #kucoin #MEXC #kaspa MEXC:KASUSDT KUCOIN:KASUSDT COINEX:KASUSDT

KASUSD ShortLost my trade from chart, so image should do it:
I hope that we swing up to supply zone. Already got under demand for a sec.
Weekly:
Monthly:
Move your SL in long trades.

kaspakaspa will go down MEXC:KASUSDT you can see head and shoulder pattern in daily time frame and you see it break the support line and pullback to it. now its time to go more down

KAS SLEDDINGLooks like Kaspa is in a nice downtrend. good r/r here . Resitance below SL and we are at the top of a descending triangle pattern.

KASUSDT will keep dumpingKASUSDT looks very bad
Bearish formation aka head and shoulders is playing out. We have already seen a susscessful break down and even bearish retest.
Every bounce is a short opportunity.
Target for shorts / Entry for longs is a green area shown on the chart.
Good luck KAS lovers.
