Kaspa looking for a bounce!$KASPA looks to have found a local bottom at .05!
I see clear support structure developing between the two price swings in 2023.
A retest of this area with increased volume would confirm this as an area of support!
KASUSDT trade ideas
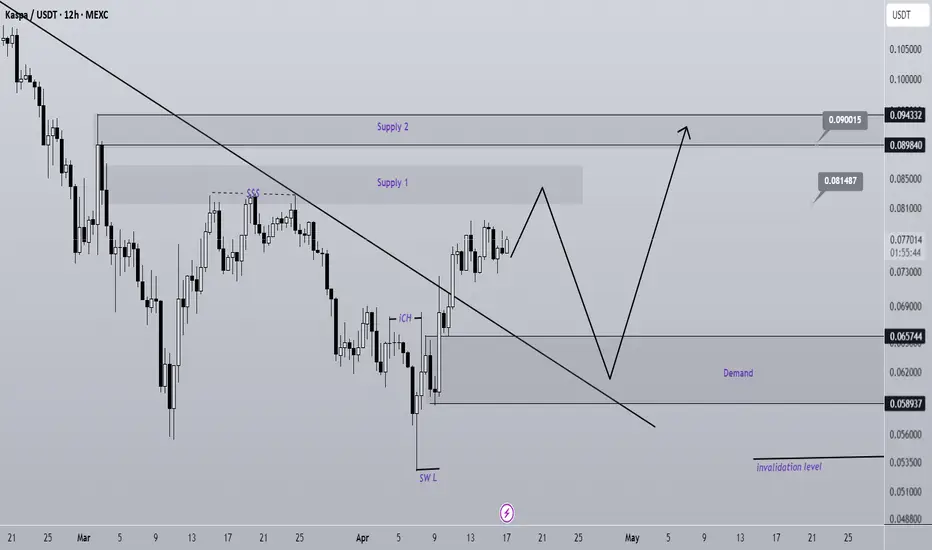
KAS ANALYSIS (12H)A significant trendline has been broken on the chart, and a bullish iCH formation has also formed. Additionally, a liquidity pool is visible above the chart, which is expected to be swept soon.
The demand zone is our entry area. If the price reaches this zone before touching Supply 2, we can consider entering a position.
A daily candle close below the invalidation level will invalidate this analysis.
Do not enter the position without capital management and stop setting
Comment if you have any questions
thank you
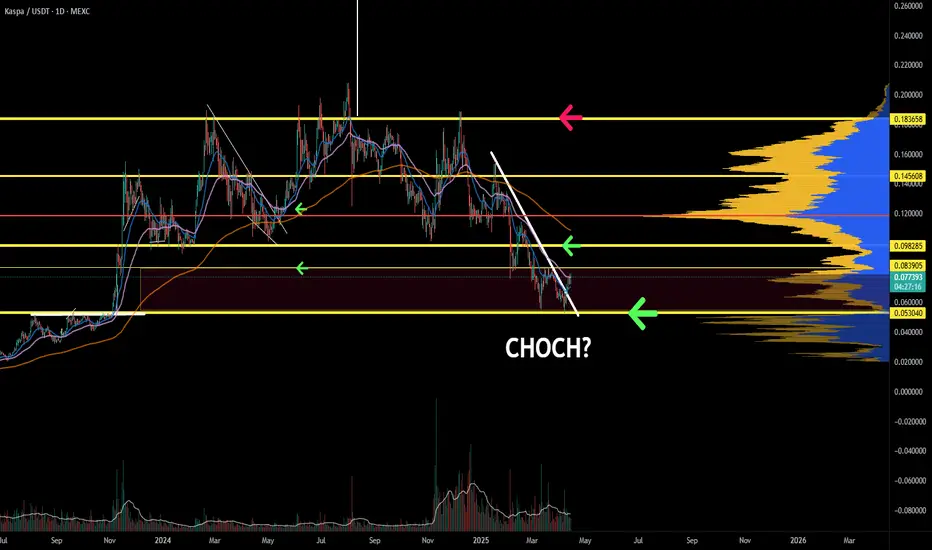
KAS looking for reversal. Trading moment incoming. KAS is bouncing off of horizontal support however a pivot structure is needed to entertain a trend reversal. Momentum and trend oscillators show signs of bullish divergence, however, a choch would provide good confluence.
Full TA: Link in the BIO
KAS bear is overGetting ready for the reversal. With the upcoming 10 BPS in May and smart contract after. Perfect timing. -> 0.5
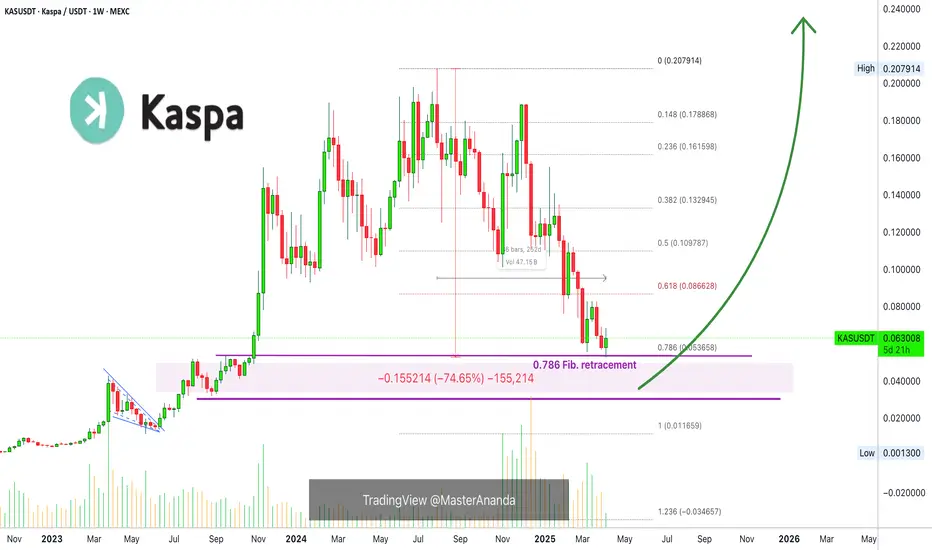
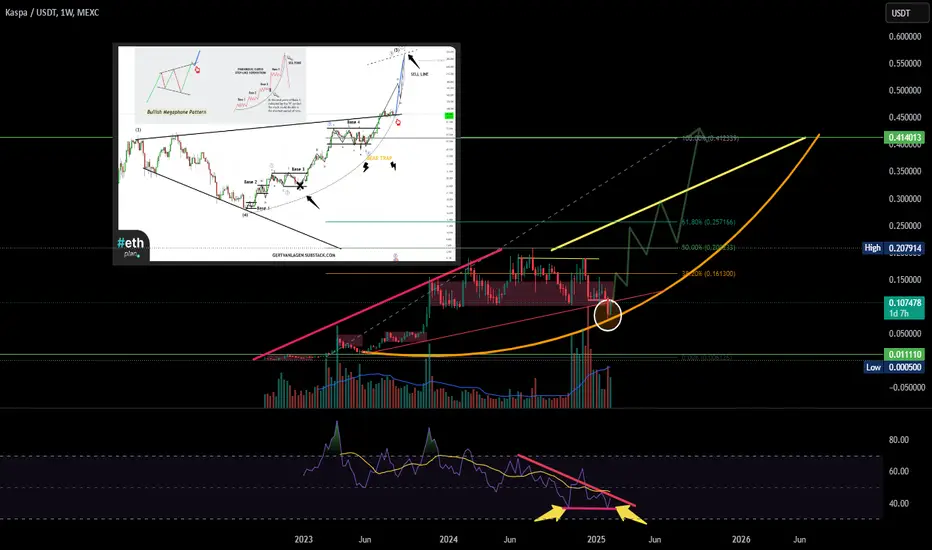
Kaspa: Your Altcoin ChoiceI normally hide the numbers. I don't know where nor when I got into this habit but it is something that I've been doing. That is the 0 and 1 for the Fibonacci retracement tool. Here I am leaving it in full view so you can better appreciate but I will try to explain.
Corrections happen, all the time. Corrections are a normal part of the market cycle, market action and price dynamics. When there is a strong rise, this is balanced out/followed by a strong correction. When the rise is a small, corrections can also be very small.
Kaspa went through a massive bullish period. It beat most of the market and it kept on going. For this reason, it had to undergo a strong correction.
A correction within a bullish trend can reach the 0.382 Fib. retracement level easily, sometimes higher. Lower can happen but they tend to be short. When a bullish trend ends, the correction can go lower hitting 0.618 or 0.786. Here, for KASUSDT, we can see support being found exactly at 0.786 Fib.
The current correction is already 75% strong. This is a huge correction by any and all standards and we are not in a bear market year. This is a bull market year. In bear markets, for Cryptocurrencies, corrections can reach 80%, 90% and even 99%. Some pairs can go beyond 100%. Strong pairs like this one wouldn't go beyond 85-90%. Noticing again the pre- bull market situation, this a correction in anticipation of massive growth. Those in the know, sell and take profits because the market will blow up, literally. Boom... UP!
So all is good and Kaspa will recover based on the long-term. Just as the bullish cycle for Kaspa was an extended one, the same can happen in reverse. Prices can drop some more, there can be some shakeouts, stop-loss hunt, but no need to worry at all. In Crypto, what goes down, is sure to recover and grow strong.
We are only about to get started. In 2023 Kaspa corrected for two and a half months, then massive growth. This time, we have a 252 days long correction, more than 8 months, this is enough bearish action to support years of growth. That is, when the correction is over, within weeks or months, the next cycle will last for years.
How about that for hope?
Thanks a lot for your continued support.
Namaste.
KASPA Support Bounce #KASPA price action has been a rollercoaster lately. After a steady decline from its highs, it hit a local low around $0.06 recently. Since then, it’s bounced nicely.
This rebound from key support, paired with growing volume, hints at renewed buyer interest
— could be a sign of strength returning to $KAS!

Kaspa HTF Bearish/LTF Bullish Elliott Wave CountKAS is currently completing wave 5 of the wave C Flat. Which would complete wave 4. Next is the 5 wave move down to complete the pink wave C of an Expanding Flat of a higher degree....after all that work, perhaps it will still be valid to call it B wave of flat of Primary degree is in! Gotta love fractals!! Not financial advice, my opinion.

KAS looking for support. KAS has been dealing with a downtrend after a large distribution. Eventually, the trend will end; unfortunately, there are few signs of this. However, now is the time to put Kaspa on a watch list. The price hit a very good level of support and if the price can give us indications of a reversal it is time to get risk on.
Full TA: Link in the BIO
kaspa bullish breakout continueKAS/USDT is breaking the 15-minute trendline, indicating a bullish continuation of the trend. The price target looks towards the 0.92 region based on calculations from previous market demand.

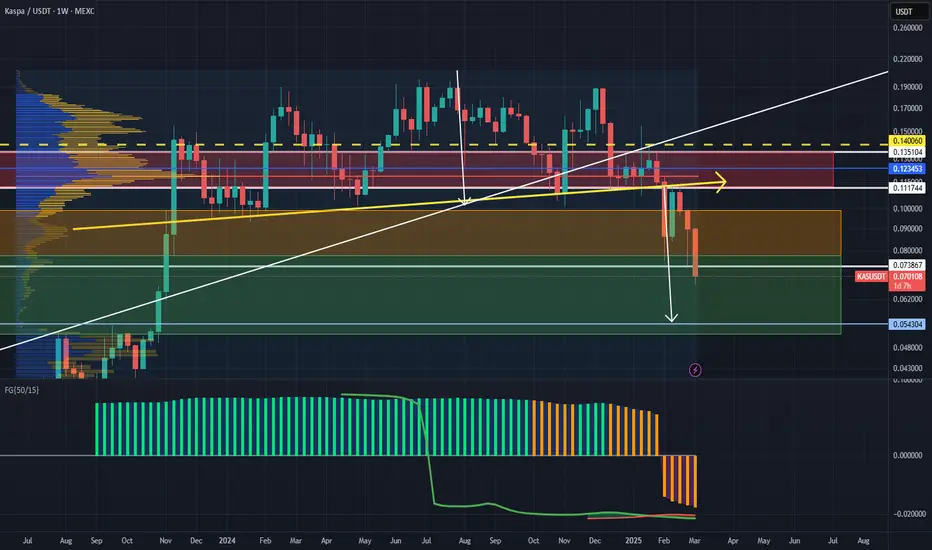
KASPA: Soon to switch to being greedy again.Back into the green zone.
Stepping up DCA-accumulation into a more aggressive mode soon, expecting KAS to fall to as low as ~5.4 cents.
FG oscillator is still orange (bearish) on the weekly.
10 bps upgrade and activation incoming. 4 smart contract layers being developed. Tier1 exchange listings to look forward to. KII (Kaspa industrial initiative), and so on.
Lets just say it's BULL-timeWe are now going bull, we see strong support for this, we are entering shortsqueeze phase hyperbolic squeeze me! RSI looks good, divergence printing on all timeframes. Go long now with high levrege and conviction!
Kaspa Wycoff Distribution for 2025We are witnessing a possible Wycoff Distribution pattern playing out which could bring price action down to $0.048 which would also come in line with the 0.786 Fibzone. If we do not hit the 0.786 fib zone as a bottom we could find great support at the 0.05 price which was great resistance back in September and November 2023.

Looks bullish based on the indicatorsWhen looking at the circles and the fans and channels we clearly see the bullish pattern going to the 0.05$ price. This is more bullish than even bitcoin doing a 10x. More indicators needed to be implemented to be more precise, but we see bull is more accurate

$KASbullish on kaspa
DYOR, trade only on spot
brearish trend line brek, make lower low in day time fram
In weeklt lower high , still up trend as per base 4 cycle.
after break support levels, acting as strong bounce at the daily 200 EMA
kaspa listed on coin base perp
cressendo coming soon
i am bullish on kaspa
don't trade on leverage trading
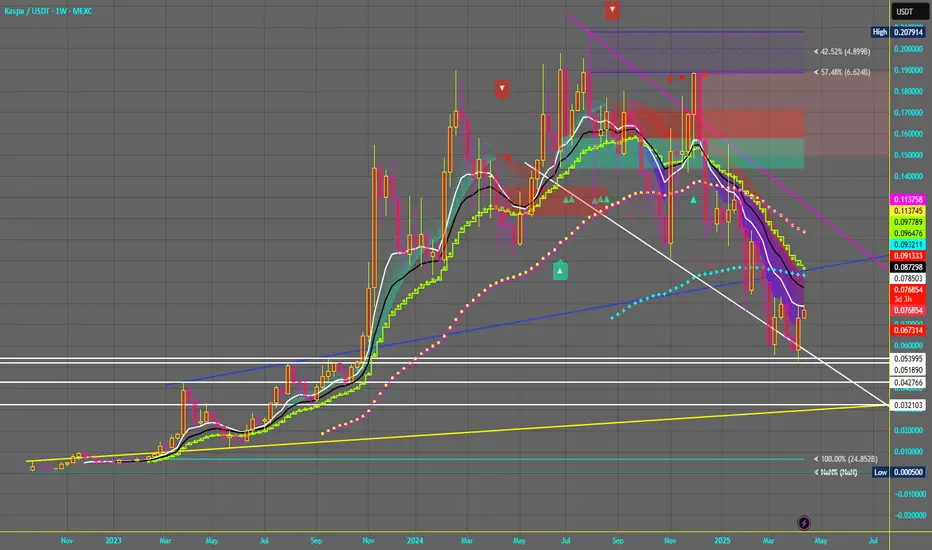
Kaspa Bear-Market Is Over: Time To TradeHere is a pair that we looked at many, many times last year, all of these times on the SHORT side and many of these looking were successful. I met a lot of people through this pair, we did a lot of trading and we did great. Things change.
I no longer see any bearish potential on this chart.
Kaspa (KASUSDT) grew an incredible ~1600% between 2023 and 2024, and the correction/consolidation phase was weak/strong. Weak in the sense that Kaspa remained pretty strong. Strong in the sense that prices remained pretty high compared to the starting point. In short, this is a strong project based on the chart. You will have to consider the fundamentals for yourself as in this channel we concern ourselves only with technical analysis.
So things change and Kaspa hit its lowest price last week since November 2023.
The weekly close happened right above the 0.618 Fib. retracement level for the entire bullish cycle on this chart. It wicked below but it closed above. Why is this important as in an important signal? Because the bullish cycle lasted 434 days. Such a strong cycle. Having a strong correction and this dynamic showing up can mean that the correction reached its end. But this is not without risk.
0.618 Fib. sits at 0.08727. We are using the weekly timeframe.
The last major low sits at 0.07600. We can say that as long as KASUSDT trades above this level, we have bullish potential and this pair, together with the rest of the market, can grow. If the action moves below, we are not right or wrong, the bullish potential becomes invalidated and the charts dynamics change. It has bullish potential but it is early. The potential is based on the fact that the market is starting to change but it is still early. We are going up long-term regardless of the short-term.
Let's sum it all up:
Short-term, we are aiming higher but there can be some shakeouts based on the chart.
Mid-term and long-term, we are going up.
Do you agree?
Yes! Follow me.
Thanks a lot for your continued support.
Namaste.

KASPA Q1 ForecastThis forecast is premised on the timing of the BTC Cycle Low around 20th February. KAS rebounds strongly from HTF demand around 0.05. This low might coincide with a Binance and / or Coinbase listing, or other catalyst in addition to BTC Cycle Low. From the current date (8th Feb), more downside is expected whilst BTC continues to range 90-108k. A deviation below RANGE (87-88K) would result in another severe drop for the Alt Coin market. On the contrary, if BTC breaks out of range to new ATH in February, we can expect an acceleration of this forecast

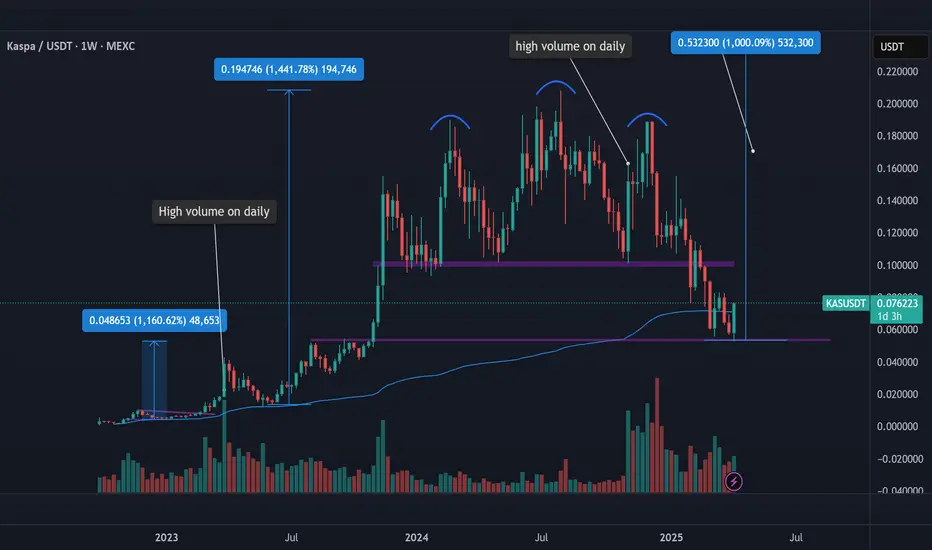
KAS Massive HnS PatternIts like end of cycle for altcoin especially KAS
HnS pattern in big timeframe is scary

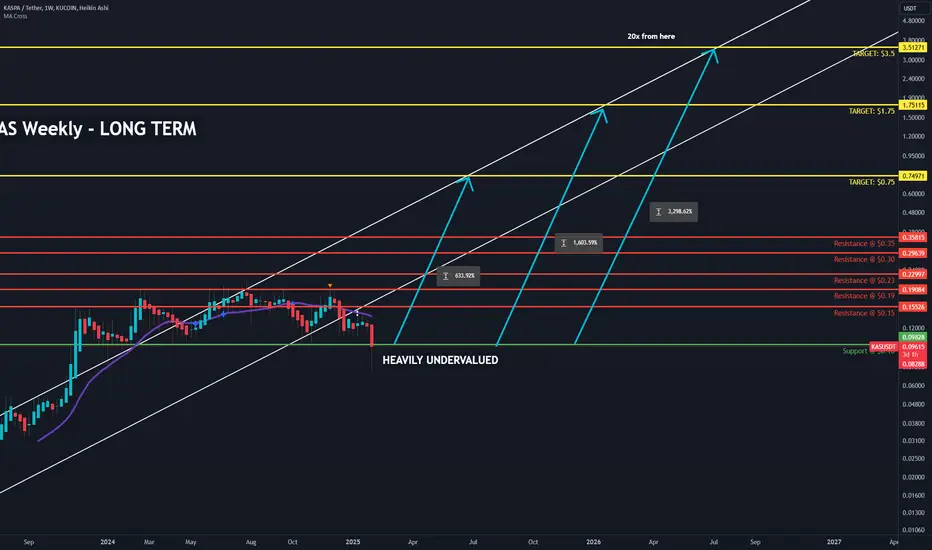
KAS to $3.50 Long TermKaspa has a bright future as a robust blockdag.
Weekly long-term targets $0.75, $1.75, $3.50
Short term resistances on the chart

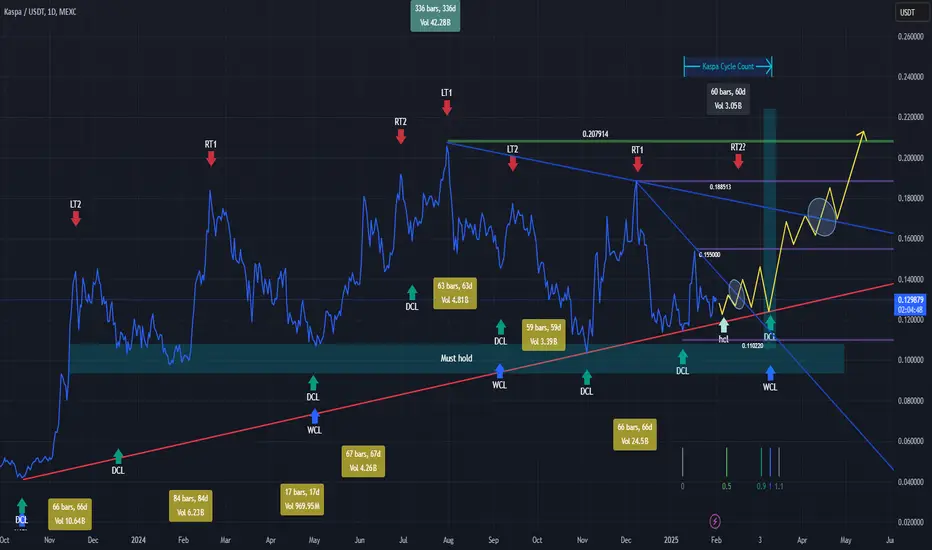
KAS Cycle Update 01/31- Completing the Feb to Beginning of MarchKaspa is about mid-way through its current 60-day cycle. As it did not show particular strength after the last cycle low, I suspect it will chop around until the next daily cycle low (DCL), which should also be a Weekly Cycle Low (WCL).
To show that this year-long range has been an ACCUMULATION pattern rather than a DISTRIBUTION pattern, Kaspa has to stay above 0.10 and DEFINITELY not lose the lower box.
Invalidation of a distributive top will be confirmed if it breaks above the most recent blue trendline.
From the longer trendlines (the strong red below and the upper blue), Kaspa is currently in a compression wedge.
The next DCL/WCL should be telling. If Bitcoin (still the king) can show some strength (it is also coming up on a DCL/WCL), Kaspa should follow, and the next DCL/WCL, when confirmed, should be a great entry point for a long.
The yellow path is my current expectation of Kaspa's path (bullish bias).
Thanks, Uncle Camel (CamelFinance,) for the insights on cycle theory.
TradeCityPro | KAS: Mastering the Layer 1 Cryptocurrency Terrain👋 Welcome to TradeCityPro!
Today, we're delving into KAS, a prominent Layer 1 cryptocurrency.
📅 Weekly Timeframe
We're observing a powerful upward trend that began after reaching a resistance at $0.191706 and recording a new ATH. The currency has entered a consolidation phase, fluctuating within a range box between $0.099315 and $0.191706.
🔍 The $0.099315 area has proven to be a significant support, overlaid with the 0.236 Fibonacci zone, creating an important PRZ. If this area breaks, the next support would be at the 0.382 Fibonacci level. Other critical areas at $0.39650 and $0.015089 could serve as potential floors in the event of a severe drop.
📊 Since late 2024, market volume has significantly increased as Bitcoin was hitting new highs. However, KAS continues to oscillate between $0.099315 and $0.191706, unaffected by Bitcoin’s movements.
📈 Breaking the resistance at $0.191706 is crucial, and if the price can stabilize above this area, there's a high chance of setting a new ATH, especially if accompanied by a surge in buying volume and a break above 60.93 on the RSI.
✅ If the price solidifies above $0.191706, subsequent Fibonacci targets are around $0.44 and $1.13. The $0.44 target is feasible with a market cap reaching $12-14 billion, but reaching $1.13 is less likely as it requires a much higher market cap, making it a challenging target.
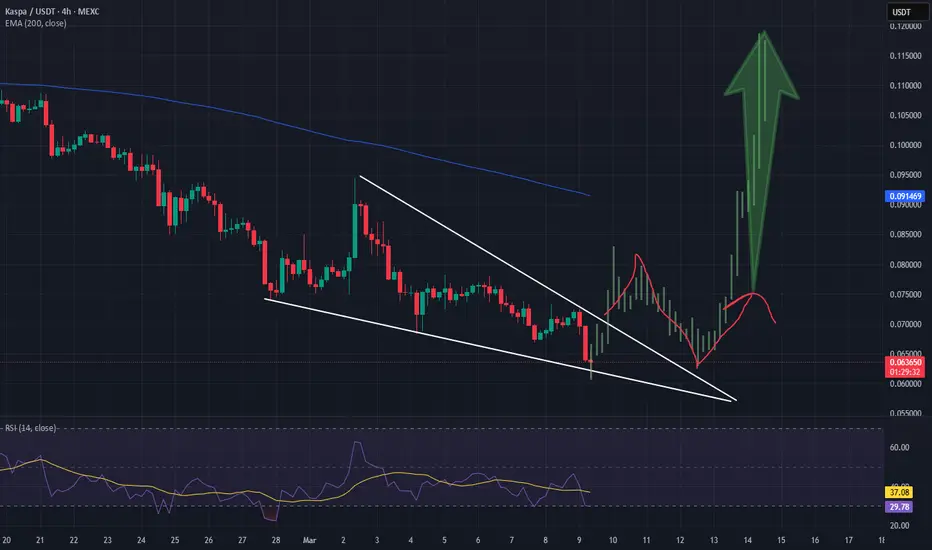
⏳ 4-Hour Timeframe
In the 4-hour timeframe, we're seeing a downward trendline that has recently been broken, and the price is gaining upward momentum as evidenced by breaking 50 on the RSI. There's a significant resistance zone from $0.134103 to $0.139051, and breaking any of these areas could be a good trigger for a long position.
🔼 For risk-takers, breaking $0.134103 could be an immediate trigger for opening a position, but a more secure trigger would be the break of $0.139051. The minimum target for both positions would be $0.152908, which could also act as a trigger for reaching the upper range box limit.
📉 For short positions, the first trigger is at $0.119702, a very appealing level. If the price consolidates below this area, we could see a move down to $0.108790. The main trigger for a significant bearish move would be the break of $0.108790, a crucial support, which could lead to heavy drops with targets outlined in the weekly timeframe.
📝 Final Thoughts
This analysis reflects our opinions and is not financial advice.
Share your thoughts in the comments, and don’t forget to share this analysis with your friends! ❤️

KASPA IS THE FIRST CRYPTO TO SOLVE THE BLOCKCHAIN TRILEMMA!Pattern: Symmetrical Triangle
Formation: The chart shows a symmetrical triangle pattern forming on the weekly timeframe. This pattern typically indicates price consolidation and suggests that a breakout (up or down) is imminent.
Support and Resistance:
Support: Defined by the ascending green trendline.
Resistance: Defined by the descending red trendline.
Prognosis:
Prognosis 1: A bearish breakout (less likely).
Prognosis 2: A bullish breakout (more likely).
Indicators
Volume:
Volume is declining during the formation of the triangle, confirming the pattern’s validity. A volume surge is expected during a breakout.
RSI (Relative Strength Index):
Current RSI value is 44.55, indicating neutral momentum but leaning towards an oversold condition.
Stochastic Oscillator:
The stochastic is in the lower range (23.19), suggesting potential upward momentum soon.
Money Flow Index (MFI):
The MFI is showing a slight uptick, signaling that money inflows may be returning.
Market Cipher B:
Momentum is gradually increasing, with signs of bullish divergence.
Key Levels
Resistance:
$0.24522 (intermediate target).
$0.34669 (major target post-breakout).
Support:
$0.10 (triangle base and psychological level).
Spot Trading Plan
Entry Strategy
Breakout Confirmation:
Buy above $0.145 on a confirmed breakout from the triangle (with a 4-hour or daily candle close above resistance).
Volume Surge:
Enter only if the breakout is accompanied by high trading volume.
Stop Loss:
Place a stop loss below the breakout level or $0.12 to limit downside risk.
Profit Targets
First Take Profit:
$0.24522 (approx. 68% above breakout level).
Sell 50% of the position.
Second Take Profit:
$0.34669 (approx. 138% above breakout level).
Sell the remaining position.
Risk Management:
Allocate no more than 5-10% of your portfolio to this trade.
Maintain a risk/reward ratio of 1:3.
Monitoring:
Keep an eye on overall market conditions (Bitcoin dominance and trends) as they heavily influence altcoin performance.
Reassess if the price deviates significantly from the expected triangle breakout.
Bearish Scenario:
If the price breaks below $0.12 with high volume, wait for the $0.10 level to evaluate for potential entry or exit further positions.

