Cryptocurrency Market Confirmed Bullish: Higher High NextI think the easiest way to say it is by keeping it simple and straight forward: Cryptocurrency is bullish. The Cryptocurrency market is set to move forward and produce a new higher high, marketwide. The Altcoins are set to grow, Bitcoin is set to continue growing; we are going up.
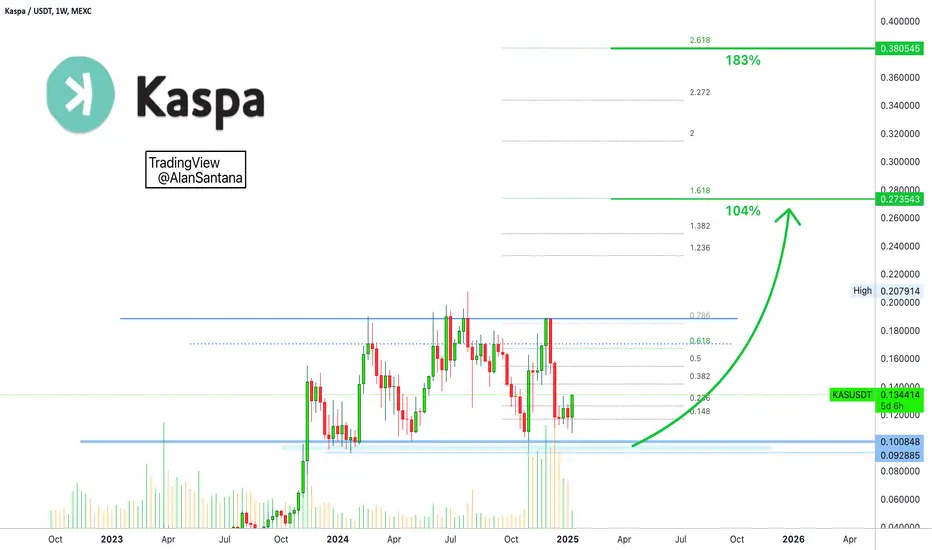
Here we have Kaspa, KASUSDT, a pair that we traded many time successfully on the bearish side. It is bullish now.
Kaspa started a retrace in early December.
After two strong negative weeks, it produced three weeks of sideways.
So we have a drop, a strong drop that suddenly stops and the market goes sideways. Now we are seeing a bullish breakout.
This means that the correction is over and we are ready to see a new move develop. This new move is a bullish move and this is based on the chart, market cycle and marketwide action.
This new move can be a mild move or a long-term one.
The most probable scenario goes like this: The low is in. We will see higher prices, higher highs and higher lows long-term.
The bearish action is over.
Welcome to the 2025 bull-market.
It all starts now and it will go for long and high.
Thank you for reading.
Namaste.
KASUSDT trade ideas
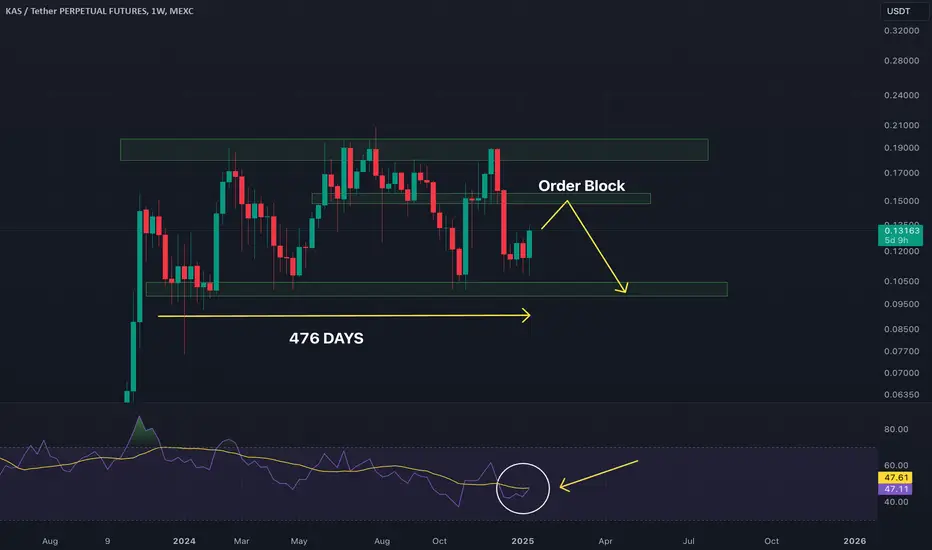
Kaspa 1W Big Order BlockKaspa NEEDS to clear that order block in order to continue to the upside.
I think we still have one last correction on KAS before continuing to ATH
KASPAif you see, after each correction kaspa had a price increase of 50-70%
will this happen, i would say yes and this should happen during 2-3 days, so i could say during the weekend, lets see if market will be positive and then long it.
please before ape, do your own research.
nfa

KAS in a bearish structure or is it close to breaking out? I want this thing to make new ATHs but the charts are not showing me this is the case for KAS.
Are we simply in a broader ABC correction or has this thing already corrected?

Is KAS about to explore and make new ATHs or is it an ABC?KAS in a bearish zone for a few months now. Is it time to break out soon?
Bearish case and bullish case noted

KAS - is it in an ABC or about to blast off and make new Highs?!KAS has been in a bearish structure for some time.
It looks like it wants to make new highs, but we must be cautious as there is a bearish view to this as well! Lets go KASPA!!
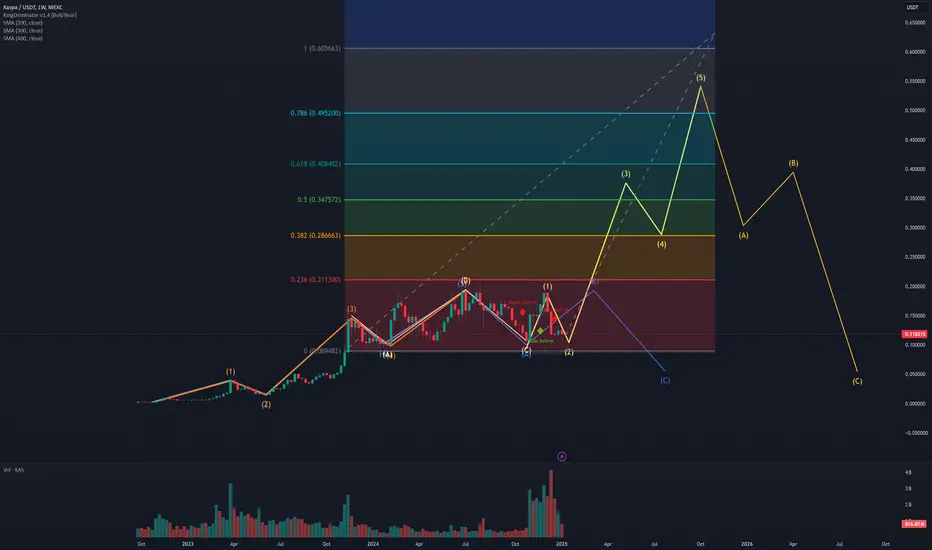
Is KAS currently bubbling up for another bull run cycle?!Have drawn up a bearish case and bullish case.
Bull = Yellow
Bear = Blue
Which Direction will this go this cycle?
I have a bet that this can still make new ATHs but not sure about crazy $1 price unless it got a lot of exchange listings

#KAS/USDT UpdateCSE:KAS swept the liquidity below PML $0.011011. Waiting for a confirmed Market Structure Shift (MSS) to consider longing.
🔑 Levels to Watch:
Resistance: PWH $0.1308
Support: PML $0.11011

Kaspa DCL/WCL in sightKaspa is right in the timing window for a DCL (60-day cycle) ending Jan 9th. It has confirmed a break above the downward-sloping blue trendline.
It has either put in a DCL/WCL already or still has a few days.
(If it drops below 0.112450, the new DCL/WCL will be created).
This will be a good sentiment reset and allow for strength upcoming.
As always, BTC still dominates, so Kaspa PA can be impacted.
After that, there is a high probability that we will see a Right-translated daily cycle (usually indicative of an uptrend). Bullish Bias.
NFA - Opinion of the Author ONLY.
JT

KASPA - IT'S TIME TO RISE (TA+TRADE PLAN)Technical Analysis of KASPA/USDT
Chart Overview
Formation: The price action indicates a descending trading channel transitioning into a falling wedge pattern, which is typically bullish and suggests a potential breakout.
Support Levels: There are key horizontal support zones within the orange-shaded areas (~$0.120-$0.125). These levels have historically provided strong demand and buying pressure.
Resistance Levels: Resistance is observed near $0.135 and $0.145. Breaking above these levels will confirm the bullish breakout.
Indicators Analysis:
RSI: At 37.25, indicating oversold conditions. A potential reversal upwards is imminent.
Stochastic RSI: Showing upward momentum, confirming a likely breakout soon.
Volume: A significant volume spike near support zones suggests accumulation by bulls.
Money Flow Index (MFI): A positive divergence indicates that buyers are entering the market.
Wave Market Cipher: Shows bullish divergence with green dots on the oscillator, further validating a potential move upward.
Pattern Breakdown
Falling Wedge: A bullish continuation pattern that implies a breakout in the upward direction. This is supported by the narrowing of price movements and lower volume, a precursor to significant price movement.
Trading Plan for KASPA
Entry Strategy:
Primary Entry: Enter near the current price level (~$0.124) within the wedge, as this is close to strong support.
Secondary Entry: Place buy orders near $0.120 in case of a short-term dip.
Stop-Loss:
Set a stop-loss just below the wedge support ($0.115) to manage risk, as breaking below this invalidates the bullish setup.
Profit Targets:
Target 1: $0.135 – the upper boundary of the current wedge.
Target 2: $0.145 – a resistance level aligned with historical price action.
Target 3: $0.160 – an extended target if momentum continues post-breakout.
Risk-Reward:
Risk: $0.124 to $0.115 (~7.3% downside).
Reward:
Target 1: 9% gain.
Target 2: 16.9% gain.
Target 3: 29% gain.
Confirmation Strategy:
Wait for a confirmed breakout above $0.128 (wedge resistance) with strong volume before adding to positions.
Use a trailing stop-loss to secure profits if the price moves significantly upward.
Timeframe:
Monitor the 1-hour and 4-hour timeframes for confirmation signals. Breakouts from falling wedges typically occur within 1-2 trading sessions.
Market Sentiment: Ensure the broader crypto market sentiment remains positive or neutral to support bullish momentum.
News Events: Monitor any fundamental news or updates regarding KASPA that could affect its price action.

KAS Long Sl -14.3%KAS Long Setup
Reason:
Breakout of trendline.
Strong Bullish Volume is observed.
Liquidity Sweep already taken.
LTF Confirmation already done.
Price actions suggesting a bullish wave.
All Technical Indicators Suggesting Strong bullish Momentum.
Best Regards,
Crypto Panda
BYBIT:KASUSDT.P
MEXC:KASUSDT.P
BINGX:KASUSDT.P
BLOFIN:KASUSDT.P

Short term Kaspa Price actionSo far if this adam & eve pattern at the .786 plays out fully, we have a volume gap to .149-.15. Breaking out of the neckline of the inverted head n shoulders

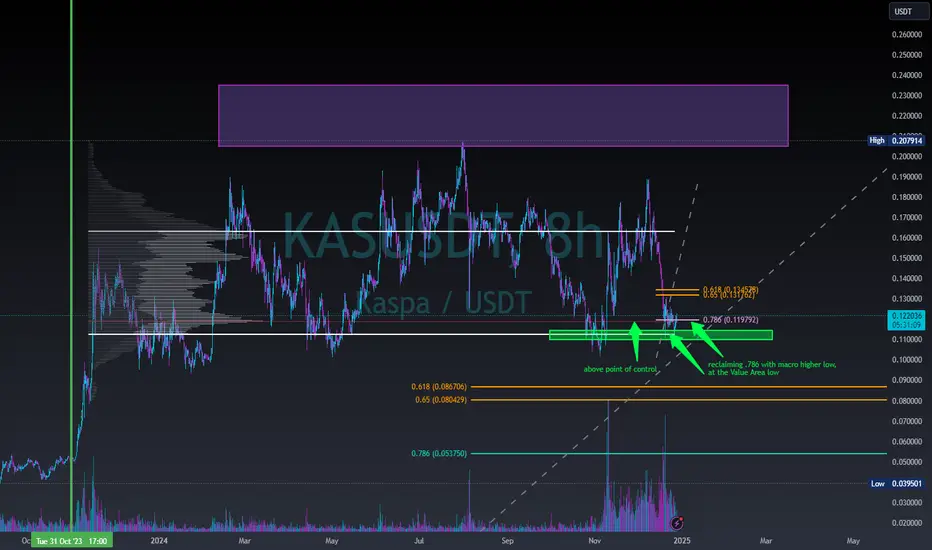
Kaspa in big sideways range or Head and shoulders?Yes we had that big head n shoulders on kaspa to include a bear flag. But that bear flag looking invalidated. I see more bullish tones than bearish tones now. We have price bouncing off monthly support, we are currently reclaiming .786 on a higher low (macro). Are are above point of control and finding support off the Value Area Low. That big head n shoulders on kaspa getting everyone to sell their bags. While the believers buying it up. That's my take. If you think I am "wrong", you are in the wrong business. its not about being right or wrong, its about being positioned for all scenarios. I am ready for .05 at the big .786/ high volume node also
KasusdtBullish on kaspa digital gold
build on trust with code
bull run expected $10
long accumulation period over
lets start engine to super cycle no stop untyill $10
strong support zone at the yearly low
bull and flag pattern

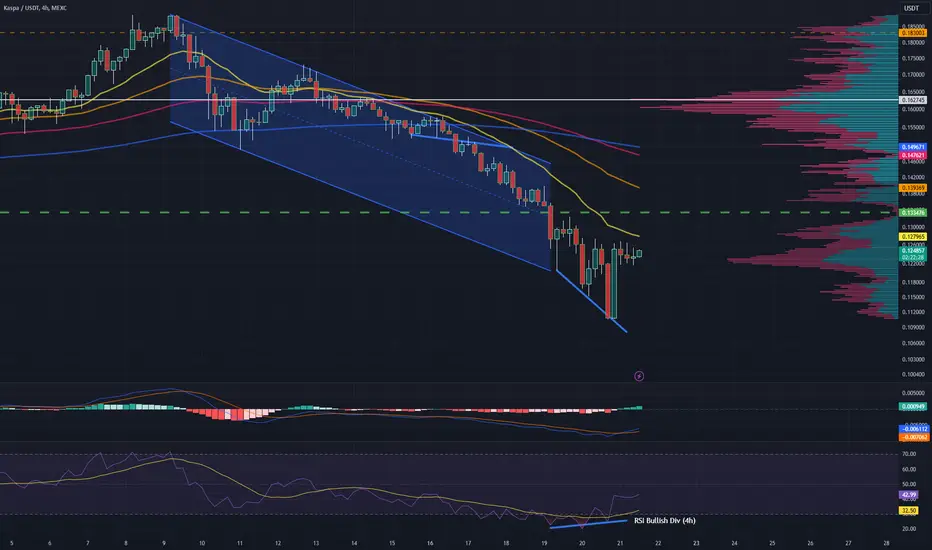
Kaspa / USDT LongWill be watching the next few 4h Candles for confirmation, however noticing 4h bullish div on RSI, so with increased volume could be a reversal, otherwise a great chance to grab KAS at 10c!
Summary of Kaspa Signal Analysis:
1. Current Price and Monthly Chart
- Kaspa is trading at $0.124.
- Monthly chart shows consolidation with selling pressure, but 4-hour chart hints at bullish potential.
2. Head and Shoulders Pattern
- Potential head and shoulders pattern might push the price to test $0.10 support.
- This level is viewed as a possible bottom.
3. Weekly Chart Reversal Signs
- Last week's engulfing candlestick suggests a possible trend reversal.
- RSI and MACD indicate bearish momentum with a chance of further price drops.
4. Oversold Signals and Support
- Oversold RSI conditions near support could lead to a price rebound.
- Bearish MACD momentum appears to be slowing.
5. Daily Chart: Long-Legged Candlestick
- Indicates market indecision and potential weakening of bearish momentum.
- Requires strong green candlesticks for bullish confirmation.
6. 4-Hour Chart Bullish Divergence
- Price making lower lows while RSI makes higher highs points to bullish divergence.
- Engulfing candlestick suggests reversal, but additional confirmation is needed.
7. Critical Upcoming Sessions
- Next 2-3 sessions will reveal if a breakout or continuation of the downtrend occurs.
- Watch for strong green candlesticks or prolonged small candlestick bodies.
8. Resistance Levels
- Immediate resistance at $0.129, with the next level at $0.13.
- Possible outcomes: breakout, consolidation, or continuation of the downtrend.
9. Final Insight
- The next few 4h candlesticks are vital for confirming the bullish divergence and price direction.
Disclaimer: Not Financial Advice
This post is for informational and educational purposes only and should not be construed as financial or investment advice. Cryptocurrency investments are highly volatile and involve significant risk. Always conduct your own research (DYOR) and consult with a licensed financial advisor before making any investment decisions. The author of this post accepts no liability for any financial losses or decisions made based on the information provided. Trade responsibly!
KASPA - Poised for an Upward Trajectory (TA+TRADE PLAN)Technical Analysis of KASPA (KAS/USDT)
Falling Wedge Pattern:
The chart indicates a classic falling wedge pattern, a bullish reversal formation. The price is approaching the breakout point where resistance has converged with support, as marked on the chart.
The breakout above the resistance line suggests a potential upward trend.
Volume Analysis:
A spike in trading volume near the breakout area confirms increased interest and possible momentum shift.
Momentum Indicators:
VWMCipher B Divergences: Displays bullish divergence, supporting a potential price increase.
RSI (Relative Strength Index): At ~27, indicating oversold conditions. This signals a potential upward price movement as the asset appears undervalued.
Arty Money Flow Index (MFI): At ~24, indicating an oversold condition with possible accumulation.
Stochastic Oscillator: Oversold levels at 32.5, crossing upwards, indicating a buy signal.
Potential Targets:
Short-Term Target: $0.14 (breakout confirmation).
Mid-Term Target: $0.18 (previous resistance level).
Long-Term Target: $0.22–$0.24 (major resistance zone from earlier trends).
Risk Level:
Support at ~$0.12. A breakdown below this level invalidates the bullish thesis, making this a critical stop-loss level.
Trading Plan
Entry Points:
Initial Buy Zone: Enter near the breakout point (~$0.128-$0.132) to capitalize on bullish momentum.
Confirmation Entry: Add to the position once price closes above $0.14 with strong volume.
Stop Loss:
Place a stop-loss slightly below $0.12 (e.g., $0.118) to limit downside risk if the breakout fails.
Profit-Taking Strategy:
First Take-Profit (TP1): At $0.14 (~10% gain) to secure initial profits.
Second Take-Profit (TP2): At $0.18 (approximately 40% gain from entry).
Final Target (TP3): $0.22-$0.24 for long-term holders seeking maximum gains.
Position Sizing:
Allocate 2–5% of your portfolio, depending on your risk tolerance. Keep capital reserved for potential averaging down if needed.
Trailing Stop:
Implement a trailing stop once the price exceeds $0.18 to lock in profits while allowing room for further upward movement.
Risk Management:
Maintain a Risk-Reward Ratio of at least 1:3. Adjust trade size to manage risk effectively.
Monitoring:
Regularly check volume trends, RSI levels, and significant market news affecting KASPA.
Be cautious of overall cryptocurrency market sentiment, as broader trends often impact altcoins.
This falling wedge setup, combined with oversold indicators and volume confirmation, suggests KASPA is primed for a bullish breakout. Stick to the trading plan and employ disciplined risk management to maximize returns while minimizing potential losses.

Technical Analysis for KAS/USDT + TRADING PLANTechnical Analysis for KAS/USDT
Chart Pattern:
The Head and Shoulders 2X pattern (highlighted in orange) is forming, which suggests a potential reversal. This is a bearish pattern when it completes.
The neckline for the Head and Shoulders pattern aligns around the long support 1 (green line). A decisive breakdown from this support could confirm the bearish trend.
Key Support and Resistance Levels:
Resistance Line (Red): This upward resistance acts as a price ceiling, aligning with the upper boundary of the channel. Current resistance is near $0.25-$0.30.
Long Support 1 and 2 (Green):
First support aligns at approximately $0.12-$0.14 (immediate support).
Second, stronger support lies near $0.09-$0.10 if breakdown occurs.
Intermediate Support (Blue): The long-term trendline below the neckline provides another zone of support.
Trend Outlook:
Short-Term (Bearish to Neutral): Price is consolidating near $0.14. The dotted path shows potential upward movement, but breaking the neckline could lead to a downside push.
Medium-Term (Bullish Potential): If the price holds support and breaks above $0.17-$0.20, Kaspa could return to an upward trajectory within the channel.
Long-Term (Bullish Channel): The broader channel remains intact, and price action could resume its uptrend toward resistance near $0.30.
Indicators Analysis:
Volume: Volume is relatively low, indicating low buying pressure. A breakout requires higher volume.
RSI (Relative Strength Index):
Current RSI: Near 54. This is neutral territory.
Observation: RSI must remain above 50 to support an upward trend.
Money Flow Index (MFI):
The MFI shows a slight upward trend at 32, which suggests weak buying interest.
Stochastic Oscillator:
Stochastic is near 12, indicating a potential oversold condition, which may lead to a short-term bounce.
Trading Plan
Short-Term Strategy (1-2 weeks):
Buy Zone: If Kaspa retests support at $0.12-$0.14, consider accumulating small positions.
Stop-Loss: Place a stop-loss below $0.12 to protect against breakdown.
Target 1: $0.17 (short-term resistance).
Target 2: $0.20 (key breakout level).
Medium-Term Strategy (1-3 months):
Breakout Trade: Enter long positions if price closes above $0.17-$0.20 with strong volume confirmation.
Stop-Loss: Adjust stop-loss to $0.14 after breakout.
Target: $0.25 (resistance near the top of the upward channel).
Long-Term Strategy (3-12 months):
Channel Trend: Continue holding positions if the price respects the long-term support levels and upward channel trendline.
Target: $0.30-$0.35 (upper resistance).
Risk Management:
Position Sizing: Limit exposure to 2-5% of total portfolio on each trade.
Trailing Stop: Use a trailing stop once price hits $0.17-$0.20 to lock in profits.
Kaspa remains in a critical phase with potential for both upward breakout or breakdown. Watch the $0.14 neckline and volume closely. Traders can capitalize on support bounces or confirm long positions above $0.17-$0.20 for better risk/reward setups.

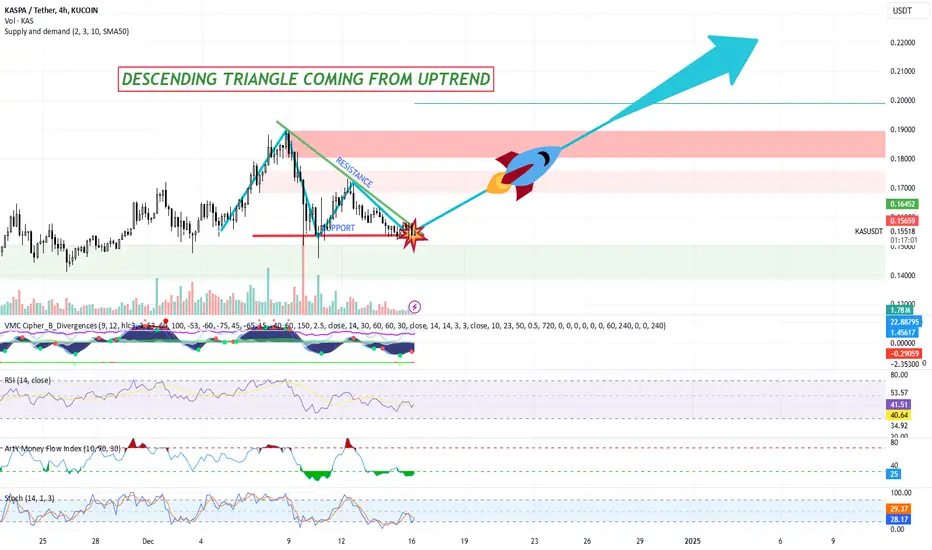
Technical Analysis of KASPA (KAS/USDT) + TRADE PLANPrice Action and Trend Structure:
Uptrend Formation: The chart shows an uptrend leading into the formation of a descending triangle pattern. The price has seen a significant rise, but the recent price action shows consolidation within a triangular range, indicating a potential for either continuation or reversal.
Descending Triangle: The descending triangle is characterized by lower highs and a horizontal support level. This pattern typically signals a bearish breakout if the support level is broken. However, if the price holds the support and breaks above the resistance, a bullish move could be expected.
Current Price Levels:
Support Level: Around 0.1559 (a crucial level to watch for potential breakdown).
Resistance Level: Around 0.1645 (near the upper trendline of the triangle).
Target Zone: If the price breaks above resistance, the next target could be in the range of 0.19 to 0.22, where higher resistance is likely.
Volume Analysis:
Volume Trend: There is a noticeable increase in volume during the down move, suggesting market participants are hesitant, but not necessarily driving a strong sell-off.
The relatively lower volume during price consolidation could imply that the market is waiting for a breakout, either bullish or bearish.
Momentum Indicators:
RSI (Relative Strength Index): The RSI currently sits at 41.32, which is in the neutral zone. This indicates neither overbought nor oversold conditions, suggesting that the price could break in either direction, depending on the next catalyst.
VMC Cipher B Divergence: The divergence shows a potential weakening in the bearish momentum, which could be a signal that the downtrend might be losing strength. However, the market is still within a consolidation phase, so confirmation from price action is needed.
Stochastic Oscillator: The stochastic indicator is at 29.13, which suggests the asset is nearing an oversold condition, with potential for a rebound or reversal if the price breaks upwards.
Other Indicators:
Art Money Flow: At 40.63, the flow is in the neutral range, with no strong buying or selling pressure. This indicates that the market is in a waiting phase, with traders potentially looking for confirmation of a breakout.
Trading Plan for KASPA (KAS/USDT)
Bullish Scenario (Breakout Above Resistance):
Entry Point: If KASPA breaks above the resistance at 0.1645, look to enter a long position.
Target Price: Aim for a price target around 0.19 to 0.22, where higher resistance exists.
Stop Loss: Set a stop loss around 0.15, just below the key support level to minimize risk in case of a breakdown.
Risk-Reward Ratio: This strategy would offer a favorable risk-reward ratio, especially if the price targets are reached.
Bearish Scenario (Breakdown Below Support):
Entry Point: If the price breaks below the support at 0.1559, consider entering a short position.
Target Price: The target for this move could be 0.14, with the potential for further downside depending on market conditions.
Stop Loss: Place a stop loss just above the broken support (around 0.16) to limit losses in case of a false breakdown.
Risk-Reward Ratio: This strategy also provides a favorable risk-reward if the breakdown sustains.
Trade Confirmation:
Volume Confirmation: Ensure that any breakout or breakdown is accompanied by a significant volume increase, confirming the validity of the move.
Momentum Indicators: Use the RSI, Stochastic, and Money Flow indicators to monitor if the momentum supports the direction of the breakout. For bullish trades, look for an RSI above 50 and the Stochastic moving out of oversold territory.
Long-Term Outlook:
Should the price break the upper resistance and rally above 0.22, the next resistance zone could extend to 0.25 or higher, indicating potential for a longer-term bullish trend.
Conversely, if the breakdown below 0.15 results in sustained selling pressure, watch for deeper corrections or consolidation at lower levels.
Summary:
Watch for a breakout above 0.1645 for potential bullish momentum targeting 0.19-0.22.
Watch for a breakdown below 0.1559 for a bearish move targeting 0.14.
Ensure trade confirmation with volume analysis and momentum indicators.
By following this plan, you can effectively manage risk while taking advantage of KASPA's price action.
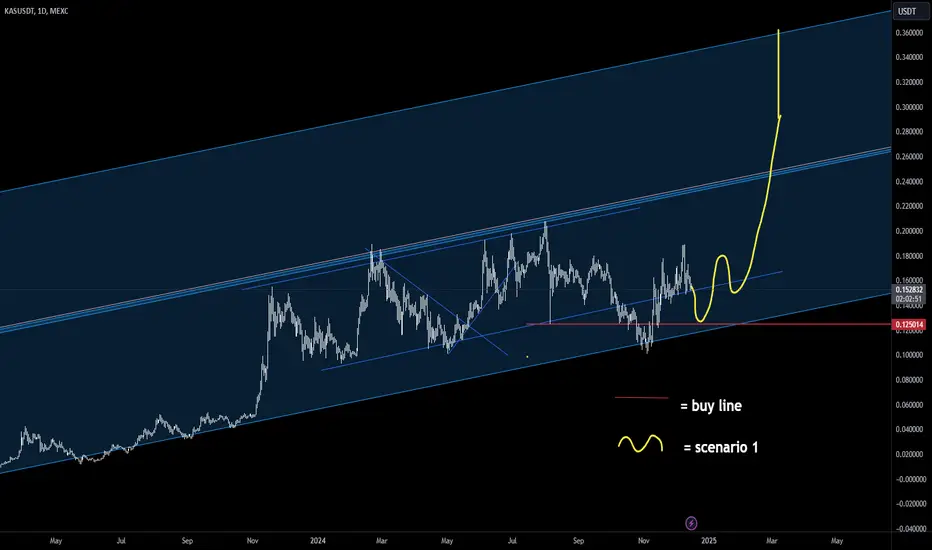
KASPA price scenario dec 16 2024KASPA price scenario dec 16 2024
Kas has still some work to do to break out up the channel in my opinion
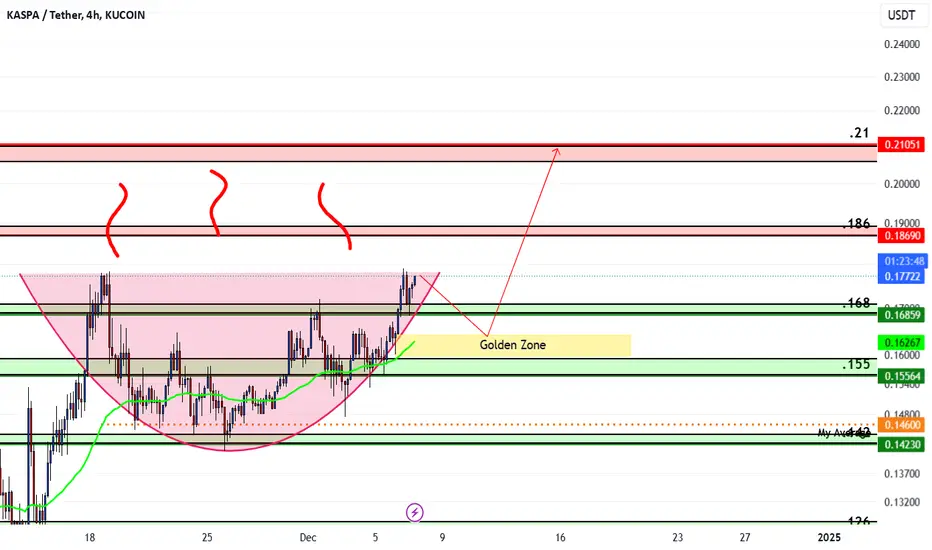
Kaspa looking good Currently, kaspa looking good. local bottom signals with some nice bullish divergences at the .786. Market structure looks mighty fine currently. we will see.

Ridiculous capitulation, nice 3 drives, hi vol and RSI OS alert Ridiculous capitulation, nice 3 drives, hi vol and RSI OS alert
nice 3 drives, hi vol and RSI OS alert,
HiLoCh indicator on 30m TF
1. 3 drives down from the break
2. High vol and b Vol profile on the candle.
3. - had a double event, unusual but should have been safe if waited for the close above the main body of the profile.
got the alerts, waited for the close above the profile, trade with good positon sizing and stop losses.

Kaspa potential cup and handle pattern Kaspa looks like its setting up to make the handle on this pattern soon
lets see how it plays out
KAS with a nice little flag hereKAS with a nice little flag here, i've scaled out quite a bit so might try to get back in here at the top of this 4H OB and high vol candle
