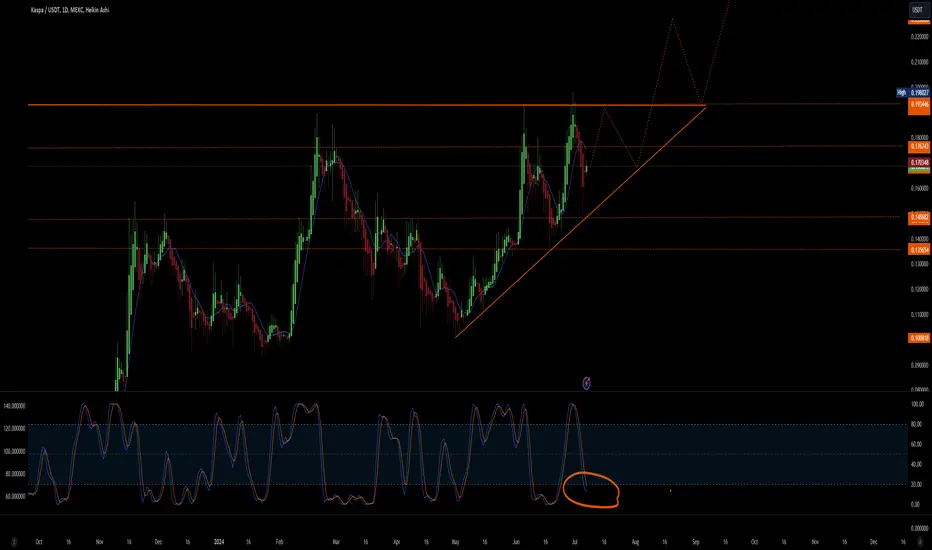
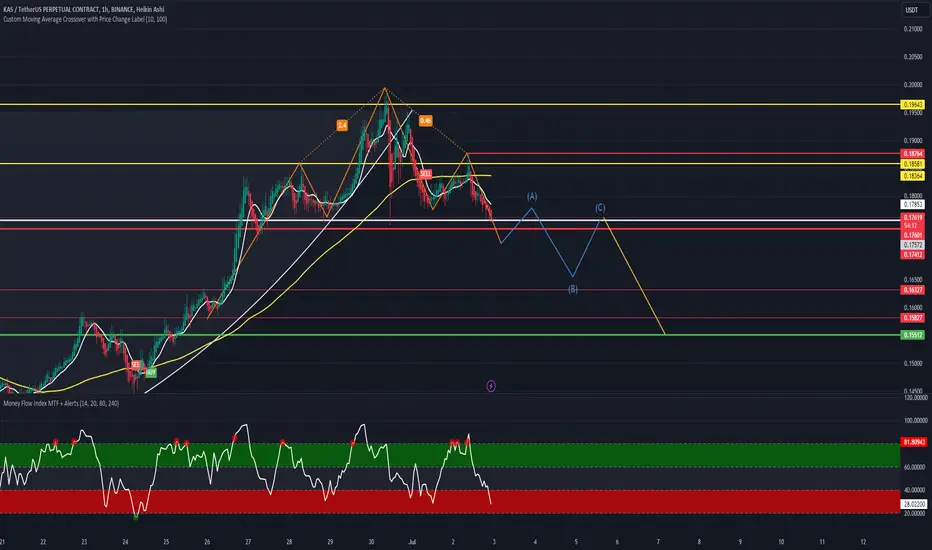
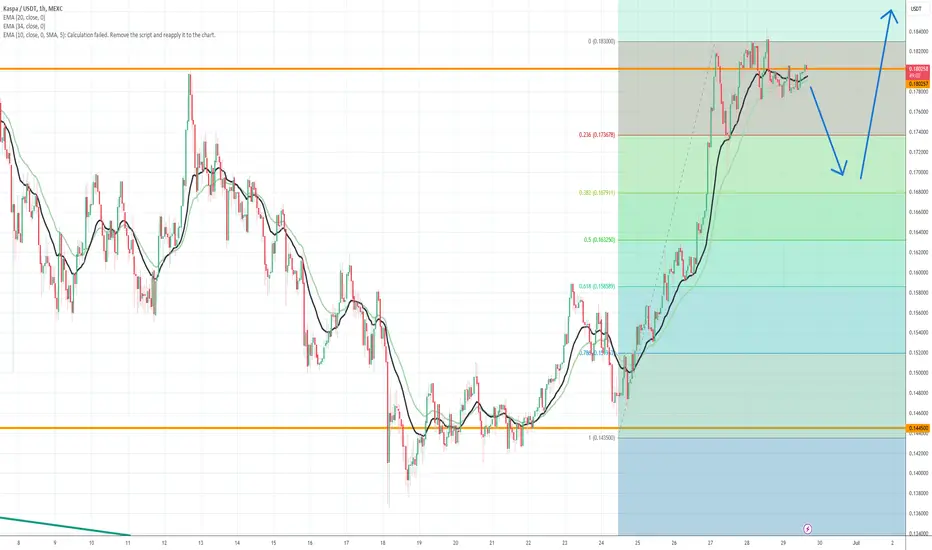
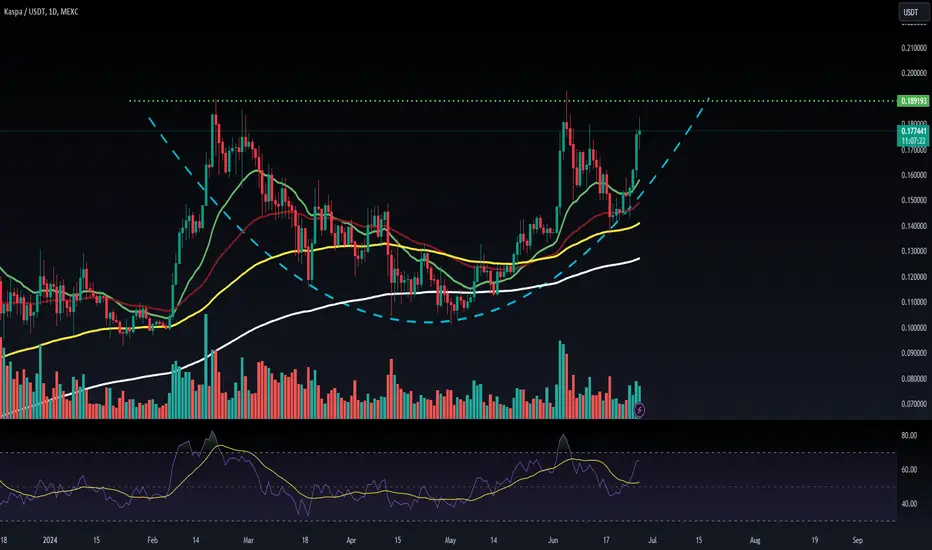
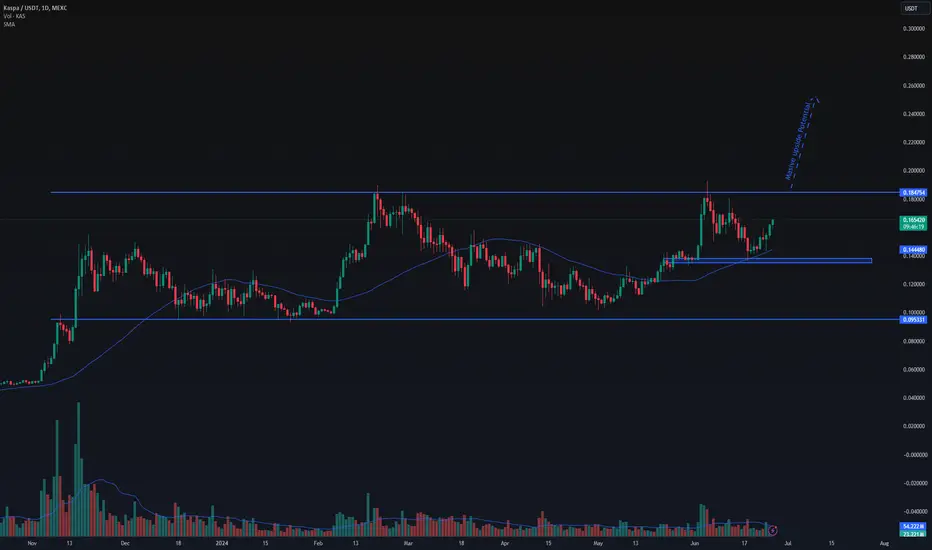
Kaspa - daily chartKaspa - daily chart: The ascending triangle is getting clearer.
The chart suggests a bullish structure with the formation of an ascending triangle. At the bottom of the chart it shows a stochastic oscillator that is currently at low levels (circled in orange), suggesting that the asset may be oversold and reinforcing the upward movement. If the price manages to break the resistance at 0.198027 USDT, it is We are likely to see a continuation of the uptrend.
On the other hand, the loss of the ascending trendline could signal a possible reversal.
NextSupports: 0.1486 / 0.1351
Next Resistances: 0.1767 / 0.1934
KASUSDT trade ideas
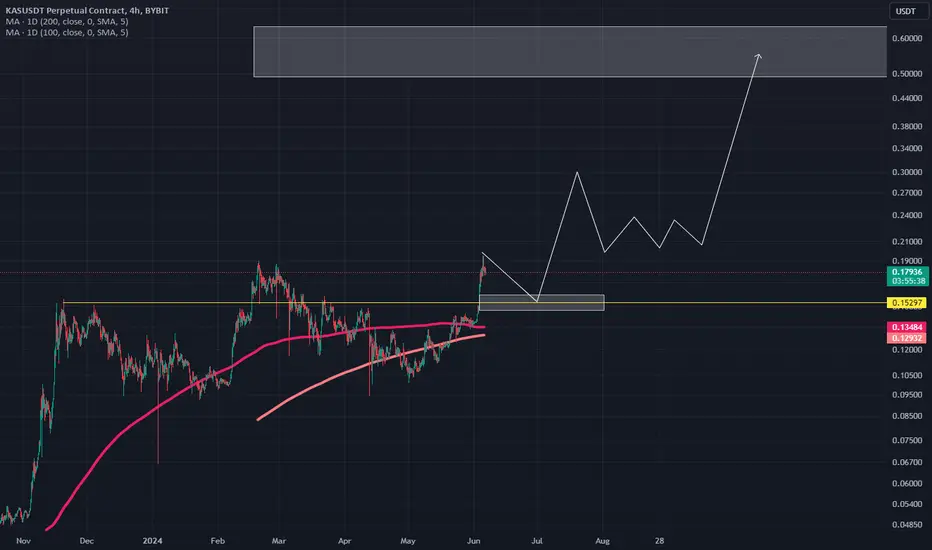
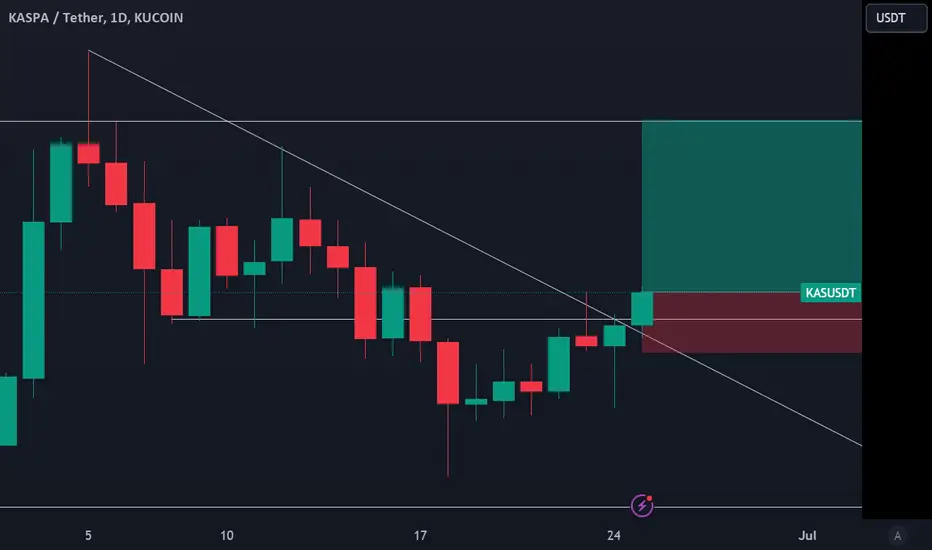
KASPA CHANCE FOR LONG (FUTURES TRADE)A coin that has a similar movement as the ADA cardano in 2021, and also of fundamental quality. It is one of the coins that appeared first in terms of strength when the euphoria began in 2023. Now it would be wisest to be patient because futures are in question.
When we look at the futures trade, wait for the FVG to fill up, which would lead to a drop of 20% (the probabilities are small, but the point is certainty)
When we invested it was low 0.11 and 0.12, now we approach completely differently. And if we miss a trade, our money is still working for us.
This is a very important reaction because it shows that customers have taken over and that the correction is complete. We were in that range for a long time, a huge consolidation. I can very well target $0.55, but for now it is important to follow the set up.
Feel free to show support with like,
Uncertainty Looming Over $KAS - KASPAAfter the recent hiccup with KRC20, the price action is starting to look bearish, but it's still uncertain. It may be that the market is waiting for news to react. This is not financial advice but merely my personal observation.
Disclaimer: The information provided here is for educational purposes only and does not constitute a buy or sell recommendation. I am not a financial advisor and I reserve the right to be incorrect. Do not make trading decisions based on information from the internet. Always consult your financial advisor or conduct your own research before making any investment decisions.
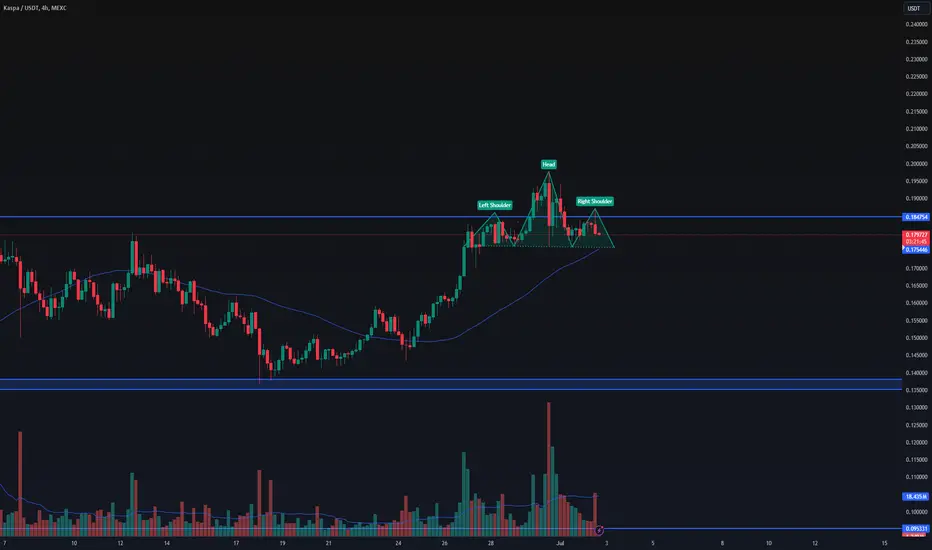
KAS Performing Head and Shoulder Pattern NowCarefully Check. KAS was about to form Handle Pattern of the cup. Unfortunately it could not and Viewing From 2 Hours Time flame KAS is forming Head and Shoulder Pattern now. Waite for the breakout Expect downside for the up coming days.
KAS PriceThe Kaspa token has made a rounding bottom formation and recorded a fresh breakout in the last sessions, leading to a new ATH mark of $0.198 this week.

Based on the 100 EMA Like to take the middle road.Based on 100 EMA .20+ support with a low of +- .14 if goes flat and we have another major flash selloff of BTC. Showing trend to oversold . Beginning to see the starts of a new ramp .

I take an entry to short $KAS today.CRYPTOCAP:KAS can be relaxed at 0.1965 or CRYPTOCAP:KAS bullish may stay out from running long way. bear is coming soon.
KAS/USDT Technical Analysis in 2-Day Timeframe.Hello everyone, I’m Cryptorphic.
For the past seven years, I’ve been sharing insightful charts and analysis.
Follow me for:
~ Unbiased analyses on trending altcoins.
~ Identifying altcoins with 10x-50x potential.
~ Futures trade setups.
~ Daily updates on Bitcoin and Ethereum.
~ High time frame (HTF) market bottom and top calls.
~ Short-term market movements.
~ Charts supported by critical fundamentals.
Now, let’s dive into this chart analysis:
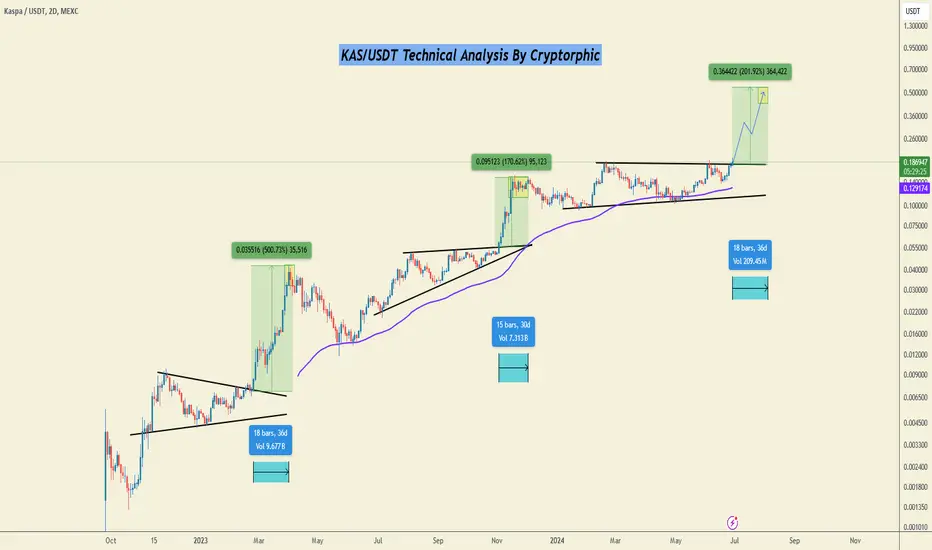
KAS in the last 48 hours made a new all-time high of $0.198, breaking out above the current resistance level of $0.183.
In the past, whenever KAS broke out above the resistance, it made some outstanding rallies.
Initial Breakout:
~ Period: Late 2022 to early 2023
~ Breakout Point: $0.007
~ Performance: Following the breakout from the symmetrical triangle, KAS/USDT witnessed an impressive upward move, achieving a staggering gain of 500.73%.
Consolidation and Second Rally:
~ Period: Mid-2023
~ Breakout Point: $0.022
~ Performance: The ascending triangle pattern indicated a bullish continuation, which played out with a 170.62% rise from the breakout point.
Current Structure:
~ Breakout Potential: KAS is currently breaking out of another resistance trendline, suggesting a bullish continuation.
~ Projected Target: Based on the height of the triangle, the projected price target is $0.55, representing a potential gain of 201.92% from the breakout point.
Moving Averages:
The chart shows the 100EMA (in purple) acting as dynamic support, consistently supporting the price during pullbacks.
Buy Zone: Consider entries around the breakout point ($0.18).
Targets: $0.32 to $0.54.
Invalidation Point: KAS breaking down and getting rejected below the current resistance.
DYOR. NFA.
Please hit the like button to support my content and share your thoughts in the comment section. Feel free to request any chart analysis you’d like to see!
Thank you!
#Kaspa
Tell me this ain’t a strong break out happeningLooking at the weekly chart, daily chart, and five minute chart you can clearly see we are in a breakout you didn’t get in right now. I’m not a financial advisor.

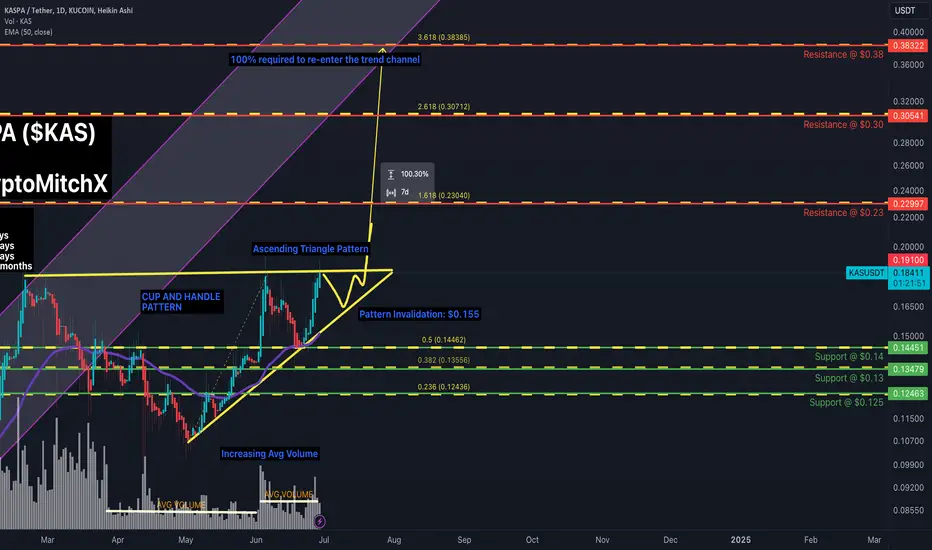
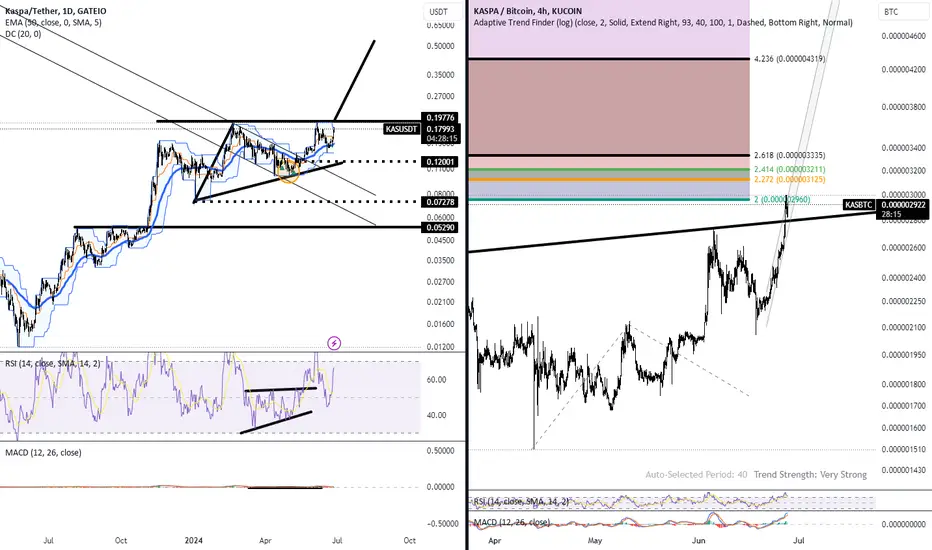
KAS below channel with C&H pattern + ascending triangleKAS is booming in popularity on Twitter/X.
Proof of work token featuring BlockDAG technology.
BLOCKDAG Feature: multiple transactions are added to blockchain in a web-like formation
vs
BLOCKCHAIN: Single transactions added to the chain in a single line.
Cup and Handle Pattern formed and playing out.
Turned into an Ascending Triangle.
Both of these are large bullish formations.
Future Resistances based on Fibonacci Levels: $0.23, $0.30, $0.38
Triangle Invalidation Level: $0.155
Support Levels: $0.14, $0.13, $0.125
Average Volume increasing from last month.
KASPA showing strength and continuing to consolidate to upsideKASPA showing strength and continuing to consolidate to upside

buy again at 0.1680I think Kaspa need a little turn down and then go up again...
0.18 is strong rersistance
.... think 0.1680 ( or lower ) would be nice enter
OMG Look A Butterfly...Low Risk High Reward setup here...I've had to spell it out in so many ways I guess...but anyway thar she blows I think.
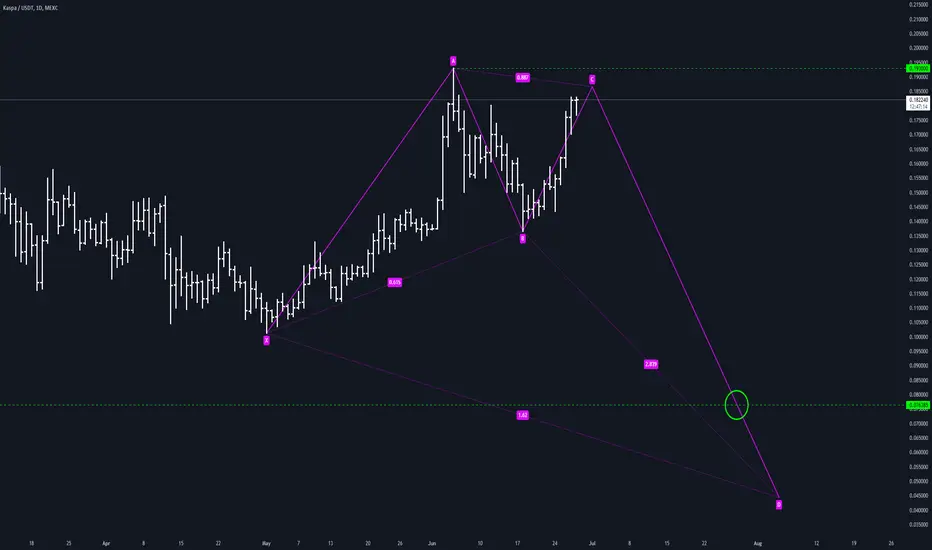
Doing It Bigly...The time has come for the music to stop for kaspa - Expecting this to enter a long corrective phase...damp it.
KAS Looking Bearish in short termKAS Making double top and bearish divergence in 1hrs, should sell to get short term profit

KASPAdyor - nfa, see previous posts and good luck!
-continuation pattern, loose targets into .25/.30 with pattern target into .55 cents
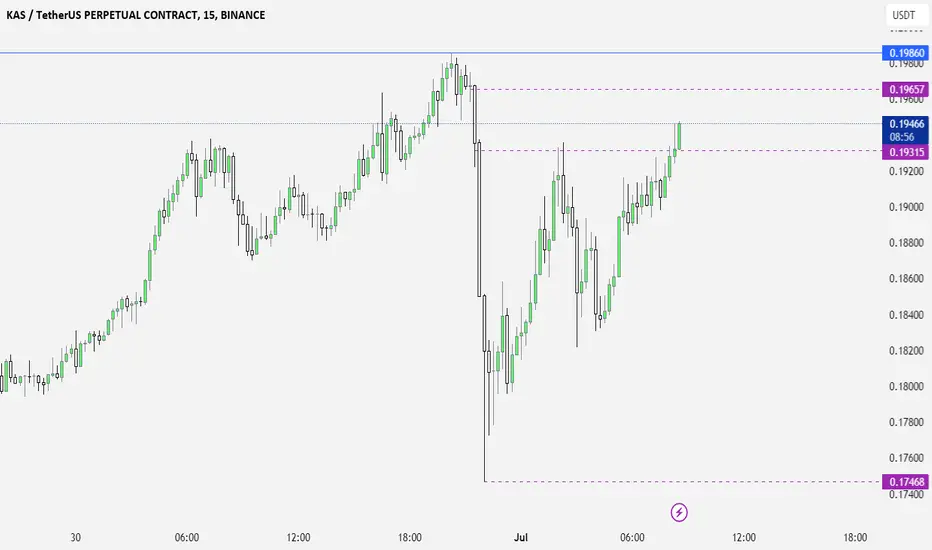
#KAS/USDT breaks the Diagonal Trendline in 1-Hour TF!#KAS/USDT breaks the Diagonal Trendline in 1-Hour TF!
CRYPTOCAP:KAS looking bullish here. Wait for PWH $0.01619 to successfully retest to long it. #KASUSDT's local resistance level is PWH $0.19175, and the local support level is PMH $0.1443.
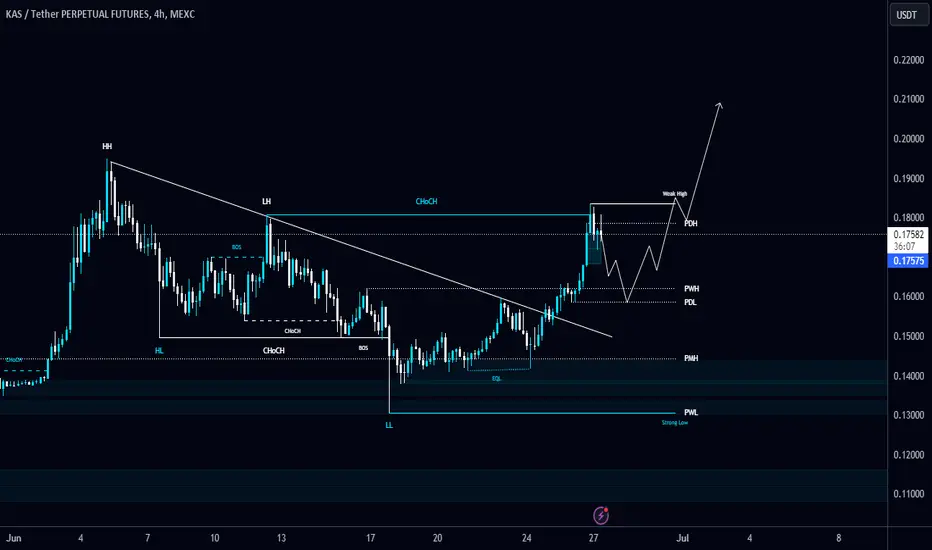
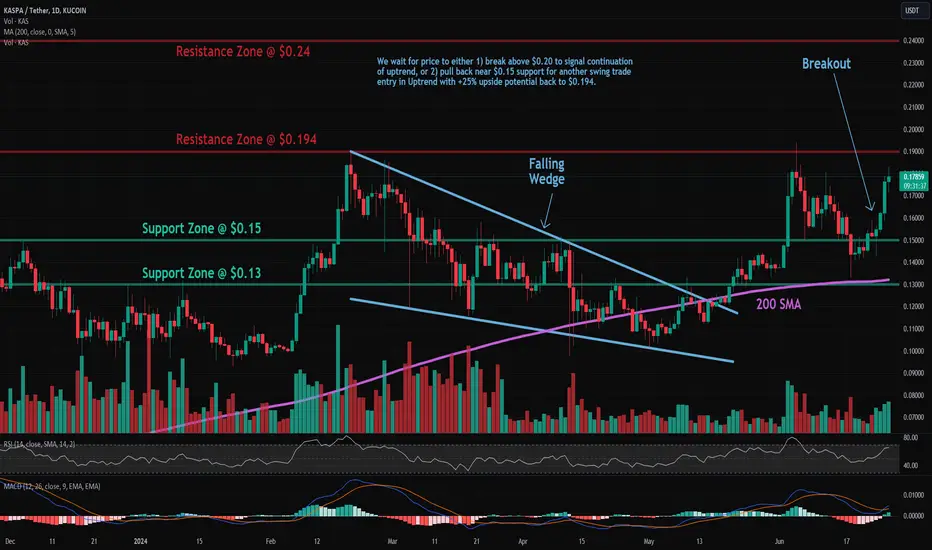
KAS: Approaching ResistanceTrade setup : Remain in an Uptrend. It pulled back briefly but made a Higher Low (sign of Uptrend) and broke back above $0.15 key level. Momentum has inflected bullish (MACD Histogram bars are rising). Price is now approaching our near-term target $0.194 for a +25% gain. Now we look for the right entry opportunity in Uptrend. We wait for price to either 1) break above $0.20 to signal continuation of uptrend, or 2) pull back near $0.15 support for another swing trade entry in Uptrend with +25% upside potential back to $0.194.
Pattern : Price is Approaching Resistance , which is a level where it could pause or reverse its recent advance, at least temporarily. Resistance is often a level where price got rejected in the past, or potentially prior Support level that was broken. (concept known as polarity). Once price breaks above resistance, it can advance higher to the next resistance level. Learn to trade key levels in Lesson 7.
Trend : Short-term trend is Strong Up, Medium-term trend is Up and Long-term trend is Strong Up.
Momentum : Price is neither overbought nor oversold currently, based on RSI-14 levels (RSI > 30 and RSI < 70).
Support and Resistance : Nearest Support Zone is $0.15, then $0.13. Nearest Resistance Zone is $0.194, then $0.24.
KAS PriceTraded in the upward trajectory, Kaspa token price persisted in forming the higher high swings and molded the eyes to breach its ATH mark of $0.1826.
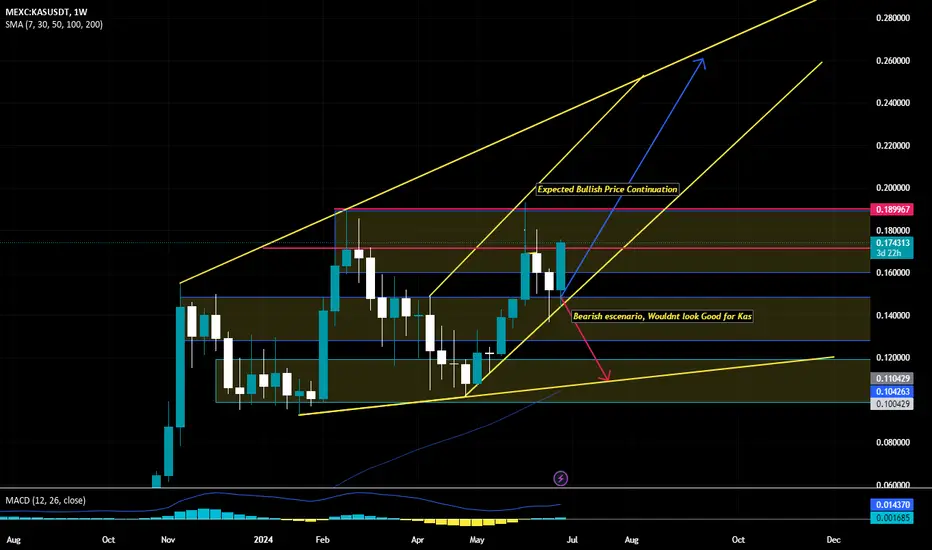
Bullish Pattern forming on KasIf the Weekly candle Closes above the last one, this would look excellent for kaspa and its investors.
Kaspa ($KAS) on the Verge of a Breakout? Key Levels to Watch!Kaspa Chart Anaylsis:
The price action shows a potential for an upmove once it breaks out of the resistance level.
Volume is increasing which indicates interest.
Disclaimer: The information provided here is for educational purposes only and does not constitute a buy or sell recommendation. I am not a financial advisor and I reserve the right to be incorrect. Do not make trading decisions based on information from the internet. Always consult your financial advisor or conduct your own research before making any investment decisions.
long KASKaspa broke through the descending trendline and the resistance level. The bullish movement to $0.1842 is expected to happen.
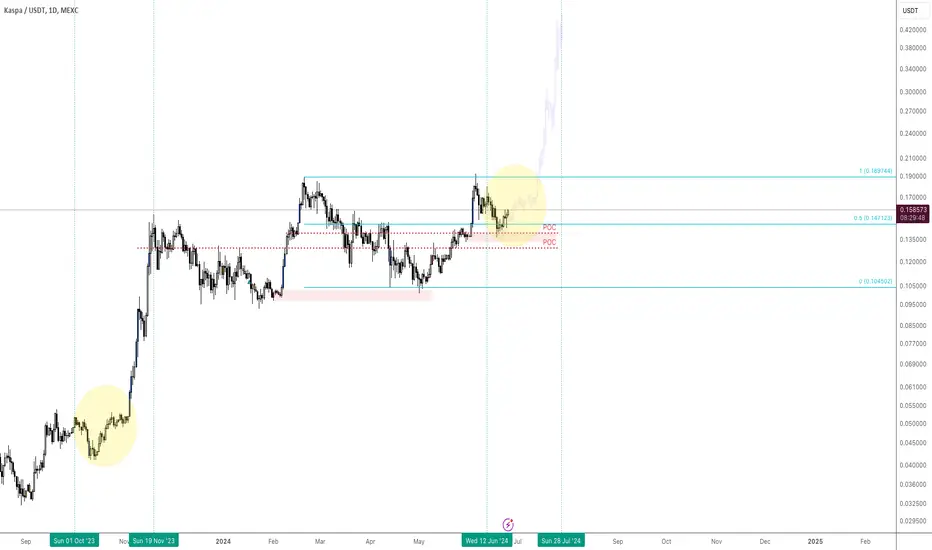
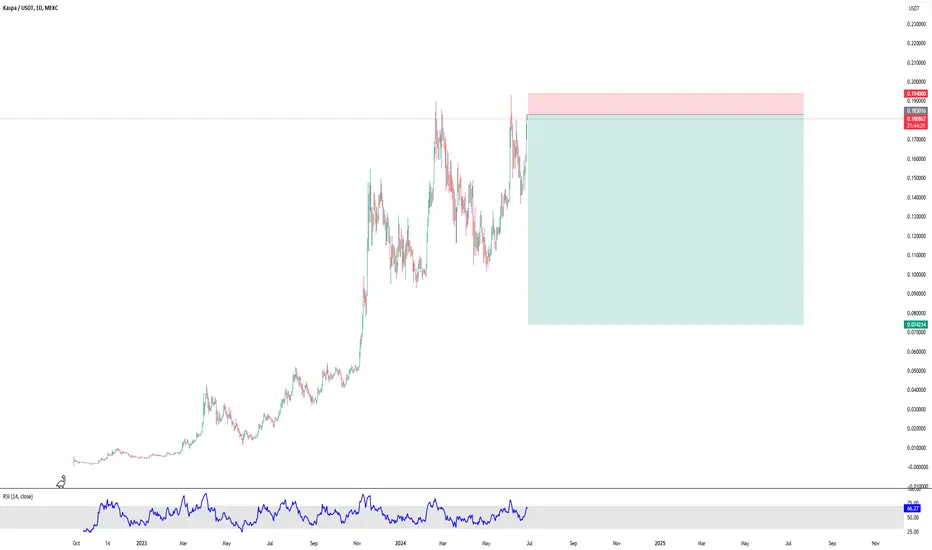
KASKAS on the HTF seems it is doing a similar pattern with the November consolidation below ATH before explosive expansion.
More of a HTF guide than actual trading based on it but helps with spot bags conviction