Buy KAVAKava is a decentralized finance (DeFi) platform built on the Cosmos blockchain, designed to offer a wide range of financial services, including lending, borrowing, and staking. Known for its interoperable network architecture, Kava enables users to access various DeFi services in a highly secure, sc

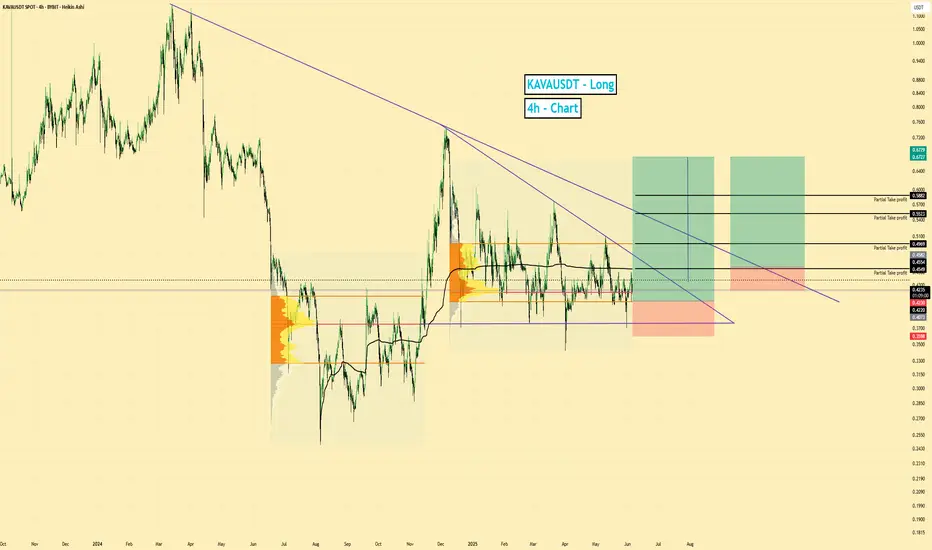
KAVAUSDT | Potential Long | POC Support | (June 5, 2025)KAVAUSDT | Potential Long | POC Support + Daily Money Flow Shift | (June 5, 2025)
1️⃣ Insight Summary:
KAVA is currently trading below the value area low and near the Point of Control (POC), suggesting a key decision zone. Despite short-term weakness, the daily money flow is starting to turn positi
Kava : Day trade volumeKava can show new volume on day trade volume. We will follow this coin in the coming time frames for the uptrend.

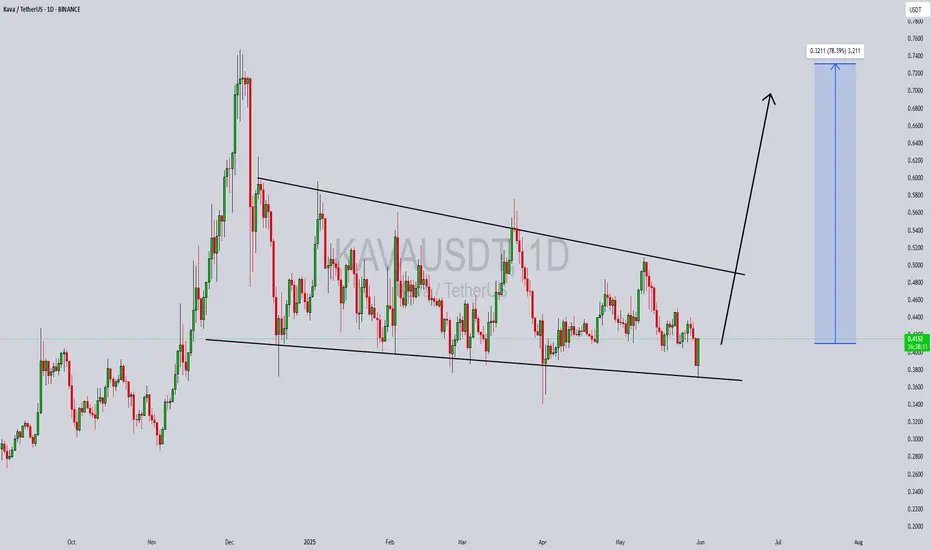
KAVAUSDT Forming a Bullish WaveKAVAUSDT is currently presenting a strong bullish wave pattern formation on the daily timeframe, hinting at a potential continuation of the upward trend. After a period of consolidation, KAVA has started to push higher with increasing bullish momentum. This movement is accompanied by solid volume, s
KAVA USDT LONGKAVA is breaking out From massive Falling Wedge in Weekly Time Frame,
Everything is supportive here from Fundamentals to Price action with RSI

KAVA ANALYSIS📊 #KAVA Analysis
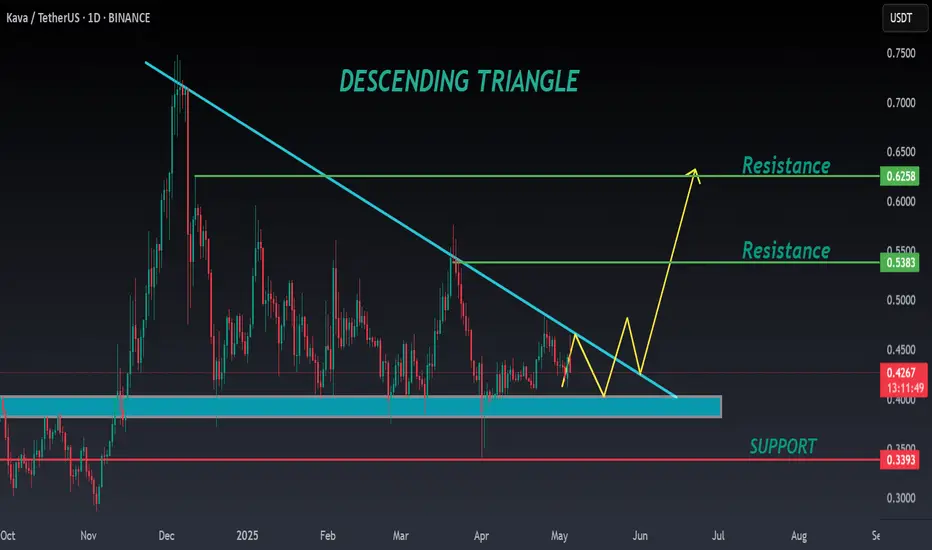
✅There is a formation of Descending triangle pattern on daily chart 🧐
Pattern signals potential bullish movement incoming after a breakout.
👀Current Price: $0.4280
🚀 Target Price: $0.5380
⚡️What to do ?
👀Keep an eye on #KAVA price action and volume. We can trade according t
KAVAUSDT UPDATEPattern: Falling Wedge Breakout
Current Price: $0.4567
Target Price: $0.74
Target % Gain: 60.53%
Technical Analysis: KAVA has broken out of a long-term falling wedge on the 1D chart, with strong bullish momentum and price closing above the trendline resistance. This breakout signals potential co

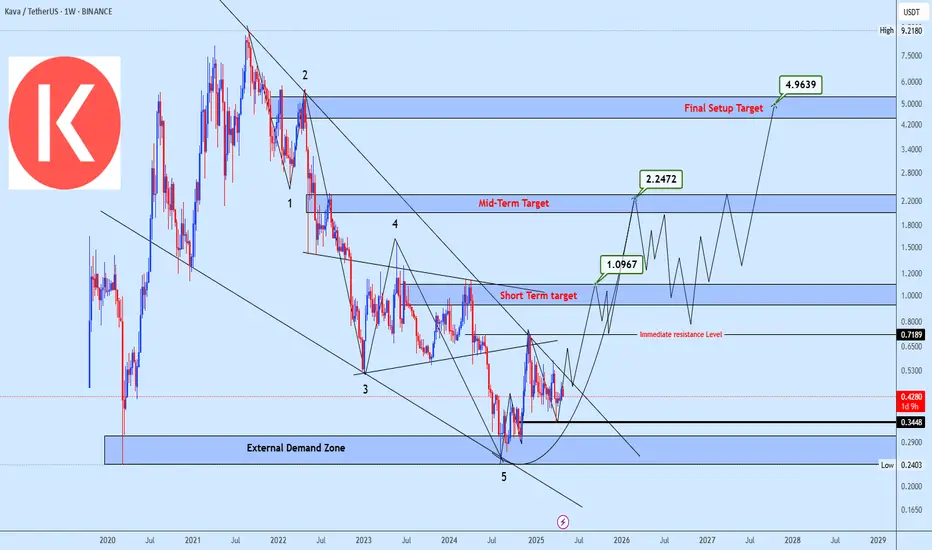
Kava potential Reversal and Target ProjectionKAVA is forming a potential bullish reversal after completing Wave 5 within a descending channel, reaching the External Demand Zone. A rally from current levels is anticipated, with initial support at the Immediate Resistance Level.
The setup targets a short-term move to 1.10, then mid-term at 2.2
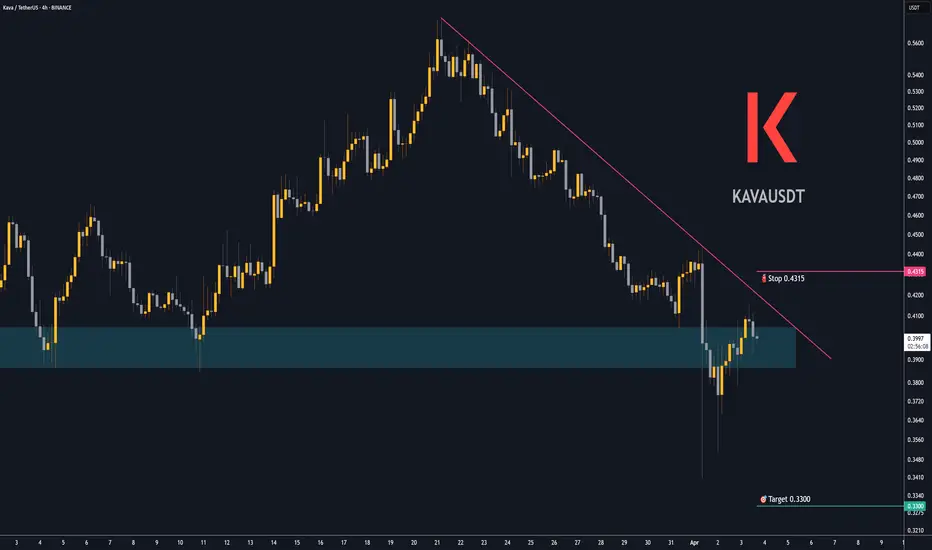
Trading opportunity for KAVAUSDTBased on technical factors there is a Sell position in :
📊 KAVAUSDT
🔴 Sell Now
🪫Stop loss 0.4315
🔋Target 0.3300
📏 R/R 2
💸RISK : 1%
We hope it is profitable for you ❤️
Please support our activity with your likes👍 and comments📝
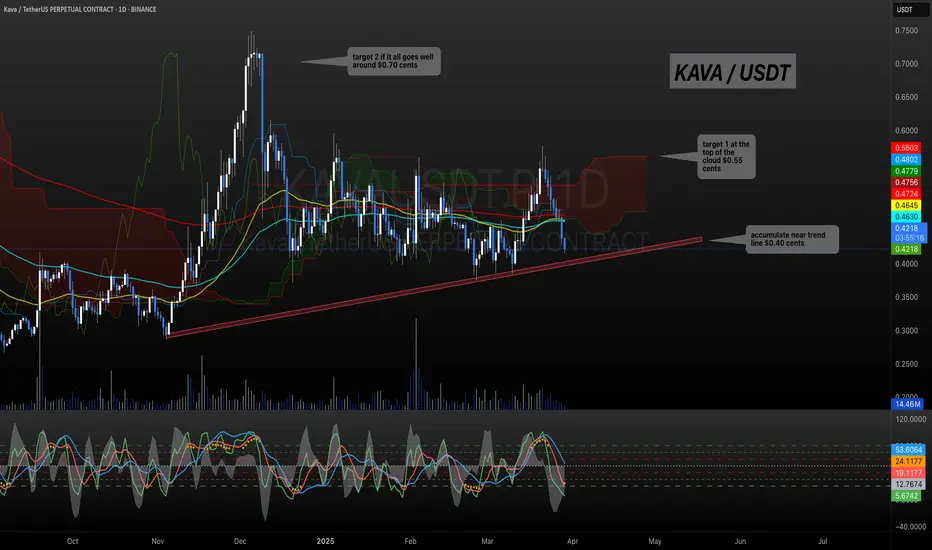
KAVA / USDT - Turning TablesEvening friends,
I've been keeping an eye on Kava, and if the market doesn't shit the bed we might be looking into big gains coming up the next couple of weeks.
Always do your own research, but I do like this coin as it has got good fundamentals.
Trade thirsty!
See all ideas
Summarizing what the indicators are suggesting.
Oscillators
Neutral
SellBuy
Strong sellStrong buy
Strong sellSellNeutralBuyStrong buy
Oscillators
Neutral
SellBuy
Strong sellStrong buy
Strong sellSellNeutralBuyStrong buy
Summary
Neutral
SellBuy
Strong sellStrong buy
Strong sellSellNeutralBuyStrong buy
Summary
Neutral
SellBuy
Strong sellStrong buy
Strong sellSellNeutralBuyStrong buy
Summary
Neutral
SellBuy
Strong sellStrong buy
Strong sellSellNeutralBuyStrong buy
Moving Averages
Neutral
SellBuy
Strong sellStrong buy
Strong sellSellNeutralBuyStrong buy
Moving Averages
Neutral
SellBuy
Strong sellStrong buy
Strong sellSellNeutralBuyStrong buy
Displays a symbol's price movements over previous years to identify recurring trends.