KBBB - I won't be surprised if THEY want to hit the BLUE line :)WHOEVER IS BEHIND THIS GAME – I won't be surprised if THEY want to hit the BLUE line.
Indicators & Volume
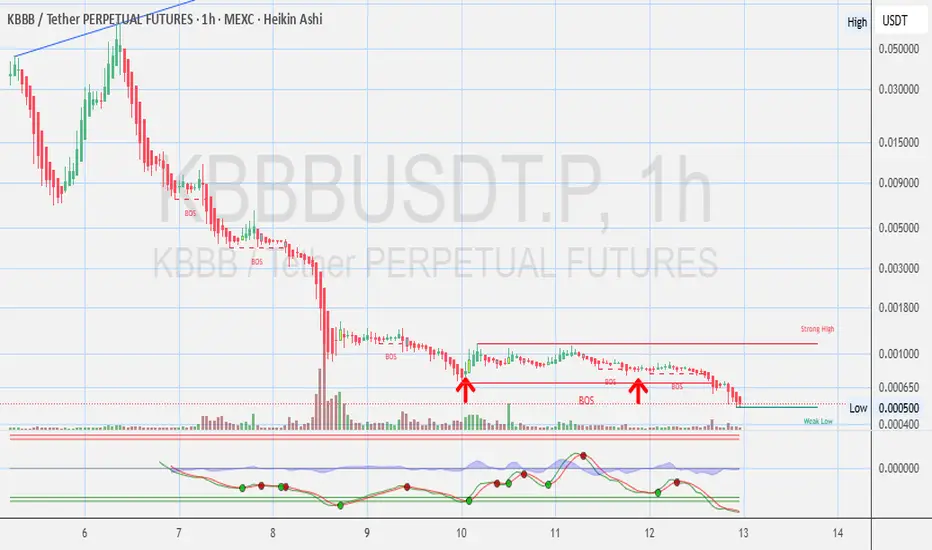
Volume Spike at Bottom: A large green volume bar formed during the last leg down, suggesting potential bottom-fishing or short covering.
BOS Labels ("Break of Structure"): Several BOS points during the decline confirm the bearish structure. No bullish BOS is visible yet — indicating trend has not reversed.
MACD/RSI-style Indicator (Below Chart):
Appears to show bullish momentum divergence: The price made lower lows, but the momentum is slightly rising.
Green dots on the indicator line signal a potential local bottom, but not yet strong confirmation of trend reversal.
-----------------------
Disclosures:
NO positions.
This analysis is for informational purposes only and is not financial advice. It does not constitute a recommendation to buy, sell, or trade any securities, cryptocurrencies, or stocks. Trading involves significant risk, and you should consult with a qualified financial advisor before making any investment decisions. Past performance is not indicative of future results.
KBBBUSDT.P trade ideas

KBBB - Any Opinions for 4 Hours Chart ?📉 Trend Overview
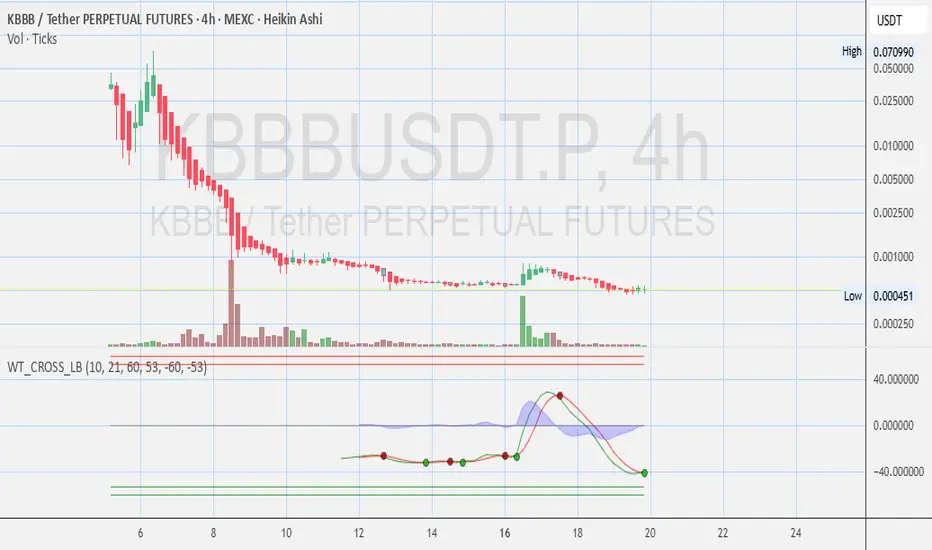
Major Downtrend continues — price has collapsed from above $0.05 to current levels around $0.00047, a >99% drop.
📈 WaveTrend Oscillator (WT_CROSS)
WT oscillator is deep in the oversold region (below -40), which often indicates exhaustion in the downtrend.
- Green dot printed on the oscillator = possible bullish crossover signal.
- However, signal lacks volume confirmation, and previous green dots in this downtrend have only led to small upticks.
⚠️ Key Levels
- Support Zone (Low): Around $0.000451 (marked on chart).
- First Resistance: Around $0.0007–$0.0010 (previous consolidation area).
- Breakout Zone: Above $0.0014, which would indicate a possible structural reversal.
✅ Bullish Signs
Oversold oscillator + sideways consolidation = potential base building.
Price hasn’t broken further down since June 16 low, which could hint at short-term exhaustion by sellers.
--
Disclosures:
This analysis is for informational purposes only and is not financial advice. It does not constitute a recommendation to buy, sell, or trade any securities, cryptocurrencies, or stocks. Trading involves significant risk, and you should consult with a qualified financial advisor before making any investment decisions. Past performance is not indicative of future results.
KBBB - 4 Hour Chart - $800K Market Capital - Any Opinions?$KBBB 4 Hour Chart: Stoch RSI Shows Potential Reversal Momentum.
Any Opinions for ?
Trend Reversal?
- First sign of reversal after prolonged downtrend.
- CHoCH and volume spike give early bullish confirmation.
Next Target Zones:
- If upward move continues, next resistance sits around 0.000850 – 0.000900.
- A confirmed close above 0.000100 could target 0.003000 zone.
Caution:
- Overbought Stoch RSI = possible retest of 0.000650 – 0.000700 support range before next move up.
- Watch for higher lows forming to confirm bullish momentum.
✅ Investor-Friendly Summary (Compliant):
$KBBB/USDT (3H): After a long decline, price has broken above structure with a bullish signal. Volume supports the move, though momentum indicators show short-term overbought conditions. Support around 0.000650 may be key if a pullback occurs. Eyes on 0.000850+ if bullish continuation follows.
Disclosures:
This analysis is for informational purposes only and is not financial advice. It does not constitute a recommendation to buy, sell, or trade any securities, cryptocurrencies, or stocks. Trading involves significant risk, and you should consult with a qualified financial advisor before making any investment decisions. Past performance is not indicative of future results.

KBBB - 1 Hour Chart - $540K Market Capital - Opinions?1 Hour Chart: Stoch RSI Shows Potential Reversal Momentum.
Any Opinions?
Disclosures:
This analysis is for informational purposes only and is not financial advice. It does not constitute a recommendation to buy, sell, or trade any securities, cryptocurrencies, or stocks. Trading involves significant risk, and you should consult with a qualified financial advisor before making any investment decisions. Past performance is not indicative of future results.
KBBB 45Min Chart Stoch RSI Shows Potential Reversal AnyOpinios? 45-Min Chart: Stoch RSI Shows Potential Reversal Momentum Any Opinions?
Disclosures:
No positions.
This analysis is for informational purposes only and is not financial advice. It does not constitute a recommendation to buy, sell, or trade any securities, cryptocurrencies, or stocks. Trading involves significant risk, and you should consult with a qualified financial advisor before making any investment decisions. Past performance is not indicative of future results.

KBBB - 45 Minutes Chart - Potential Bottom? Opinions? Disclosures:
No positions.
This analysis is for informational purposes only and is not financial advice. It does not constitute a recommendation to buy, sell, or trade any securities, cryptocurrencies, or stocks. Trading involves significant risk, and you should consult with a qualified financial advisor before making any investment decisions. Past performance is not indicative of future results.

KBBB - Over 97% drop means Bottom fishing? Any Opinions? Indicators & Volume
Volume Spike at Bottom: A large green volume bar formed during the last leg down, suggesting potential bottom-fishing or short covering.
BOS Labels ("Break of Structure"): Several BOS points during the decline confirm the bearish structure. No bullish BOS is visible yet — indicating trend has not reversed.
MACD/RSI-style Indicator (Below Chart):
Appears to show bullish momentum divergence: The price made lower lows, but the momentum is slightly rising.
Green dots on the indicator line signal a potential local bottom, but not yet strong confirmation of trend reversal.
-----------------------
Disclosures :
No positions.
This analysis is for informational purposes only and is not financial advice. It does not constitute a recommendation to buy, sell, or trade any securities, cryptocurrencies, or stocks. Trading involves significant risk, and you should consult with a qualified financial advisor before making any investment decisions. Past performance is not indicative of future results.
