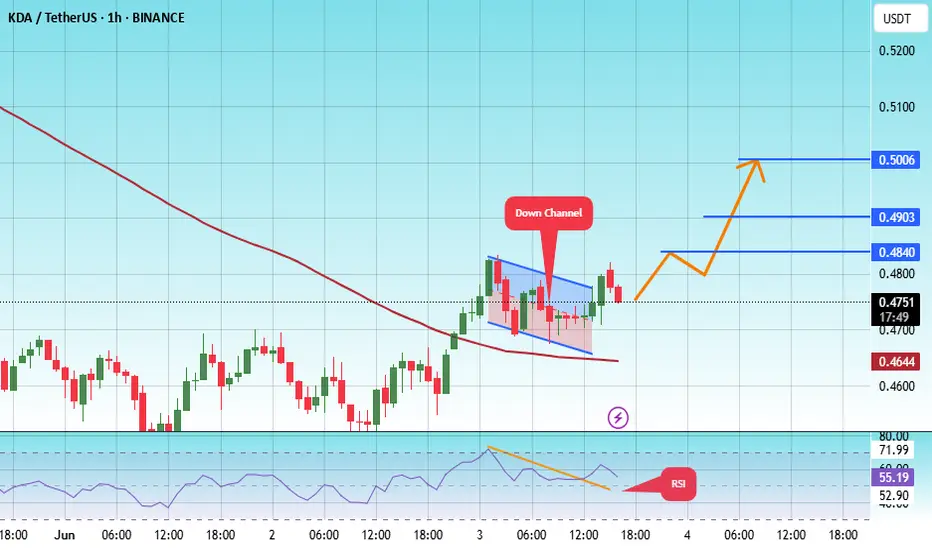
#KDA/USDT#KDA
The price is moving within a descending channel on the 1-hour frame, adhering well to it, and is heading toward a strong breakout and retest.
We are experiencing a rebound from the lower boundary of the descending channel. This support is at 0.4043.
We are experiencing a downtrend on the RSI

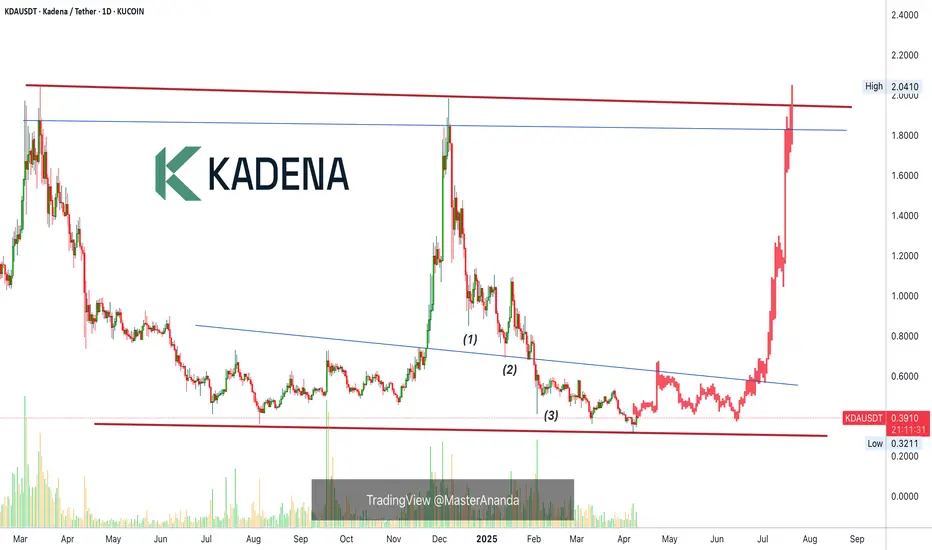
Kadena, Is 14,471% Truly Possible In 2025? Read The Chart!I love Kadena's previous bull-market. From July 2021 through November 2021, it was pure joy, straight up; huge profits of course.
It lasted 105 days... Total growth almost 9,000% and then the market went bearish, and then the market went sideways, for years... I think this time we will experience s

KDA (SPOT)BINANCE:KDAUSDT
#KDA/ USDT
Entry( 0.42- 0.47)
SL 1D close below 0.4131
T1 1.00
2 Extra Targets(optional) in chart, if you like to continue in the trade with making stoploss very high.
______________________________________________________________
Golden Advices.
********************
* collect

#KDA/USDT#KDA
The price is moving within a descending channel on the 1-hour frame, adhering well to it, and is heading toward a strong breakout and retest.
We are experiencing a rebound from the lower boundary of the descending channel. This support is at 0.4770.
We have a downtrend on the RSI indicator th
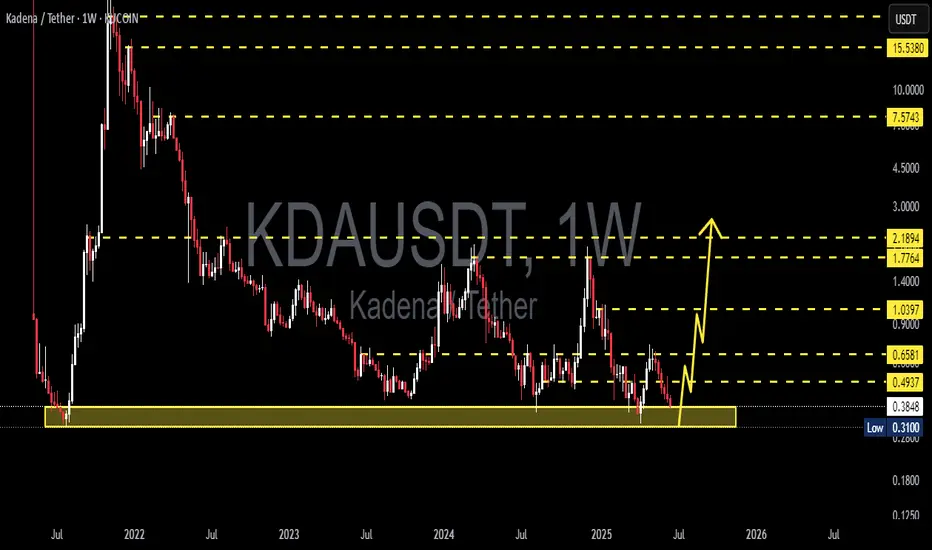
KDAUSDT 1W Analysis KDA ~ 1W Analysis
#KDA This is the lowest support for now. Buy if you still have confidence in this coin with a short term target of at least 15%+ from this support.
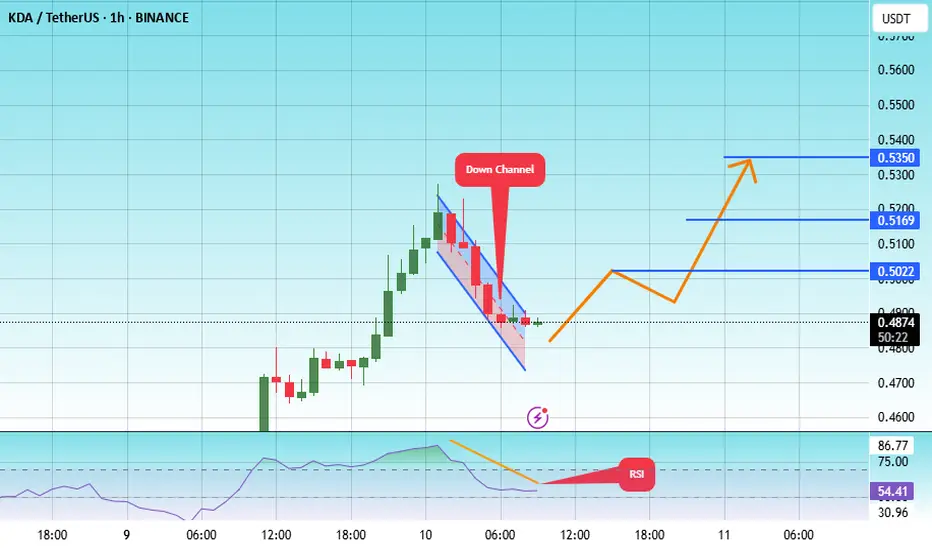
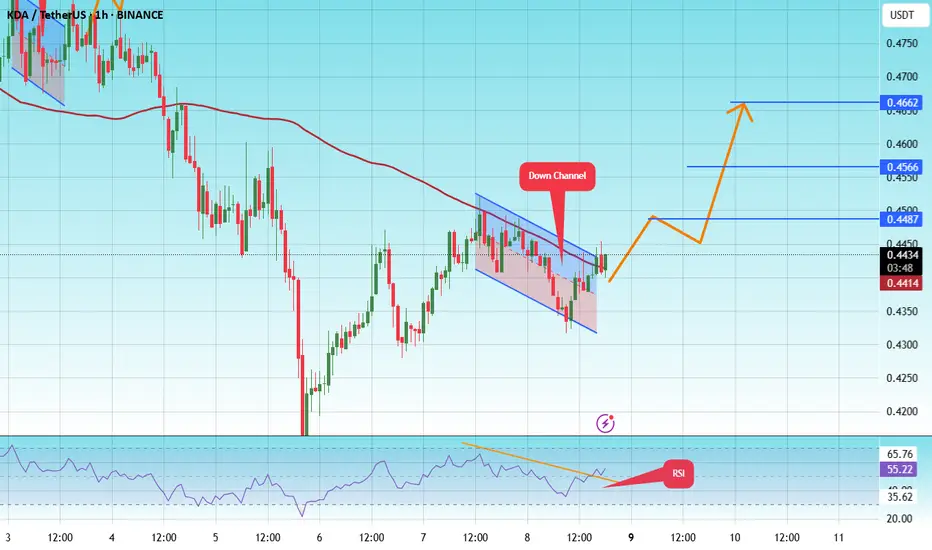
#KDA/USDT#KDA
The price is moving within a descending channel on the 1-hour frame, adhering well to it, and is heading for a strong breakout and retest.
We are seeing a rebound from the lower boundary of the descending channel, which is support at 0.5780.
We have a downtrend on the RSI indicator that is ab
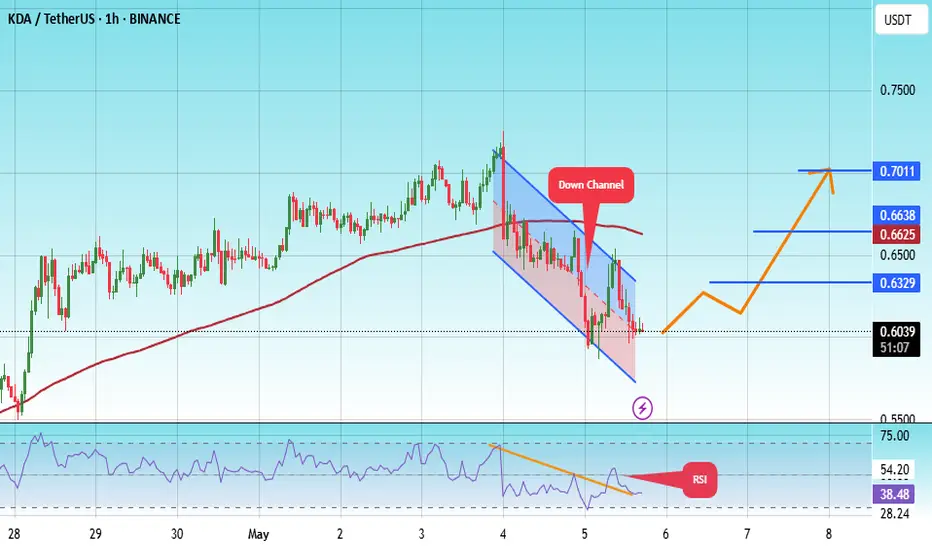
#KDA/USDT#KDA
The price is moving within a descending channel on the 1-hour frame, adhering well to it, and is heading for a strong breakout and retest.
We are experiencing a rebound from the lower boundary of the descending channel. This support is at 0.4670.
We are experiencing a downtrend on the RSI ind
#KDA/USDT#KDA
The price is moving within a descending channel on the 1-hour frame and is expected to break and continue upward.
We have a trend to stabilize above the 100 moving average once again.
We have a downtrend on the RSI indicator that supports the upward move with a breakout.
We have a support
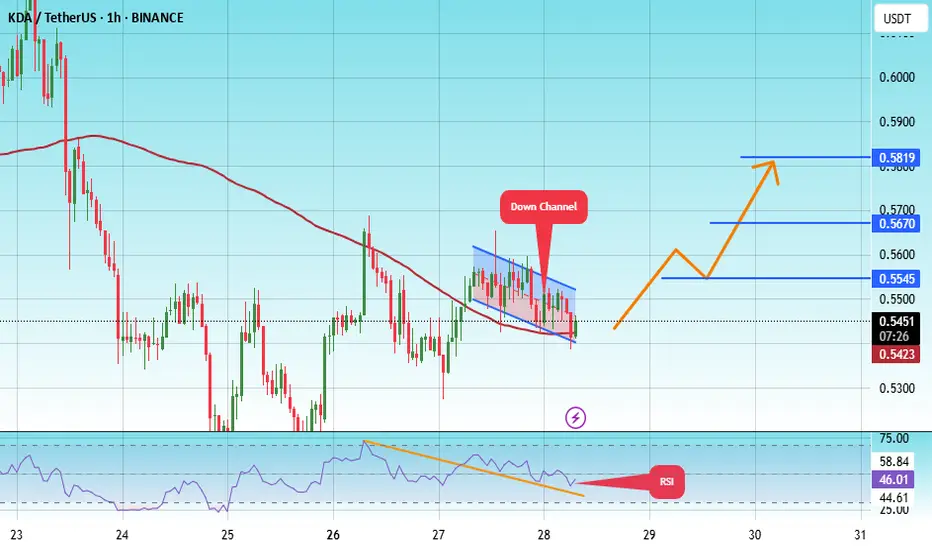
#KDA/USDT#KDA
The price is moving within a descending channel on the 1-hour frame, adhering well to it, and is on its way to breaking it strongly upwards and retesting it.
We are seeing a rebound from the lower boundary of the descending channel, which is support at 0.5380.
We have a downtrend on the RSI
Kadena: Your Altcoin ChoiceThis is a fractal. The same pattern that was present in 2024 is also developing in 2025.
A bullish wave that is corrected into a long-term accumulation zone. Then sideways and consolidation leads to a bullish breakout with a major high. Kadena can easily move back to $2 in the mid-term. 1-3 months.
See all ideas
Summarizing what the indicators are suggesting.
Oscillators
Neutral
SellBuy
Strong sellStrong buy
Strong sellSellNeutralBuyStrong buy
Oscillators
Neutral
SellBuy
Strong sellStrong buy
Strong sellSellNeutralBuyStrong buy
Summary
Neutral
SellBuy
Strong sellStrong buy
Strong sellSellNeutralBuyStrong buy
Summary
Neutral
SellBuy
Strong sellStrong buy
Strong sellSellNeutralBuyStrong buy
Summary
Neutral
SellBuy
Strong sellStrong buy
Strong sellSellNeutralBuyStrong buy
Moving Averages
Neutral
SellBuy
Strong sellStrong buy
Strong sellSellNeutralBuyStrong buy
Moving Averages
Neutral
SellBuy
Strong sellStrong buy
Strong sellSellNeutralBuyStrong buy
Displays a symbol's price movements over previous years to identify recurring trends.
Curated watchlists where KDAUSDT.P is featured.

Smart contracts: Make the smart decision
36 No. of Symbols
See all sparks