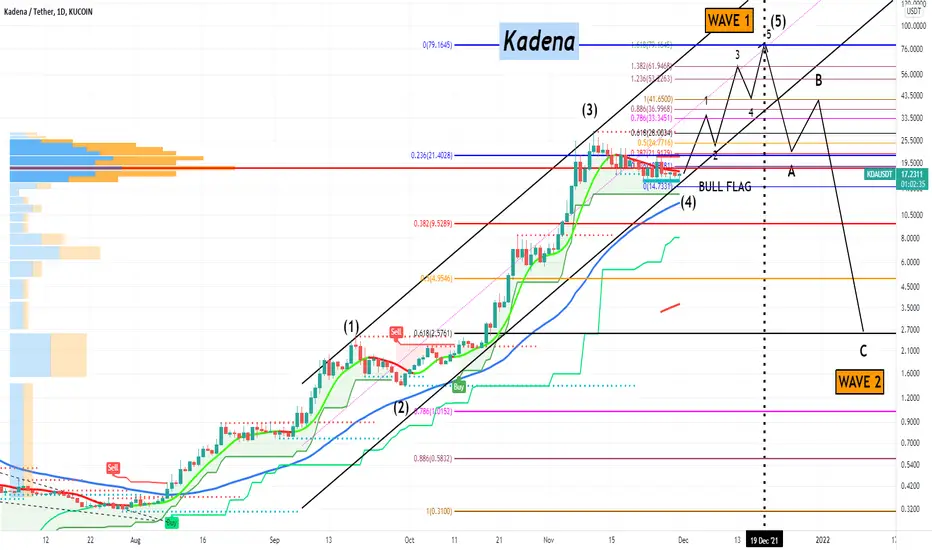
KadenaImpulse Rules:
An Impulse is a five Wave pattern labeled 1-2-3-4-5 moving in the direction of the larger trend. It is the most common Elliott Wave pattern.
Wave 1 must be an Impulse or a Leading Diagonal.
Wave 2 may be any corrective pattern except a Triangle.
No part of Wave 2 can more than retrace Wave 1.
Wave 2 must retrace Wave 1 by a minimum of 20%.
The maximum time for Wave 2 is nine times Wave 1.
Wave 3 must be an Impulse.
Wave 3 must be longer than Wave 2 in gross distance by price.
The gross price movement of Wave 2 must be greater than either Wave 2 of Wave 1 or Wave 4 of Wave 1. The gross price movement of Wave 2 must also be greater than either Wave 2 of Wave 3 or Wave 4 of Wave 3. Wave 2 must also be greater than 61.8% of the gross movement of each of the above 4 sub-Waves.
Wave 3 and Wave 1 cannot both have 5th Wave failures. (A Failure is an impulsive Wave where Wave 5 is shorter than Wave 4 by price.)
Wave 3 cannot be less than 1/3 of Wave 1 by price.
Wave 3 cannot be more than 7 times Wave 1 by price.
Although there is no minimum time constraint for Wave 3, its absolute maximum time limit is 7 times Wave 1.
Wave 4 can be any corrective pattern.
Waves 1, 2 and 4 cannot overlap except by 15% of Wave 2 with leveraged securities, and then only for a maximum of less than two days.
The gross price movement of Wave 4 must be greater than either the gross movement of Wave 2 of 3 or Wave 4 of 3. The gross price movement of Wave 4 must also be greater than either the gross movement of Wave 2 of 5 or Wave 4 of 5. The gross movement by price of Wave 4 must also be greater than 61.8% of the gross movement of each of these four subwaves.
The gross movement by price of Wave 4 must be greater than 1/3 of the gross movement of Wave 2 by both price and percentage movement.
The gross movement by price for Wave 4 must be less than three times the gross movement of Wave 2 by both price and percentage movement.
Wave 3 and Wave 4 cannot both be failures. (A Failure is an impulsive Wave where Wave 5 is shorter than Wave 4 by price.)
Although Wave 4 has no minimum time constraint, the maximum time for Wave 4 is twice the time taken by Wave 3.
Wave 5 must be an Impulse or an Ending Diagonal. However, if Wave 5 is longer than Wave 3 by price, then Wave 5 must be an Impulse.
Wave 5 must move by price more than 70% of Wave 4. (This is not gross movement. Only consider the end points of both Waves.)
Wave 3 must never be shorter than both Wave 1 and 5, by either price distance or percentage price movement.
If Wave 5 is truncated, or contains an Impulse that is truncated, then neither Wave 3 nor Wave 4 can contain a subwave that is truncated. (A truncated pattern is where Wave 5 is shorter than Wave 4. This is also known as a failure.)
The maximum movement of Wave 5 is six times Wave 3 in both price and time.
Wave 5 has no minimum time constraint.
KDAUSDT.P trade ideas
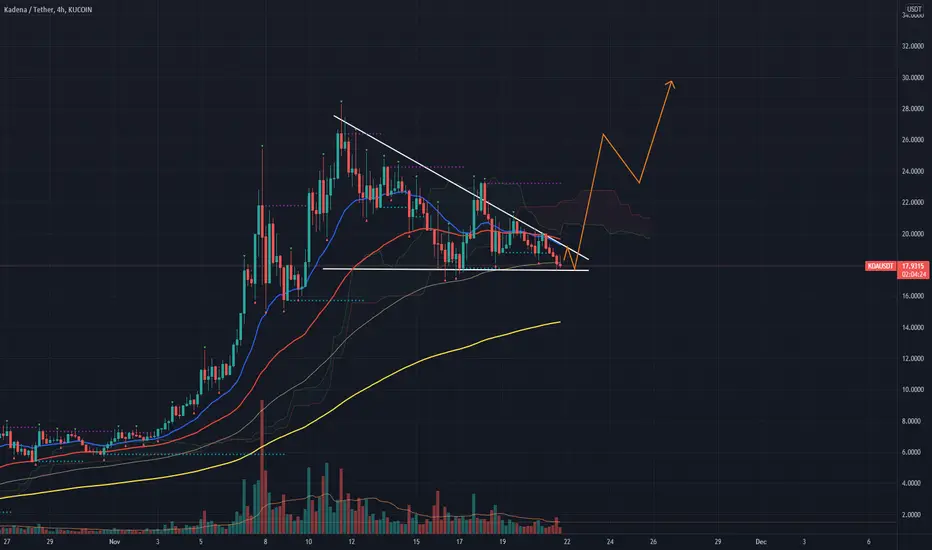
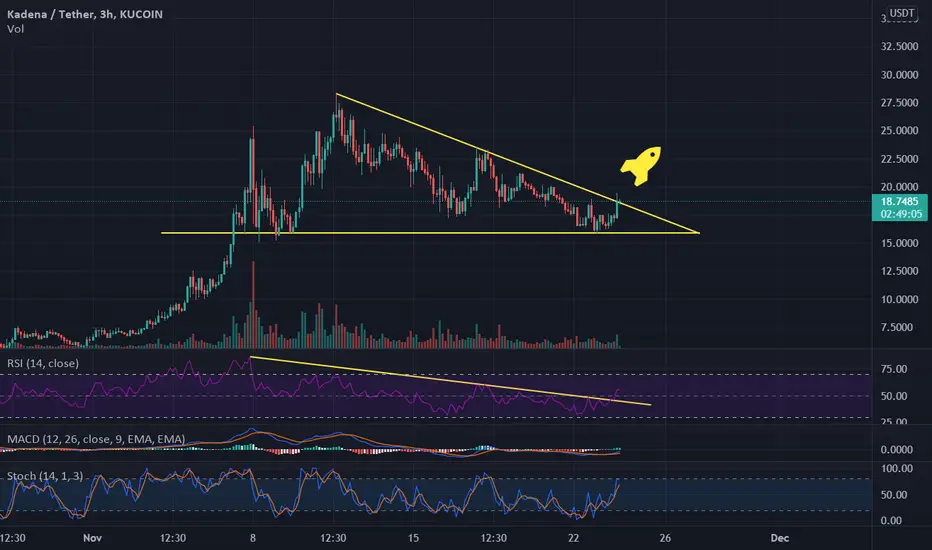
KDA (Kadena) : An overviewKadena has been consolidating into a bullish triangle for the past 1 Month. If Triangle broken upwards, Expecting a +200% Bullish wave towards the 48 USDT range.
On the worst case, If we lost the support, We may retest the 12 USDT Support area.
I'm overall bullish on Kadena due to The good fundamentals behind it and i'm having no idea to sell it at such low prices.
I'm Sure December will be bullish for Kadena.

Possible scenario for KDA It seems to appear a bullish pennant is in play. Closely watching for higher/lower low and a break out to ither side.

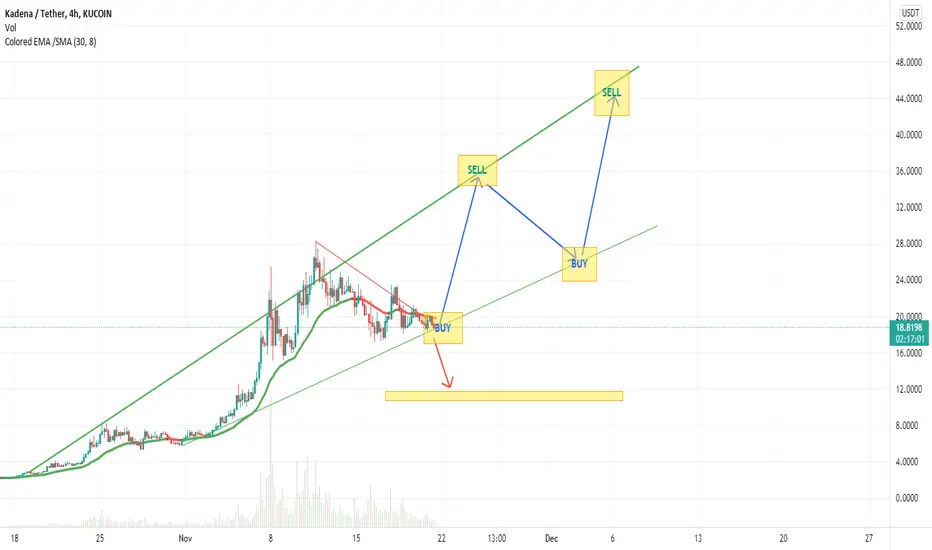
KDAUSDTKDAUSDT is currently at a good support zone possible uptrend from here.
Entry: Blue zone
TP and SL is as shown on the chart


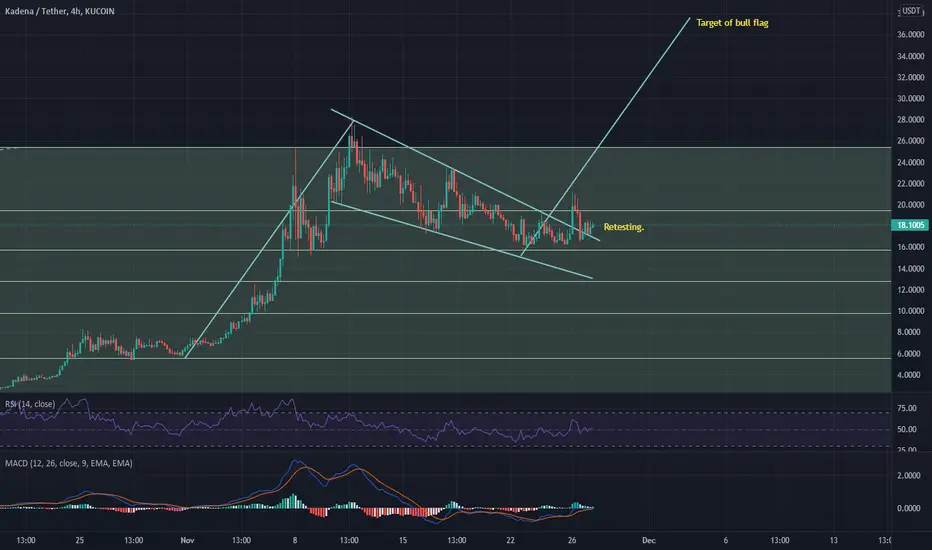
Kadena retesting the upper trend lineIf successfully tested, we'll hopefully bounce to the mentioned target. $KDA
KADENA - Possible EntryHello there,
We will enter in this trade as well with SL and TP in the chart.
*** This is not a financial advice, I'm still a beginner trying to share my Road here.
Thank you.

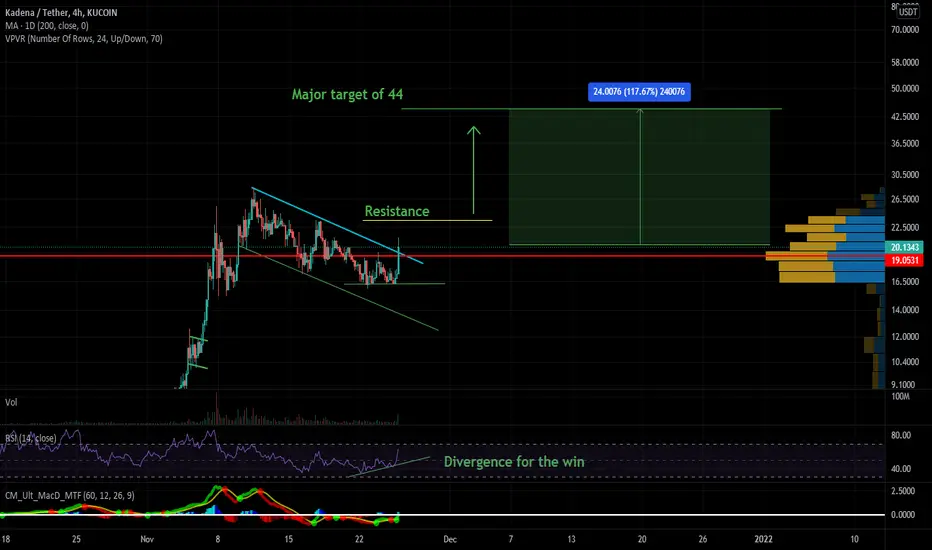
KDAUSDT Breakout and UpdateSo, if you jumped on this when I first mentioned it, you made quite a large return. After a nice long consolidation period, its on the move yet again to my major target. Now, there will be some resistance along the way so if you are swing trading this, you will likely be taking profit at those areas and re-entering etc. Anyways, it looks good from here and I expect the asset to move past my major target throughout this leg of the bull cycle. Thanks again everyone!
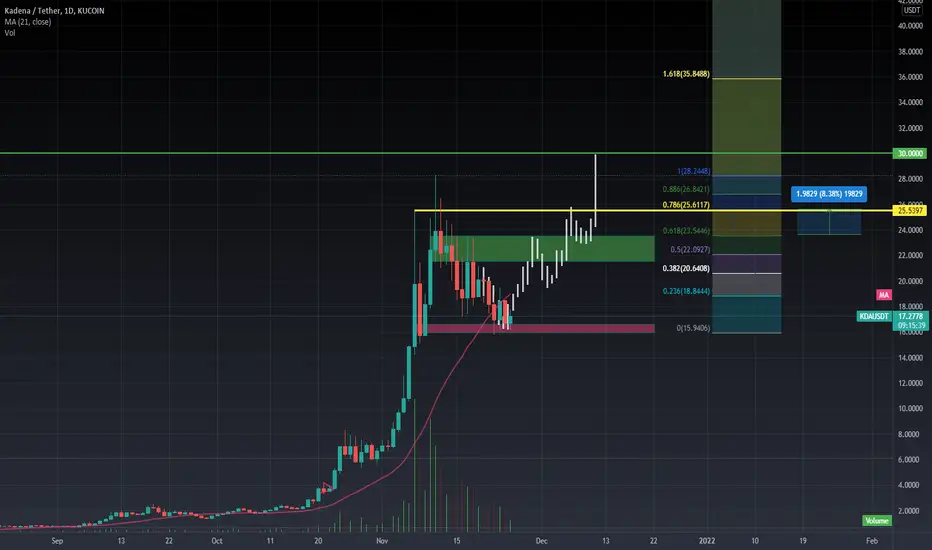
$KDA to $30 ?I would not be acctually suprised if we go well wrapped KDA already trading, kaddex gonna launch soon aswell.., lets see if we can even break the green area, then I will look for golden pocket, which is aprx. 10% above.
KDA looks like it has found some decent supportKDA looks like it has found some decent support
It has tons of bullish news coming in the coming weeks

KDA looking breakout ready- Descending triangle
- Consistent volume
- MACD cannot have the leading cross down over the lagging line.
- Wait for a breakout of the pattern, retest of the triangle and then ride the move.
What are your thoughts on this?
KDA / Kadena is BULLISH - Smart Contract KINGAs you can see based on the intersection of the decending triangle, we should see an ascending breakout on November 28th at the final entry chance ~$15.7. Once the price hits $23.5, which is the .618 confirmation, it should spiike up massively. The prices to the right represent different fib retracement levels.
Moving averages also show that the 7 and 20 MA will trend up past the 50, 100, 200, and 300 MA on november 28th.

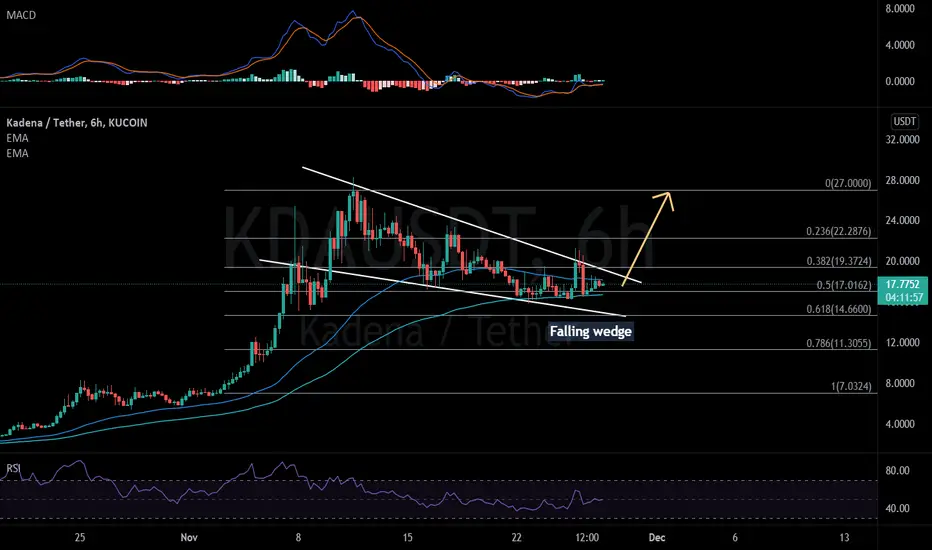
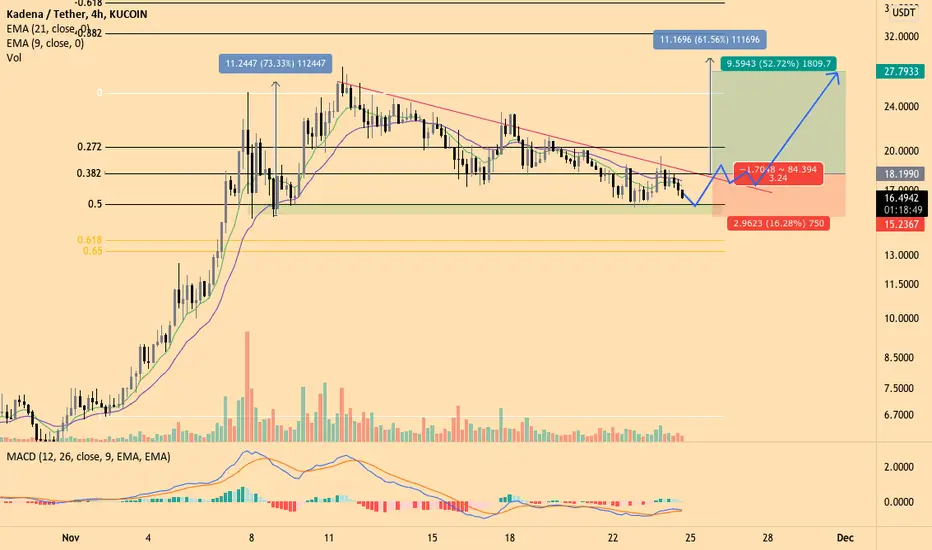
KDA is ready for another leg up . Bullish falling wedge in play KDA is ready for any other leg up after a great run up to 28$ !
on the breaking of falling wedge it can pump more than 50% !
Ps:- The is not a financial advice ! this is my observation on charts !

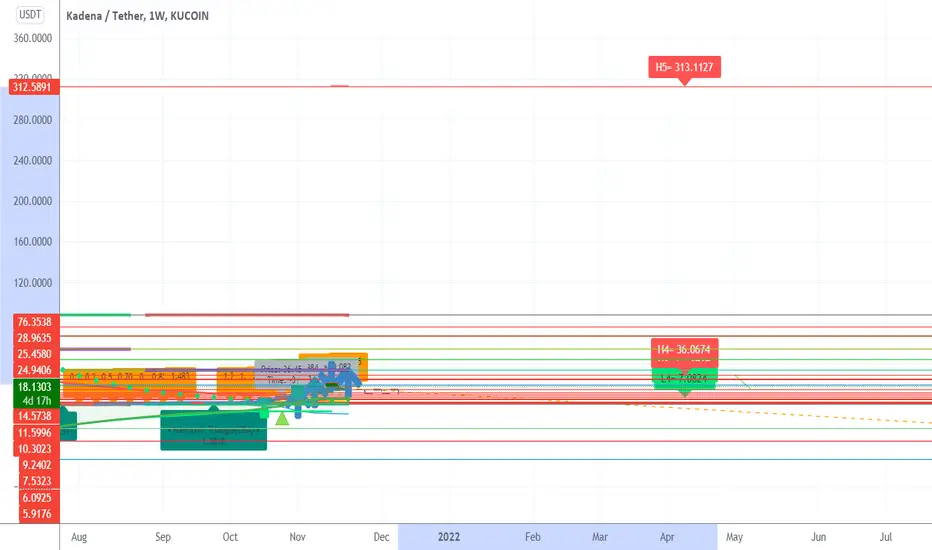
NEW WEEKLY UPDATE $KDA 313$ New TargetNEW WEEKLY UPDATE $KADENA $KDA
Just to prove this target, it should be said that if Kadena reaches the Cap Solana market, it will reach a much higher price than this figure, so soon we will see this figure. It is the time of the weekly candle.
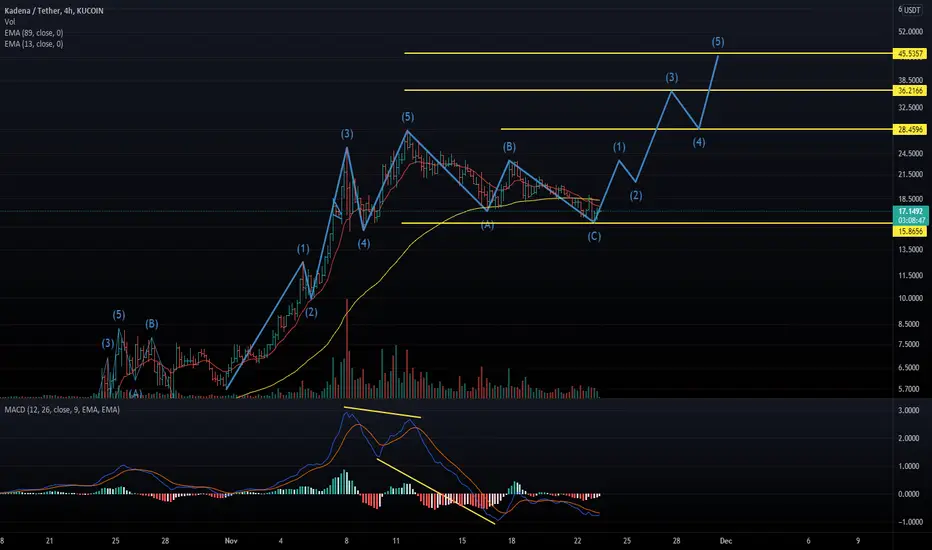
NEXT TARGET: 28$
TARGET 2 : 36$
TARGET 3 : 313$
Break the downward trend in pricesWith the failure of the downtrend and the RSI The probability of price growth is high

$KDA next upside target after bottom ABC Corective Waves is $36$KDA next upside target after bottom ABC Corective Waves is $36, tomorow $WKDA will released on $ETH then KADDEX with $KDX will follow behind
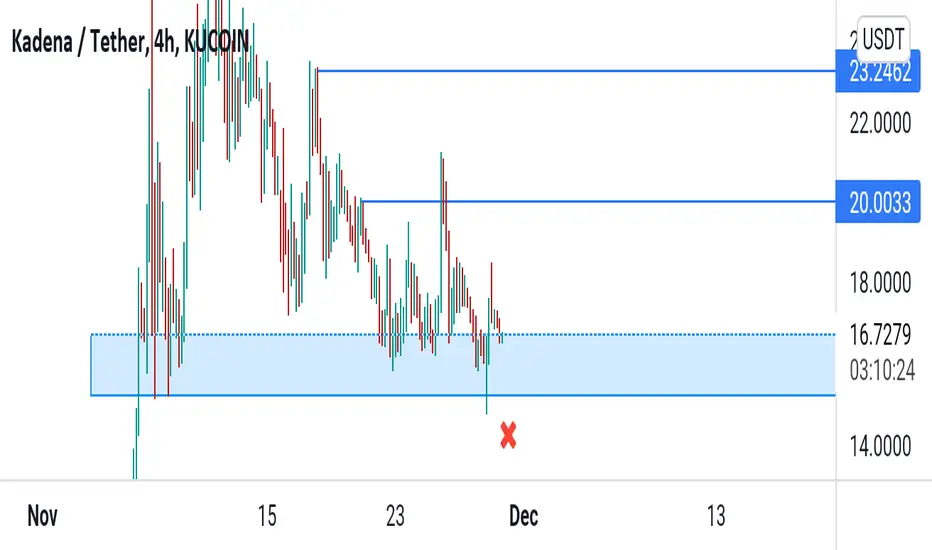
KADENA/USDT shortI see this situation with KADENA this way:
-support broken
-4h LL forming
-4h-below 50 SMMA
-1h-below 50 SMMA
-RR-1:3
-MPO-target
Maybe we will not reach Target 2., but see real walue at target 1. min.

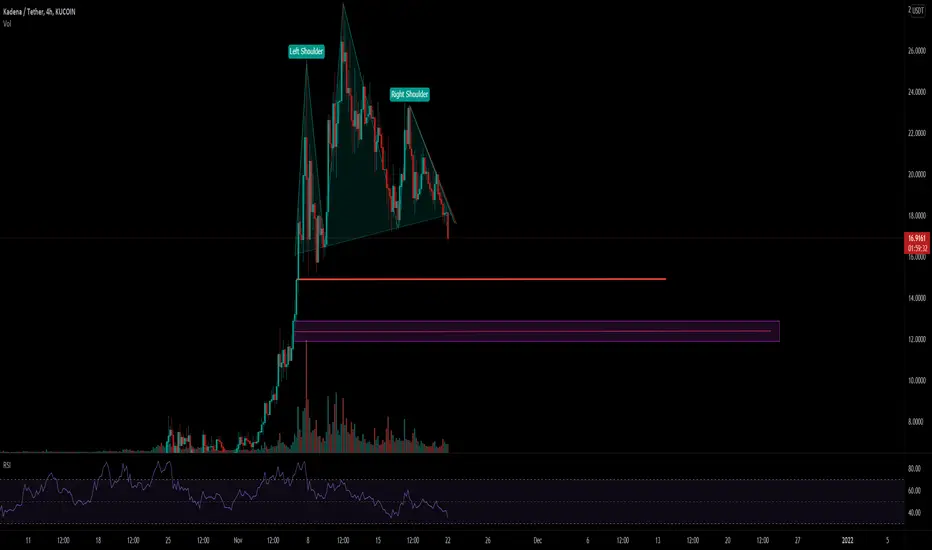
KDA head and shouldersKDA has formed a head and shoulders pattern my targets are $15 and $12
I'm still very bullish on this project long term