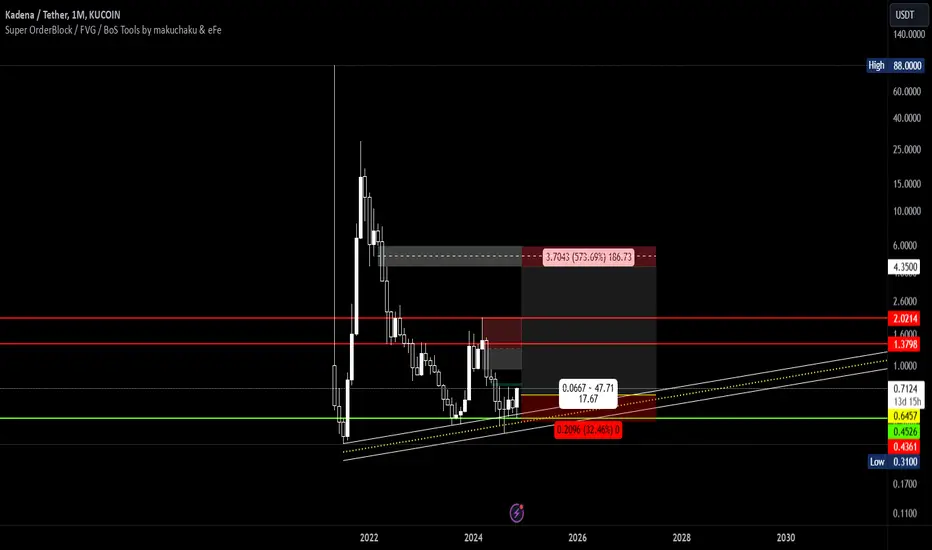
#KDA lot of same looking structure on few alts, either will be good double botto or reject at local resistance
KDAUSDT.P trade ideas
The Trader’s Hero’s Journey: Becoming Your Own Trading LegendThe life of a trader often feels like a rollercoaster—full of challenges, triumphs, and personal growth.
As I read The Hero’s Journey by Joseph Campbell, it struck me that trading follows a similar arc to the mythical journey of a hero. It’s a path of discovery, trials, and transformation, where the ultimate prize isn’t just financial success but self-mastery."
Joseph Campbell’s The Hero’s Journey outlines a universal story arc where a hero ventures into the unknown, faces trials, and emerges transformed. When I reflect on my journey as a trader—and the journeys of many others I’ve met—I see clear parallels.
Trading is not just about profits or losses; it’s about the personal evolution that comes with navigating the markets. Let’s break it down.
1. The Call to Adventure
Every trader begins with a moment of inspiration: perhaps it’s seeing others succeed, hearing about financial freedom, or wanting to take control of their destiny. This is the call to adventure, where you step into the unknown world of trading.
Trading Insight: This initial excitement often leads to a steep learning curve. You dive into books, courses, and strategies, ready to conquer the markets. But as Campbell reminds us, the journey isn’t as simple as answering the call—it’s only the beginning.
2. Crossing the Threshold
The moment you place your first trade, you cross the threshold into the real world of trading. Here, the safety of learning gives way to the reality of risk, uncertainty, and the emotional rollercoaster that trading brings.
Trading Insight: This step is thrilling but also daunting. Many traders experience beginner’s luck, only to be hit by the harsh realities of losses and market unpredictability. It’s the first step into the unknown, where the real journey begins.
3. The Trials and Challenges
In The Hero’s Journey, the hero faces trials, tests, and challenges that push them to their limits. For traders, these trials come in the form of losses, emotional turmoil, and the constant temptation to deviate from their plans.
Trading Insight: Every trader faces these moments—revenge trading after a loss, abandoning a strategy, or letting fear and greed take over. These are the tests that separate those who persevere from those who give up. Each challenge is an opportunity to grow, learn, and refine your skills.
4. The Mentor
In every hero’s journey, a mentor appears to guide the hero through their trials. For traders, mentors can take many forms: books, courses, communities, or even market experiences themselves.
Trading Insight: A good mentor—or even the wisdom of past experiences—provides clarity during tough times. They help you stay disciplined, manage risk, and stick to your trading plan. Many traders find mentorship in unlikely places, like mistakes that teach them lessons they’ll never forget.
5. The Abyss (Dark Night of the Soul)
Every hero reaches a point of despair, where they’re tested to their breaking point. For traders, this might look like a string of losses, a blown account, or doubting whether they’re cut out for the markets at all.
Trading Insight: This is the hardest part of the journey. Many traders quit here, feeling overwhelmed and defeated. But those who persist, reflect, and adapt often emerge stronger and wiser. The abyss is not the end—it’s the turning point.
6. The Transformation
After surviving the abyss, the hero is transformed. For traders, this is the point where you develop emotional resilience, refine your strategies, and truly understand the importance of discipline and risk management.
Trading Insight: You begin to trust your process, stick to your plan, and let go of the need to control the market. This transformation doesn’t happen overnight, but when it does, you become a confident, consistent trader.
7. The Return with the Elixir
In the final stage of The Hero’s Journey, the hero returns to their world with the “elixir,” the wisdom and rewards gained from their trials. For traders, this could be consistent profitability, but more importantly, it’s the lessons learned and the personal growth achieved.
Trading Insight: You return not just as a trader but as someone who understands themselves better. The elixir isn’t just financial—it’s the knowledge that success comes from within, from mastering your emotions and staying disciplined.
Conclusion:
Trading is more than just buying and selling—it’s a hero’s journey. It’s a path of self-discovery, resilience, and transformation. As Campbell reminds us, the greatest reward isn’t the treasure at the end but the person you become along the way.
Whether you’re just starting out or have been trading for years, remember: every challenge you face is part of your journey. Embrace it. Learn from it. And like every hero, you’ll emerge stronger, wiser, and ready to conquer the markets—and yourself.
How is your journey going ?

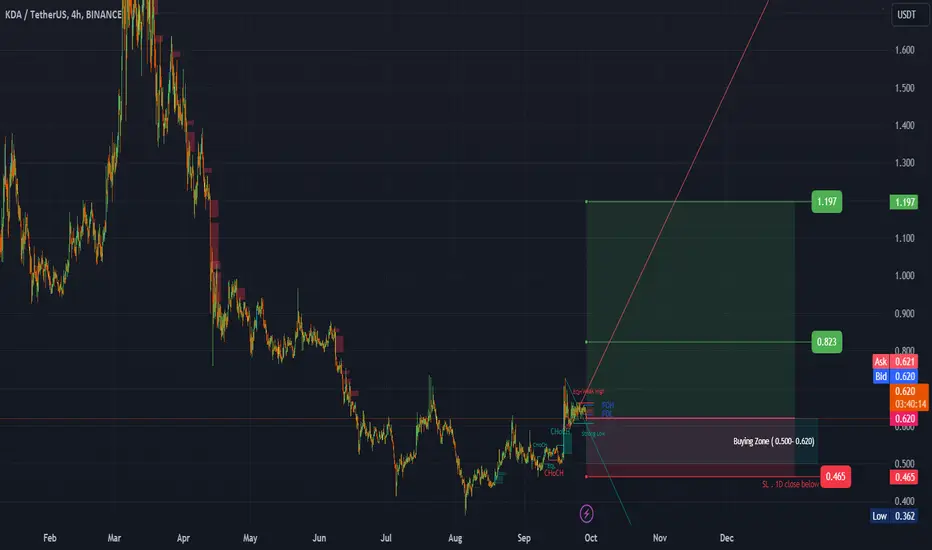
#KDA (SPOT) entry range( 0.500- 0.620) T.(1.197) SL(0.465)BINANCE:KDAUSDT
entry range( 0.500- 0.620)
Target1 (0.823) - Target2 (1.197)
SL .1D close below (0.465)
*** collect the coin slowly in the entry range ***
*** No FOMO - No Rush , it is a long journey ***
**** #Manta ,#OMNI, #DYM, #AI, #IO, #XAI , #ACE #NFP #RAD #WLD #ORDI #BLUR #SUI #Voxel #AEVO #VITE #APE #RDNT #FLUX #NMR #VANRY #TRB #HBAR #DGB #XEC #ERN #ALT #IO #ACA #HIVE #ASTR #ARDR #PIXEL #LTO #AERGO #SCRT #ATA #HOOK #FLOW #KSM #HFT #MINA #DATA #SC #JOE #RDNT #IQ #CFX #BICO #CTSI #KMD #FXS #DEGO #FORTH # AST #PORTAL #CYBER #CLV #RIF
ENJ #ZIL #KDA ****
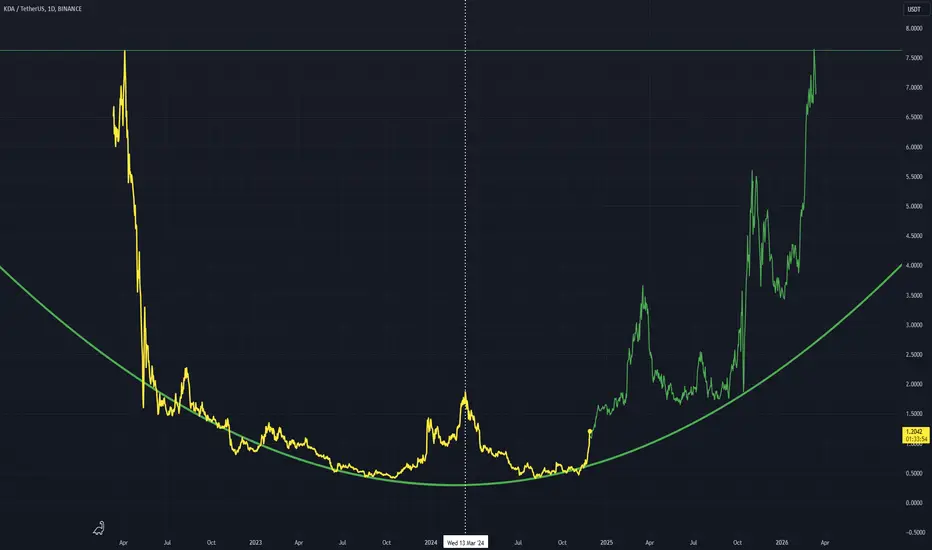
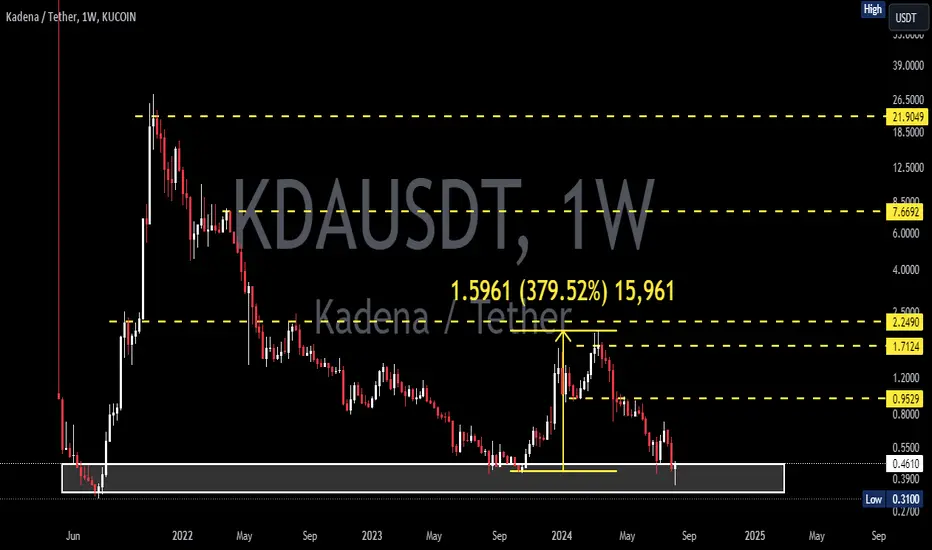
KDAUSDT - Bull Bowl StructureThe bear market movement allows the placement of this curved bowl structure which includes a bullish side
I expect price to go back up to about $7 or even higher during this bull run (alt run)
The vertical dotted line is the middle of the pattern and the point where the bulls took control.
Daily chart
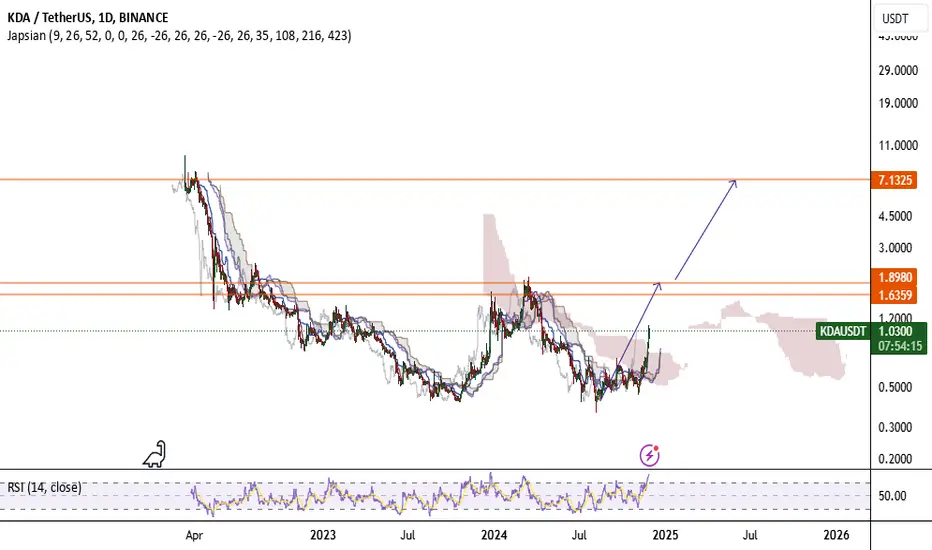
KDA/USDTIt looks like it will experience a nice uptrend in the medium term and rise to the resistance levels shown in the picture.
#KDA: Unlocking Scalable Blockchain SolutionsDescription:
This trading idea highlights KDA (Kadena), a blockchain platform designed to deliver high scalability, security, and energy efficiency for enterprise and decentralized applications. With its unique braided chain architecture, Kadena achieves unmatched transaction throughput without compromising decentralization. KDA serves as the network's native token, powering transactions, smart contracts, and incentivizing miners. Kadena's partnerships and focus on providing real-world solutions for businesses position it as a strong contender in the evolving blockchain landscape.
As blockchain technology continues to grow in adoption, KDA stands out with its innovative approach to scalability and usability. However, the cryptocurrency market is highly volatile and influenced by factors such as regulatory changes, technological advancements, and broader economic conditions. Investors should carefully weigh the risks and opportunities associated with KDA.
Disclaimer:
This trading idea is provided for educational purposes only and does not constitute financial advice. Cryptocurrencies like KDA are speculative investments with significant risk, including the potential loss of your entire investment. Always conduct your own research, evaluate your financial situation, and seek guidance from a professional advisor before making investment decisions. Past performance is not indicative of future results.
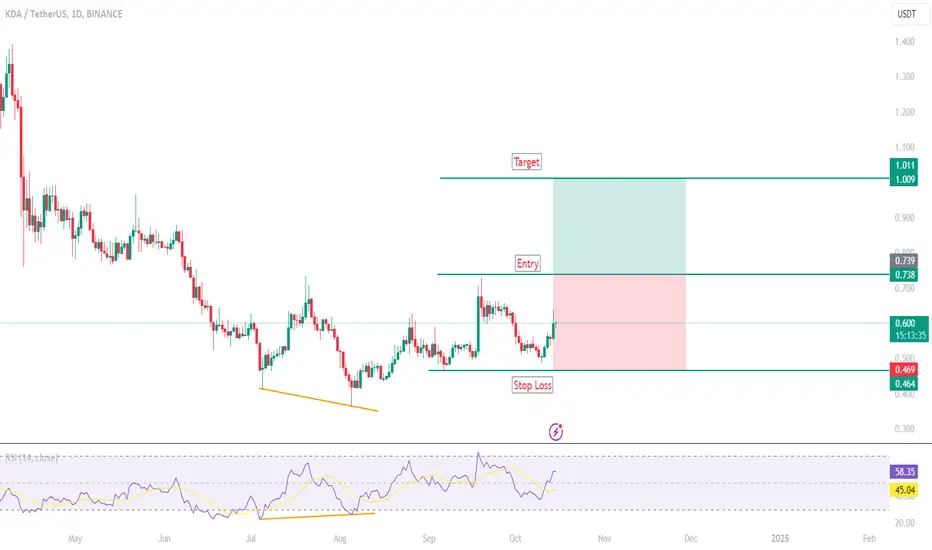
Kadena ( kda )Kda usdt Daily analysis
Time frame daily
Risk rewards ratio >2
Short position
Target Grey support line
$kda #PotentialAnalysis Could GETTEX:KDA make 3 to 4 times its current value and reach $3?
With strong #fundamentals & #technicalAnalysis, it's not out of the realm of possibility.
#CryptoMarket #Kadena #KdaPricePrediction
After taking the Sell Side Liquidity (SSL), Kadena now goes for Buy Side Liquidity (BSL). #Kadena #KDA #Liquidity #CryptoTrading

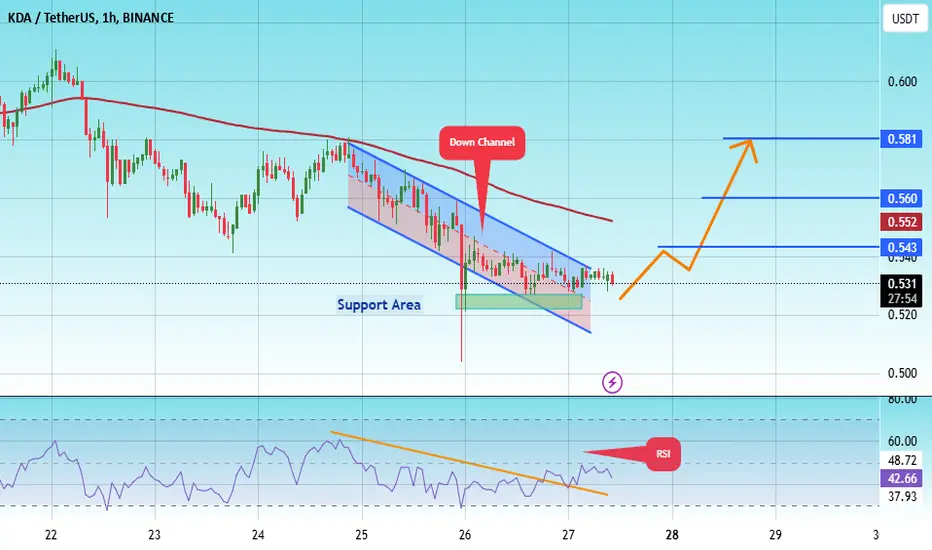
#KDA/USDT#KDA
The price is moving in a descending channel on the 1-hour frame upwards and is expected to continue.
We have a trend to stabilize above the moving average 100 again.
We have a downtrend on the RSI indicator that supports the rise by breaking it upwards.
We have a support area at the lower limit of the channel at a price of
0.5700.
Entry price 0.6096.
First target 0.6113.
Second target 0.6488.
Third target 0.6710.

#KDA/USDT#KDA
The price is moving in a descending channel on the 4-hour frame and is sticking to it well
We have a bounce from the lower limit of the descending channel and we are now touching this support at a price of 0.520
We have a downtrend on the RSI indicator that is about to be broken, which supports the rise
We have a trend to stabilize above the moving average 100
Entry price 0.530
First target 0.543
Second target 0.560
Third target 0.581
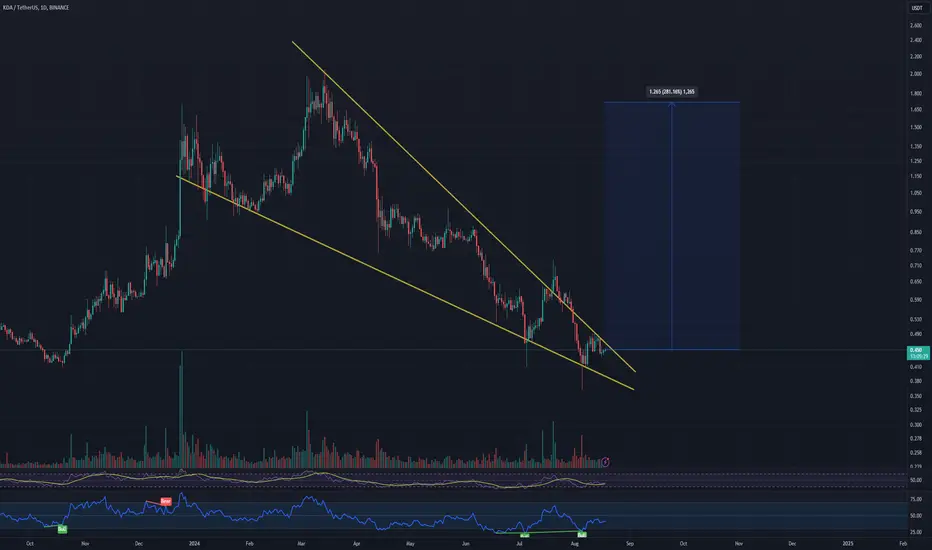
#KDA Poised for a 281% Upswing! GETTEX:KDA #KDAUSDT is setting up for a potential breakout from a long-term falling wedge pattern. Currently trading at $0.450, the technicals suggest a remarkable 281.16% gain, with a target price of $1.265. This could be the perfect moment to enter before the rocket takes off!
⚠️ All trading ideas are published with a time delay. If you want to follow the trading in real-time, please follow the link:
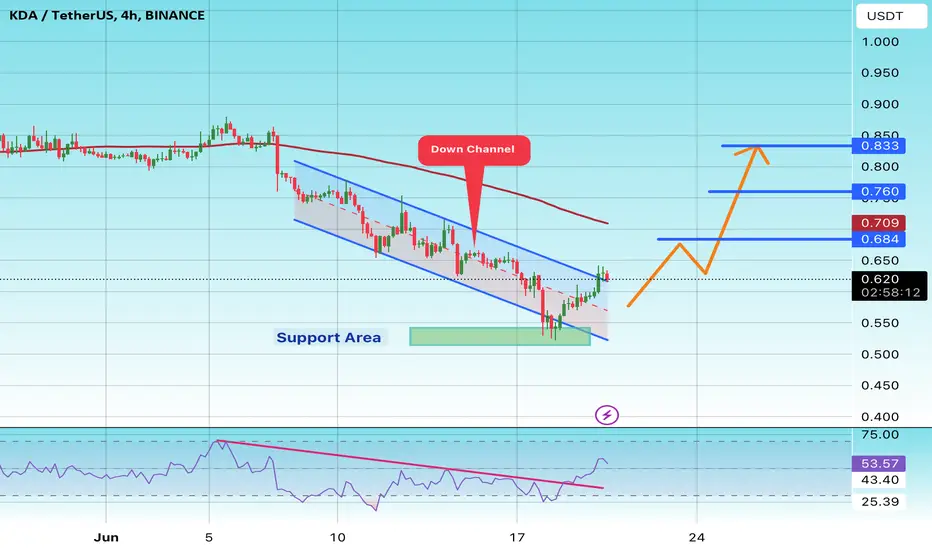
#KDA/USDT#KDA
We have a descending channel pattern on the 4-hour frame, the price is moving inside it and adhering to its borders well
We have a support area in green at a price of 0.500 after the price touched it and rebounded from it
We have a trend to stabilize above the moving average 100
We have a downtrend on the RSI indicator that supports the price upwards
Entry price 0.580
First target 0.684
Second target 0.76
Third target 0.833
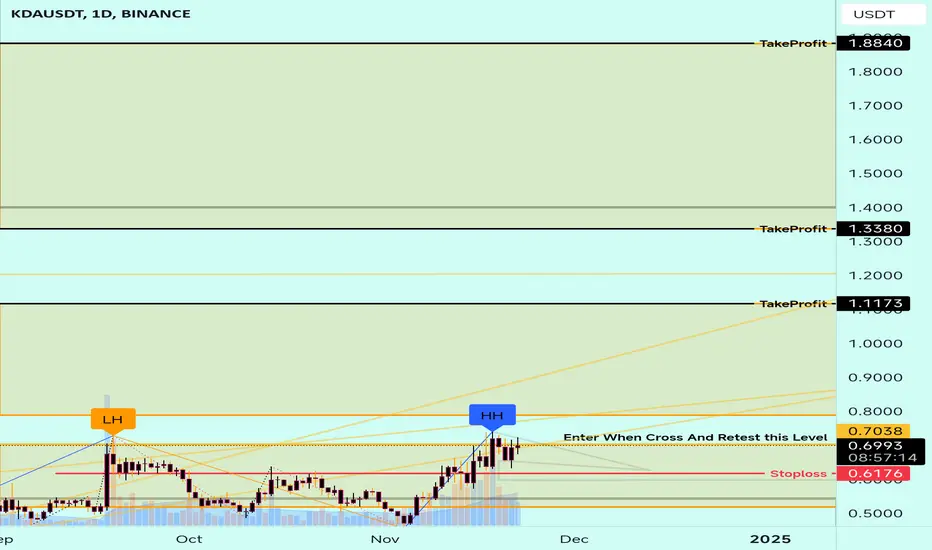
KDAUSDT Bullish TrendKDAUSDT is showing bullish trend, we can enter into the trade after the break of last HH, keeping stop loss at last LL.
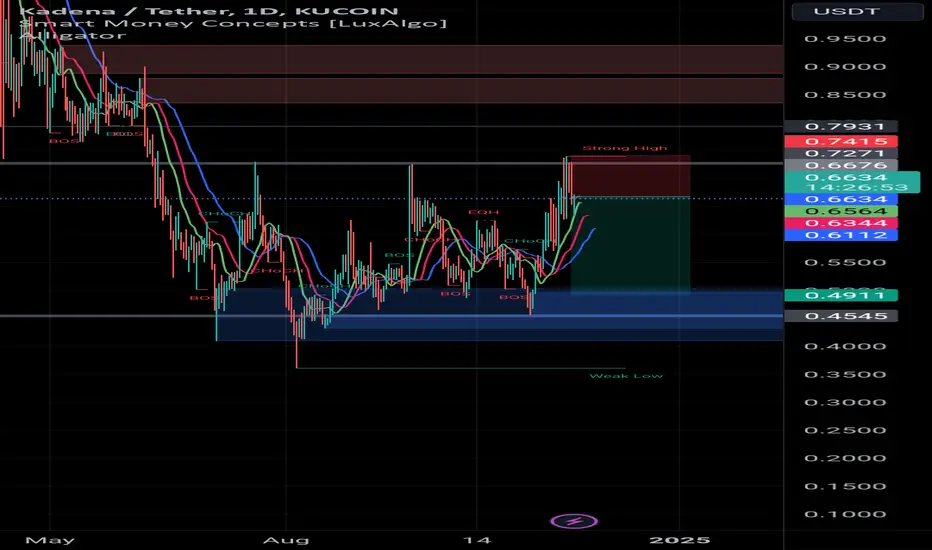
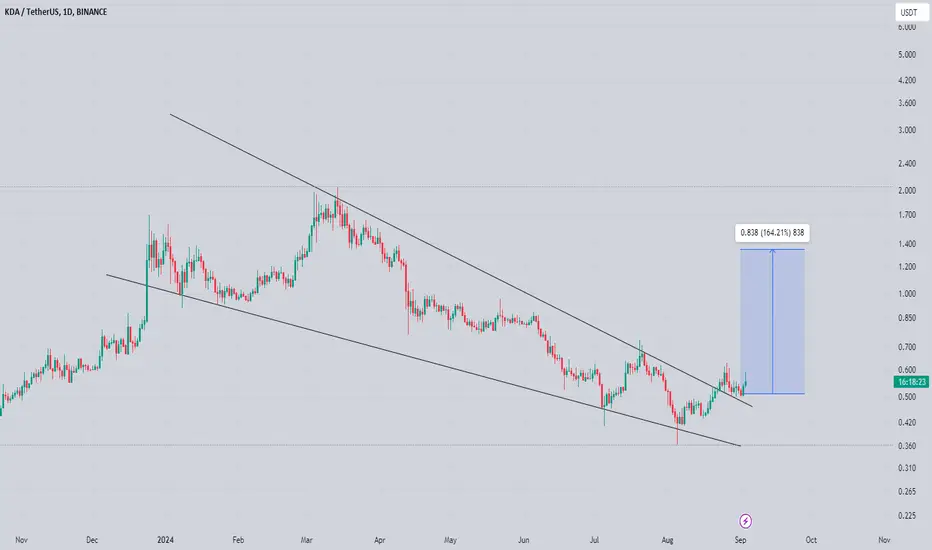
KDAUSDT Ready For a Bullish Breakout from the Falling WedgeYello, Paradisers! Are you ready for what could be a pivotal moment for #Kadena? Let's look at the latest analysis of #KDA:
💎We've been tracking #KDAUSDT closely, and the signs are pointing to an exciting continuation from the Bullish OB at $0.436. The falling wedge pattern we've observed is finally about to see a breakout above the descending resistance.
💎Now, all eyes are on the next target—the key resistance at $0.62. If #KDA holds its ground here, we could be in for a significant bullish rally, mirroring previous upward trends.
💎But here's the catch: if momentum fails to sustain at this level, we might see #KDAUSDT drop, with a possible bullish rebound from the lower demand area around $0.36-$0.39. This is a critical juncture, Paradisers. Staying vigilant is essential.
💎Keep a close watch on price movements of GETTEX:KDA , especially around the demand area. A daily closure below this zone could invalidate the bullish outlook and open the door to further declines.
Stay updated, focused, patient, and disciplined, Paradisers.
MyCryptoParadise
iFeel the success🌴

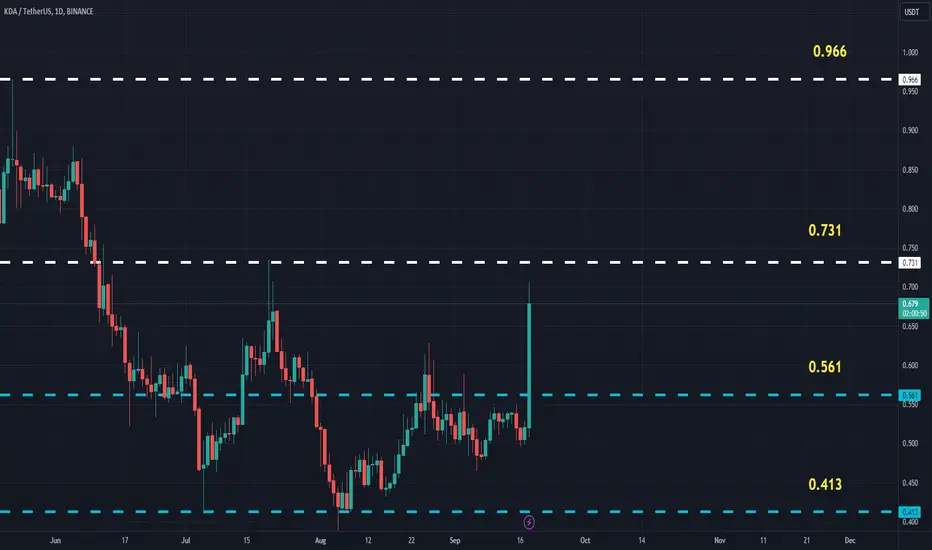
KDAUSDT(Kadena) Updated till 18-09-24KDAUSDT(Kadena) Daily timeframe range. finally it moved out of its trouble zone. very close to 0.731 if volume stays it got chance to push through. local retrace point is at 0.561 which needs to hold if it fails than back to trouble zone.
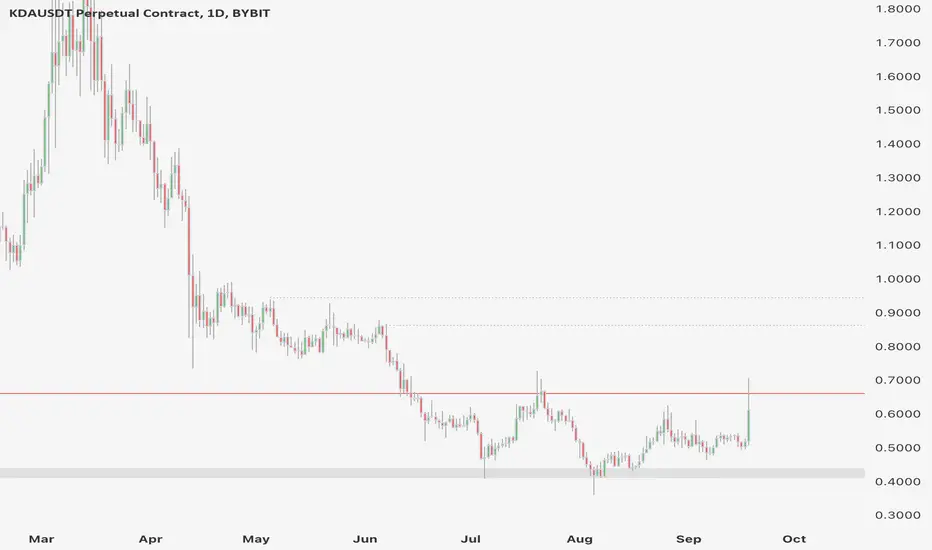
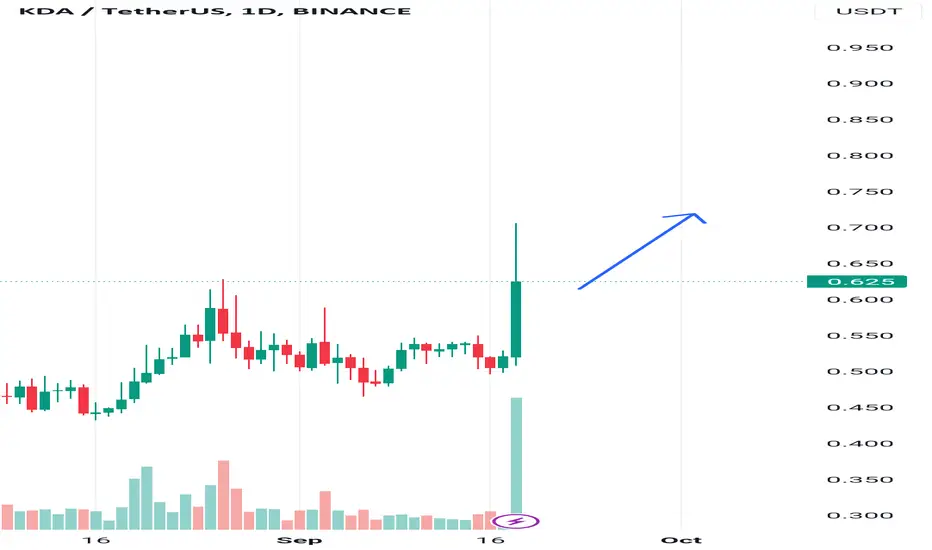
Kadena (KDA) — Reversal in the Making?Kadena (KDA) has captured significant attention today. The token is one of the top gainers, with a peak of over 30% in intraday trading (it is currently still up +18%).
The surge has been driven primarily by Binance’s announcement of launching USD-margined perpetual contracts for KDA.
The big question is: Does this pump signal a long-term reversal, or is it a temporary reaction to news?
Let’s break it down in this post.
1️⃣ Key Technical Points
• Bottom Formation at $0.40: After months of downward pressure, KDA found a solid bottom at ~$ $0.40. The token has shown resilience and bounced consistently off this level.
• Resistance at $0.66: The first significant test for KDA is closing above the $0.66 resistance level. The token must break and hold this area to confirm a more sustained uptrend.
• Next Targets: $0.86 and $0.95: If KDA breaks $0.66, the next logical resistance levels to watch are $0.86 and $0.95. These levels will serve as significant barriers, but clearing them would allow KDA to move even higher, possibly toward the $1 mark.
2️⃣ What’s Next
• Confirming the Reversal: While today’s pump is encouraging, waiting for confirmation is essential. For the token to establish a solid bullish trajectory, a close above $0.66 is necessary. Without this, the pullback risk remains, especially considering the pump may be news-driven.
• Potential Pullback: If the $0.66 resistance holds and KDA is rejected, we could see a retracement to the $0.50-$0.52 area, which has previously served as minor support. If market sentiment shifts, a deeper pullback to $0.41 could also be possible.
3️⃣ Volume Insights
The volume has steadily increased, reflecting growing interest and confidence in the token’s price action. While this supports the bullish case, we need more volume to confirm the breakout above $0.66.
Kadena’s recent surge is promising but hinges on its ability to close above the $0.66 resistance level. If KDA can break above this level, a move to $0.86 and $0.95 becomes likely.
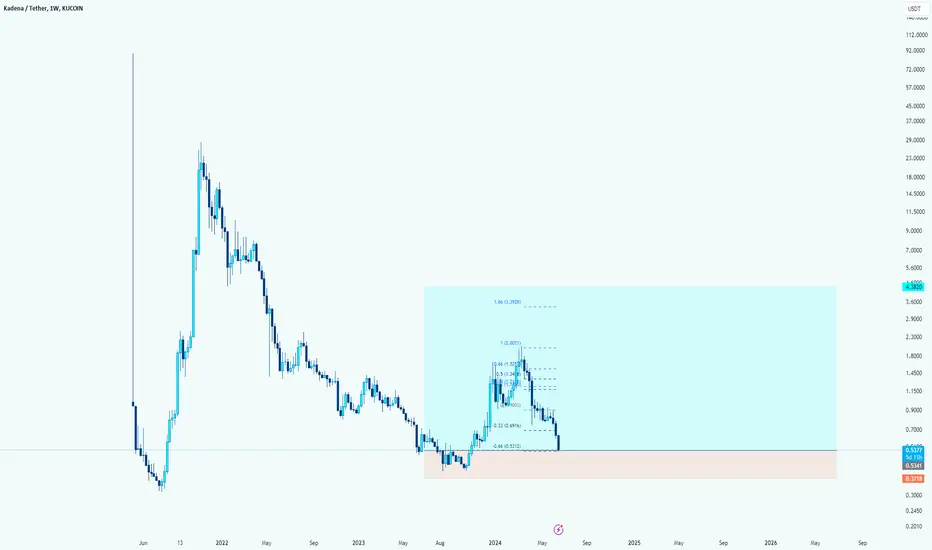
Kadena | TA Made Simple: Ying YangHello successful trader, let's make technical analysis simple.
The market cycles mainly between two phases, a bearish phase and a bullish wave.
These are the two polarities: up and down.
➖ A bullish wave is followed by a bearish wave.
➖ A bearish wave is followed by a bullish wave.
It is that simple.
➢ It doesn't matter the time of the year, nor what politics or global finance says; the market cycles between up an down... After a bearish wave follows a bullish wave.
Here we have this very same dynamic shown on the chart.
➖ Kadena went bullish late 2023.
➖ Kadena went bearish early 2024.
The last event was a bearish wave. We are now set to experience a bullish wave, in accordance with standard market dynamics. This can be a big one.
Namaste.

Kda Getting Ready For Solid Recovery After Long Correction Finally Kda Preparing For Solid Recovery falling wedge breakout and retest has already confirmed
as resistance has got cleared sold recovery can start any time expecting 2x bullish wave
KDA USDT Current Price 0.468
after rest this level 0.487 Buy Green Line
STOP LOSS 0.455
TP 1 0.517
TP 2 0.556

KDAUSDT 1WKDA ~ 1W
#KDA Are you interested in buying it again. if yes, then this is the lowest price currently. expecting a profit of at least 20%
KDA → It is worth taking the risk!hello guys!
I think this coin and this position are valuable!
It made a Qm pattern! on the other hand, the reward to risk is more than 20x!
___________________________
✓✓✓ always do your research.
❒❒❒ If you have any questions, you can write them in the comments below, and I will answer them.
❤︎ ❤︎ ❤︎And please don't forget to support this idea with your likes and comment
#KDA Buy Trade **Technical Analysis Chart Description:**
Welcome to my Technical Analysis charts on TradingView! Before we dive into the analysis, it's essential to understand some important warnings:
1. **Subjectivity Alert:** Technical analysis involves interpreting market data and chart patterns, which can be subjective. Different analysts may interpret the same data differently, leading to varied conclusions.
2. **Historical Performance Doesn't Guarantee Future Results:** Past price movements do not guarantee future price movements. While historical data can provide insights, it's crucial to consider other factors that could influence price action.
3. **Risk of False Signals:** Technical indicators and chart patterns can produce false signals, leading to potential losses if relied upon blindly. Always cross-verify signals with other indicators or fundamental analysis.
4. **Market Volatility:** Crypto markets are highly volatile and can experience rapid price fluctuations. Be prepared for sudden and unexpected price movements, which may invalidate previously identified patterns.
5. **Risk Management:** Proper risk management is essential. Never invest more than you can afford to lose, and consider using stop-loss orders to mitigate potential losses.
6. **Emotional Bias:** Avoid emotional decision-making based on short-term price movements. Stick to your trading plan and strategy, and don't let fear or greed influence your decisions.
**Disclaimer for Crypto Trading:**
Trading cryptocurrencies carries inherent risks, and it's important to understand the following:
Cryptocurrency markets are highly speculative and can be subject to extreme volatility. Prices can fluctuate significantly within short periods, leading to substantial gains or losses.
Investing in cryptocurrencies involves the risk of total loss of capital. Unlike traditional assets, cryptocurrencies are not backed by any tangible assets or central authority, making them inherently risky.
Regulatory uncertainty and market manipulation are additional risks associated with cryptocurrency trading. Regulatory changes or negative news can have a significant impact on prices.
This analysis is for informational purposes only and should not be construed as financial advice. It's crucial to conduct thorough research and consult with a qualified financial advisor before making any investment decisions in the cryptocurrency markets.
By using this analysis, you acknowledge and accept the risks associated with cryptocurrency trading and agree to trade at your own discretion. The author of this analysis shall not be held responsible for any losses incurred as a result of using the information provided.
