Kda : the beaty of mathematicsKda being my n1 project for 2022, ive been folowing each and every move of this like a hawk.
We are nearing the end of the bear cycle in kda, so its time to have a plan for every option ready, so you can buy as cheap as possible. Buying 1$ lower in average will give almost 50% more profit at the end, so this is where all the money is made and the most important part that will influence your ROI.
And even though i already have identified some prices where there was action before and could be of importance.
Now by backtesting the first waves something stood out: 2 exp x. 2, 4, 8, 16, etc.
Wave 1 : abc a : 16$ b: 33% higher c : 8$
Wave 3 : abc a : 8$ b: 33% higher c : 4$
Wave 5 : abc a : 4$?? b : 33% c : 2$
So if history repeats this is what wave 5 would look like :
End poin a small wave at 4$, was previous low, so i wouldnt be surprise if the past low, provided suport for the b wave bounce, up 33% (tradable), end of small wave c at 2$. 2$ was a big price on the way up to 28$, there was lots of action, bull/bear pulling.
I think from the 3 possible tp for the bottem, 2$ might be it if history repeats.
I'd say :
10% chance its 5$ bottem
30% chance its 4$ bottem
60% chance its 2$ bottem
This could be a possible dca option. It would give around 3$ average buy in.
KDAUSDT trade ideas

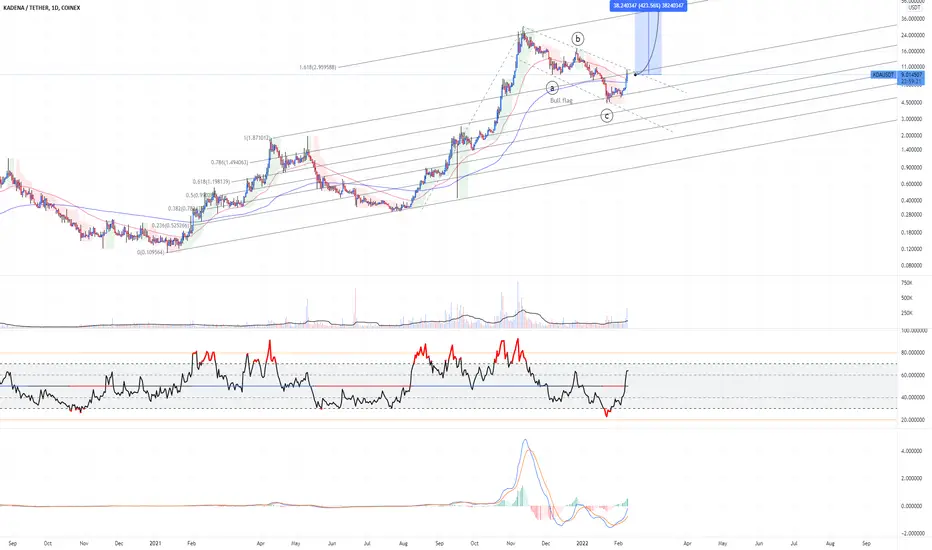
KDA.Usdt (Y22.P1.E2).Target reachedHi All,
This is a continuation of the previous KDA post, link below.
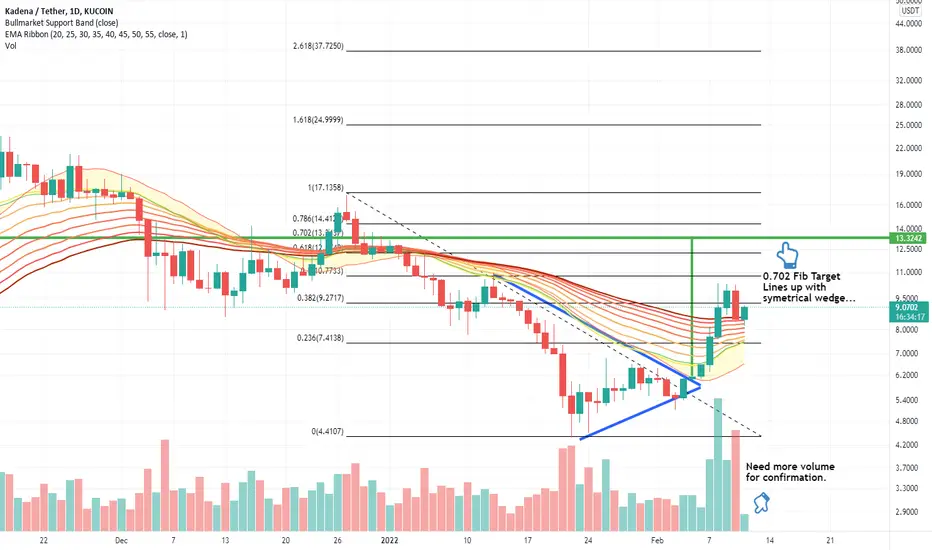
This has reached its target and is in line with BTC target, refer to my previous post.
Hence I expect a reversal structure of some nature before going up into major resistance.
Note: Head and shoulders structure of the neckline reaching its target with that bottom wick with the fib ext of 2.
I do believe we will see BTC dominance keep going up and the Alts getting smashed in the BTC pairing.
Hence KDA is in a bear market.
Refer to the link below and play it forward to see the macro view.
All the best,
S.SAri
PREVIOUS POST - over bullish

KDA T.Ain 1D time frame we have a down trend that it broke i think it could touch the trend and back.
what do you think?
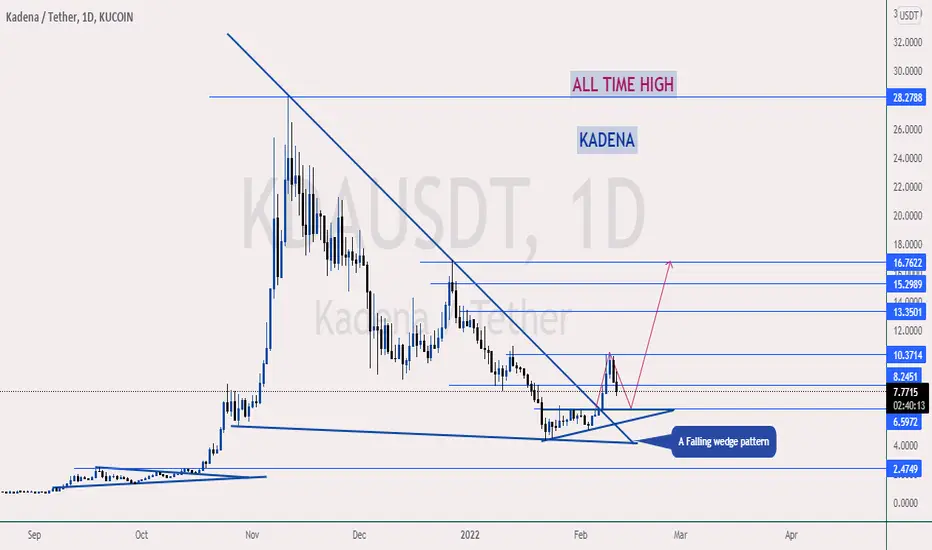
💥Kadena is moving as planned🤓Please support this idea with a LIKE👍 if you find it useful🥳
Not a financial advice🙅🏼♂️
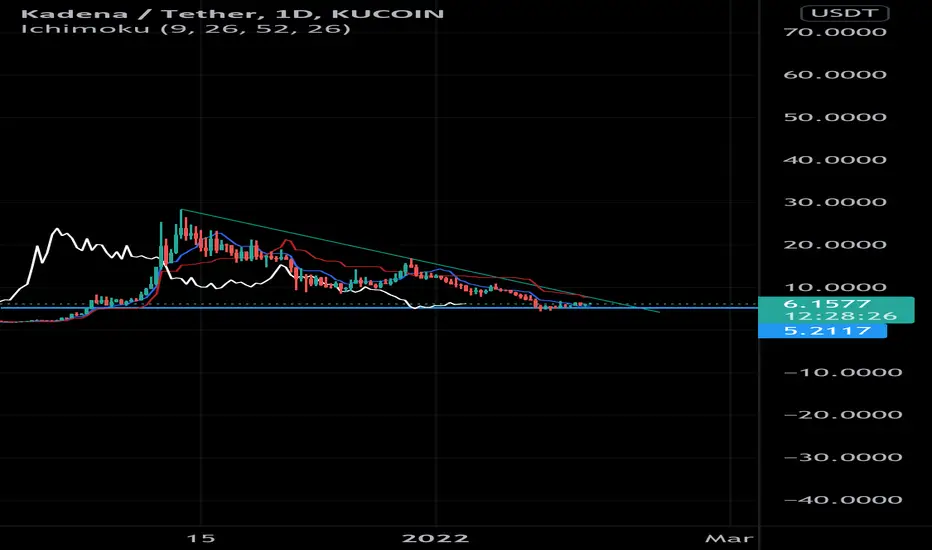
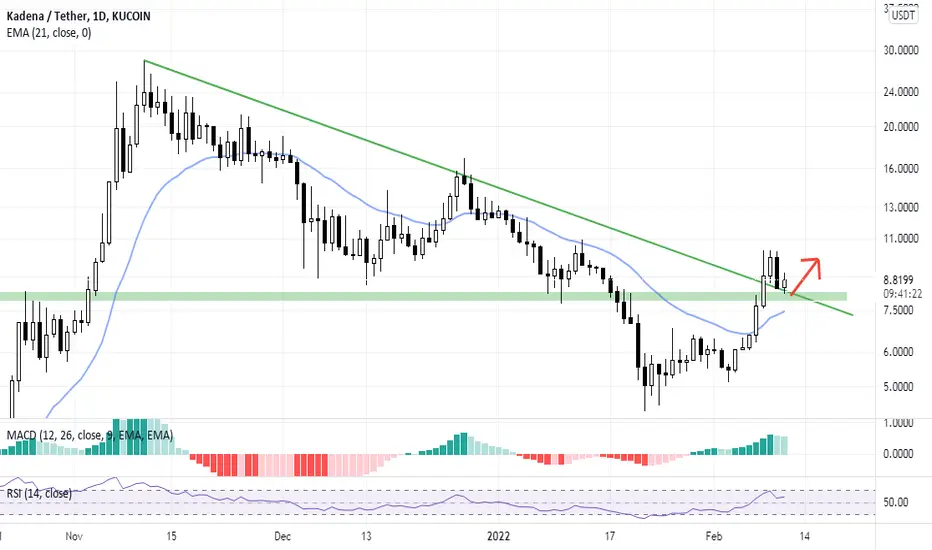
This is the kadena daily timeframe chart. Price broke out from both the falling wedge and an ascending triangle.
Price is retesting the breakout price. If price reverse at $6.60, then this pattern will be valid.
What do you think?
Share your opinion in the comment section✍️
Follow me stay updated about this coin and more helpful projects like this🎁
Happy Trading💰🥳🤗
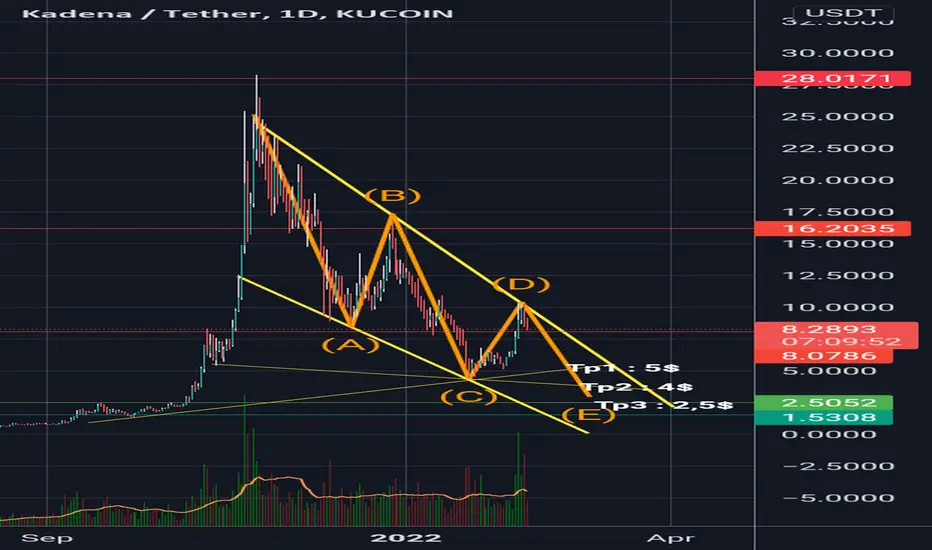
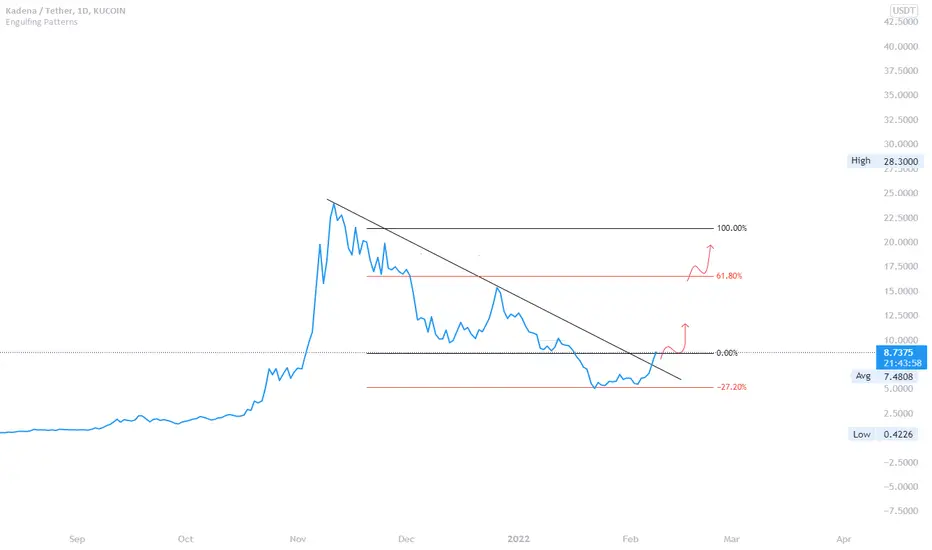
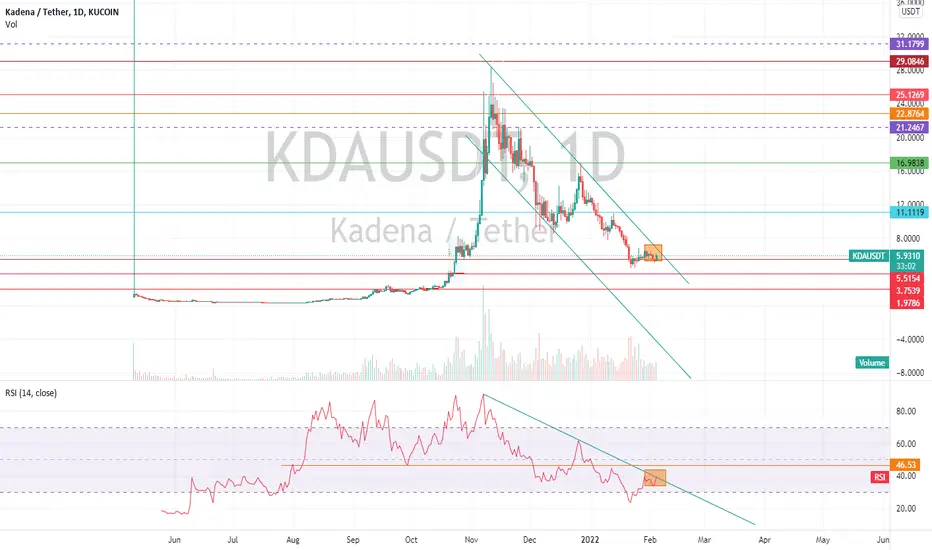
Some targets for the bottemAs we blew all fib levels, we can't use those, there is not much price action between now and the absolute bottem so very hard to find agood bottem.
I do believe we are going down. Btc hasnt broken the 45k level and is going down, 40k, 34k, 28k. Who knows
Kda has touched the trendline for the thirdtime, made a h%s on lower timeframe + a engulfing candle yesterday and a shooting star today, after doing a 2,5x.
So no doubt its going down, for the 5th and final eliot wave. The million dollah question is, how low? No one knows, just keep usdt , stay on sideline and watch. Soon, it will time to enter my friends, and than : kadex, bnb listing, moon and lambo's for all !! (In my case, getting my account brake even + a dollar for a cigar would be nice. )
So here are 3 options based on speculative trendlines.
4$ - 5$ saw some action before, and it also corresponds to two trendlines crossing so tnats two targets and last tp is the 2,5$ top from last cycle.
Dyr not financial advice, enjoy, press like and comment.
short termit broke its downtrend line and broke the pullback
and in this area there is a static support area...
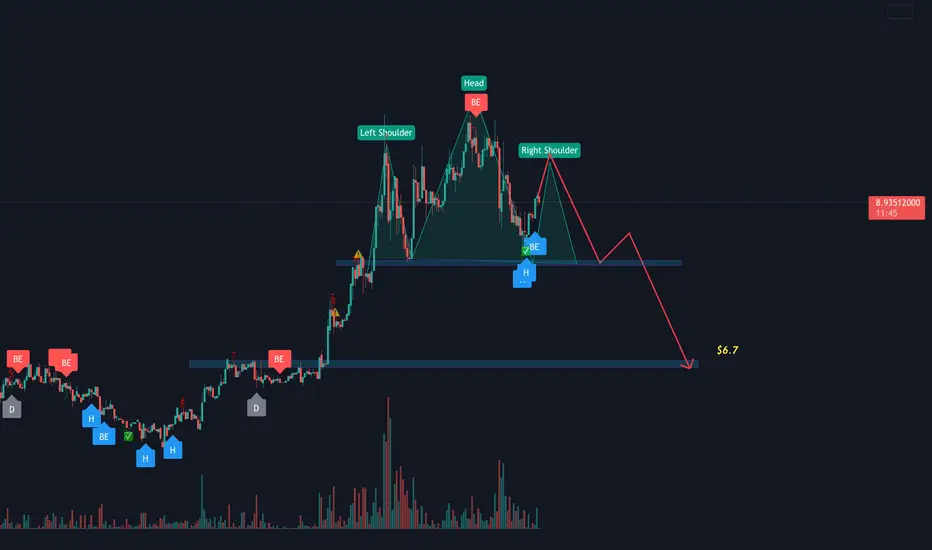
KDA Bearish Head & Shoulder on 1h TF ! Kda forming bearish head and shoulder on lower time frame ( short term bearish sentiment ) if it played out next good strong buying area is around 6$ to 7$ ! invalidation above $10.2
~
ps :- its just my observation on the charts ! its not a financial advice !
KADENA Cup & HandleKadena might be forming a cup and handle pattern, the previous one didn't work out through but there is more volume in this one.

$KDA KADENA Bearish Cypher ReturnLoving the progress on Kadena here. Correcting a little bit with the rest of the market but still above 8.30 which is very bullish to me. A nice check back and confirmation of support would be the signal for me that more upside is to come.
Im looking at the bigger wave structure here, and it looks to me like we've got the beginning of a bearish cypher forming, which sounds terrible to anyone unfamiliar with harmonics, but this is actually an extremely profitable leg of the XABCD.
If we confirm support here, id look to to 14-16$ next, with some overhead supply around 11.89, but in time if this bullish trend continues i think 23 minimum.
Macro targets above these levels on the Kucoin data feed here is 34 and 42$, with the highest level on the chart being 88$
If we really see a lot of pressure to the downside, id love to see that 6.75 area backtested as support, but its hard to say at this point. This idea would give you a Bullish Cypher on the 2hr chart which is confluent with the range high as well.
4hr looks like its putting a bottom in at 8.51, but the rsi remains neutral and downsloping. Not oversold or bullish. Uptick in volume on this new candle here as it flips green. ADX is curving downward indicative of distribution, which isnt strange right now. Still a bullish trend overall and id consider this normal ebbs and flows following a large price mark up.

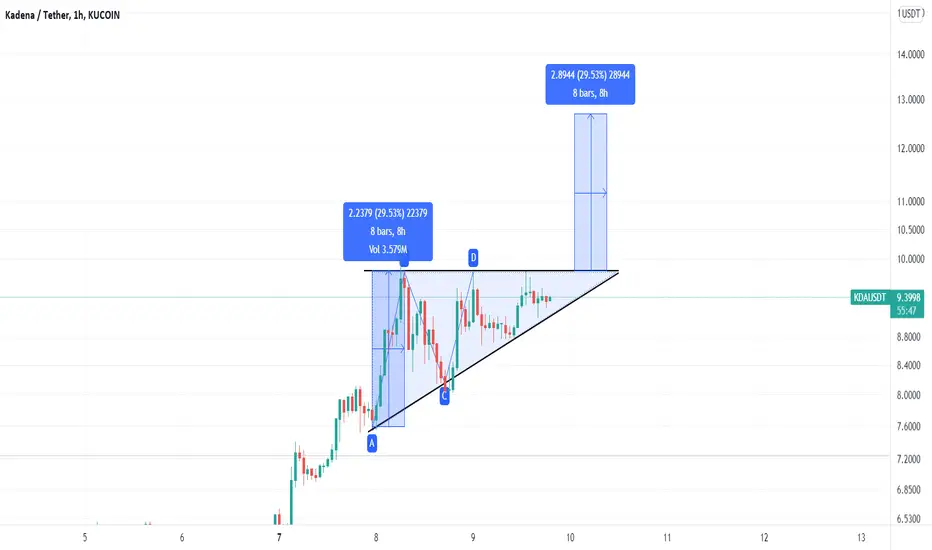
Massive KDA Trade!Hey guys!
Similar to BTC, there is a potential breakout on the short time frame of KDA of +30%.
if anyone knows where I can get leverage contracts for this coin please let me know!
Safe trading,
-Pulkanator
kda daily charti think we will see another bullish rally after hit the blue line
we are in the wave (c)

Kadena Bull FlagHey folks, welcome back to another one of my posts!
Kadena has completed the ABC correction and seems to be in a huge bull flag waiting for breakout. Currently, we are testing the resistance from the 1.87 fib channel level. If we do break above, then the price will 4x from there. Currently, it looks like a good spot to enter a trade!
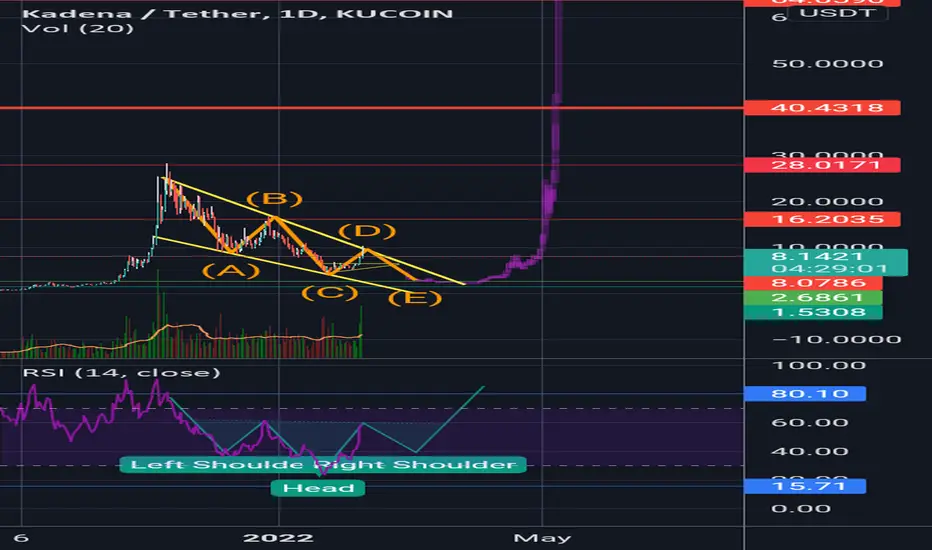
Last wave down. Than lamboAll in the chart.
Dca zone : 1,5$ - 2,5$ : wife changing money. 20x
Expect h&s reversal pattern, last wave making right shoulder, making first higher low on the rsi and reversal pattern.
Patience... you make money when you buy, not when you sell. As long as trendline not broken we are going down. Wick shows fakeout.
$KDA ( #Kadena ) soon double figures again$KDA pumped 100% from its 4.9$ low and now consolidating and making bull flag again ! soon it will enter into digital figures !! buy the dip season !
ps:- its just my observation on charts NFA !
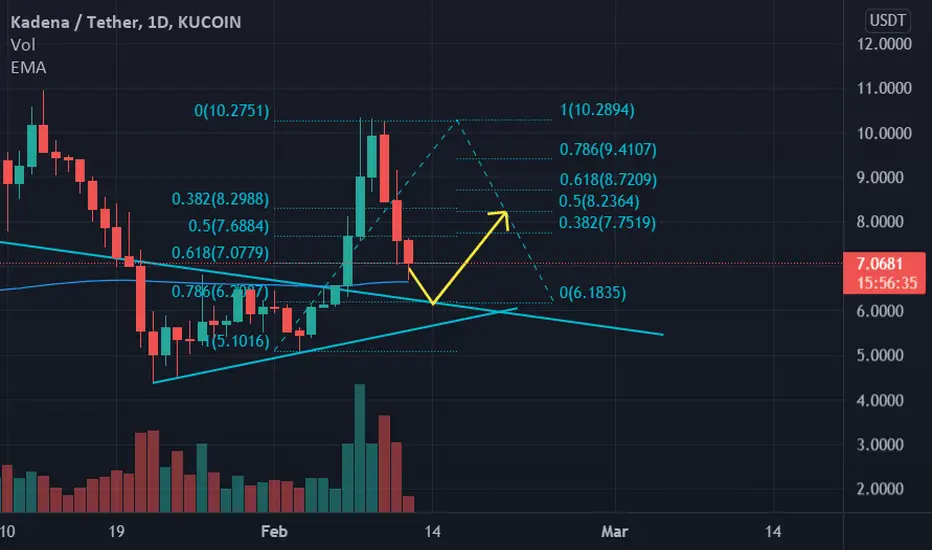
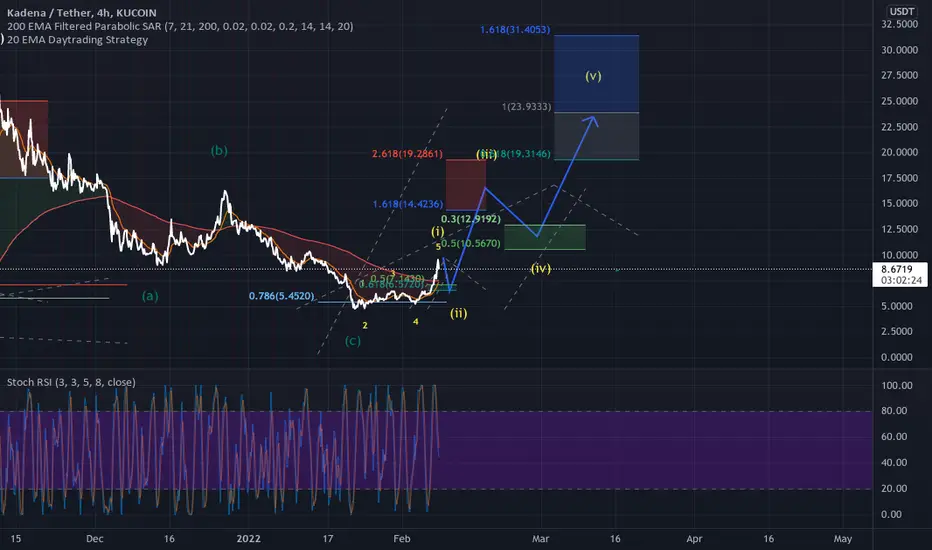
KDA/USDT if the bottom is, wave 1 of a wave 1 of wave 3I am leaning towards the bottom being in for KDA, which means we should see a nice move to the upside after some consolidation following the recent pumps. This is a short term plan and should reach the target within 2 months.
KadenaLong term trend break, yall know the vibes.
Given the current strength of the market gains momentum, this would be the bottom for most altcoins, including KDA.
On Fib patterns like this, if price doesnt find support or resistance at the 0% line, it almost always does so at 38%. 38% would be ~$13.5.
Before that the 23% line can also be seen as a strong level. This mark would be at the $12 price.
Aside from that, given the breakout, the only way is up, until those levels given, then price should experience some type of retracement.
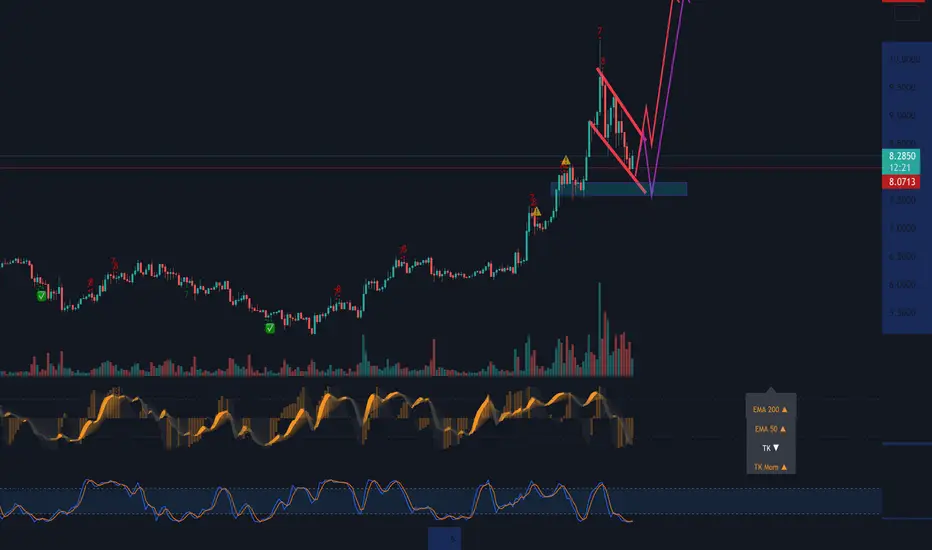
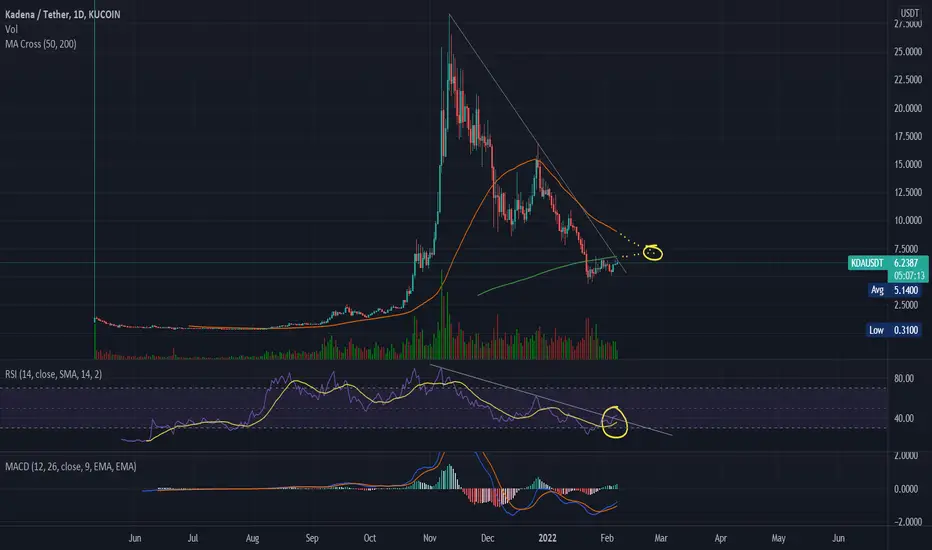
KDA prepairing to blast offKDA has interresting setup. Price waiting to brake, RSI just did. What is interresting, is the golden cross, that will happen arround feb. 24th. This thing will fly... Farewell!
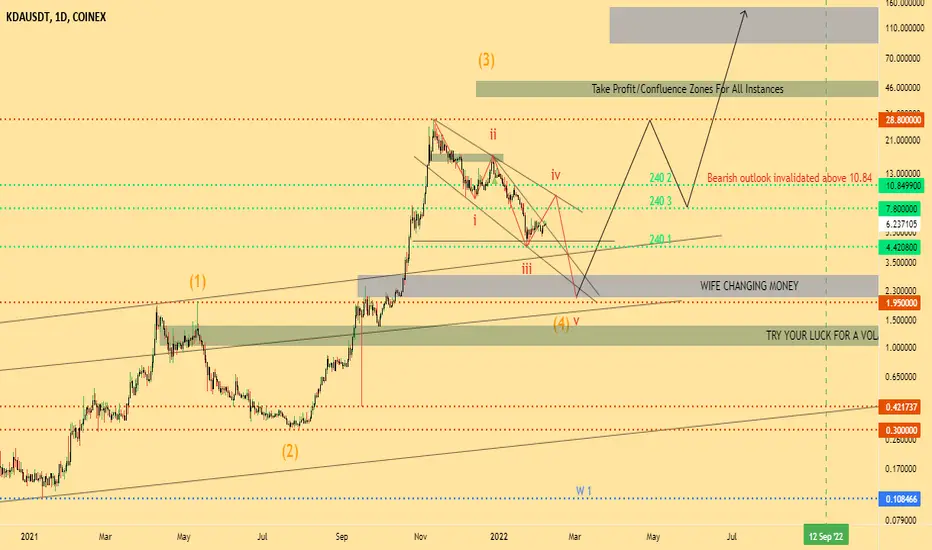
IS THE CORRECTION OVER FOR KADENA? (KDA ANALYSIS)In our Last KDA analysis we correctly predicted the sell of down to its current levels which was our DCA zone as shown below
In this analysis, we will look at the thigns required for KDA to meet our desired buy target of $2-$1.95
Still in it's correction phase, looks to be a gearing up for a wave correction of the downward 5 way impuls move.
Should this be the case, KDA could see prices of $8-11 before take a turn for our $2 dollar price target completing the impulse move down.
However, A close well above the upper green resistance and a succesful retest as support would invalidate our analysis.
Price Targets of $40-50 & $85-150 remain unchanged.
If you agree with pls leave a like and share your thoughts in the comments.
Feedback is appreciated.
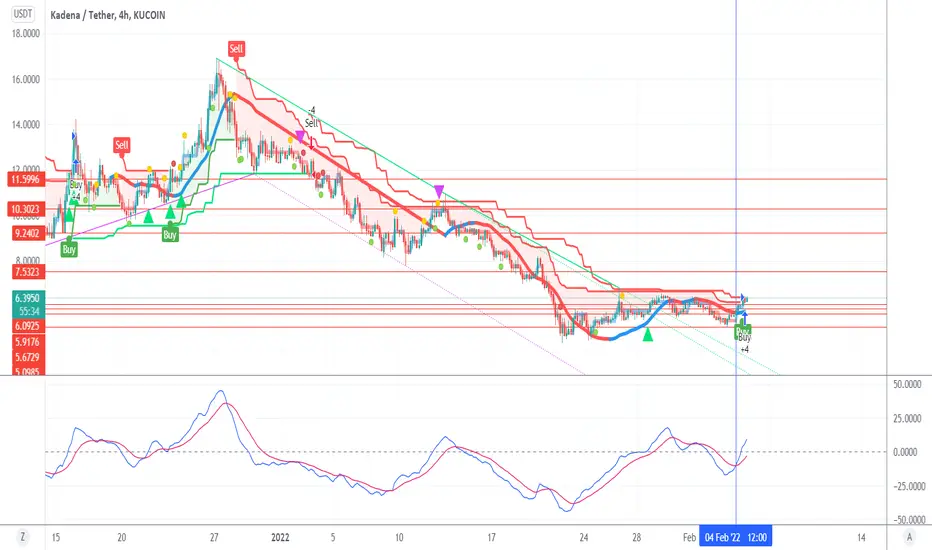
NEW UPDATE 4H $KADENA $KDAAre you ready to fly?
Let's go Kadena !?
Reaching the moon is closer to us than the jugular vein !?
Hail to Kadena Hail to JP Morgan Hail to the patient guards of Kadena
KdaUsdA quick analyze for Kadena
We can say we are changing our direction from down trend to up trend as the chart showing " breaking the down trend for RSI and Chart "
If You like Our Idea Please SHow Some Love " Like and follow me For More Signals "
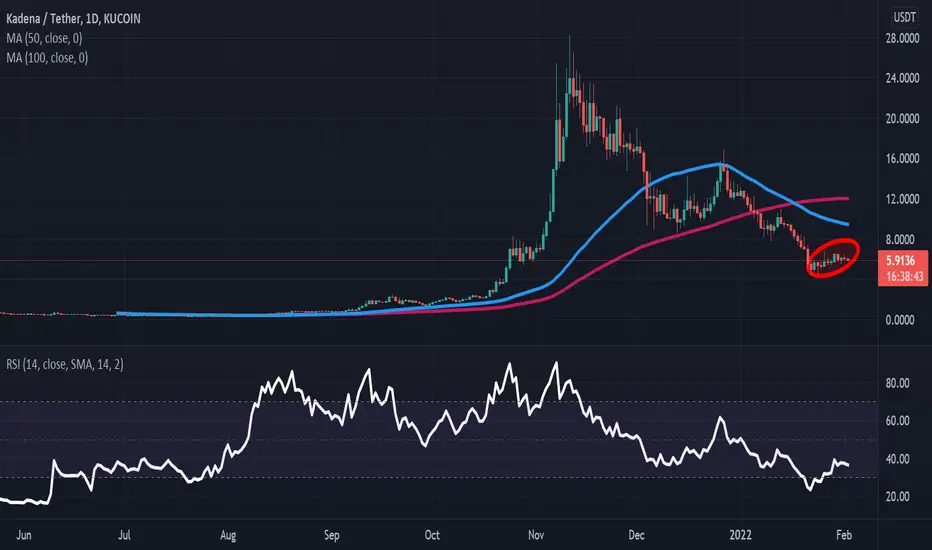
Will KDA Coin Price Observe A Breakdown To Lower Level?The weekly technical chart of the KDA hints towards a consolidated trend in price. On coming to the daily chart, the coin price is currently in a bearish move. The upside trend of the Kadena may see a setback near $8. The downtrend of the asset can see bounceback near $4. The asset is currently below the 50 and 100 Daily Moving Average, with a negative crossover, The 100 DMA is near $12 which can act as a temporary support of the price.
brethbreak on KDAbreaking this trend with positive move from BTC
will take us high
i think we are in accumulating zone
just share my thoughts