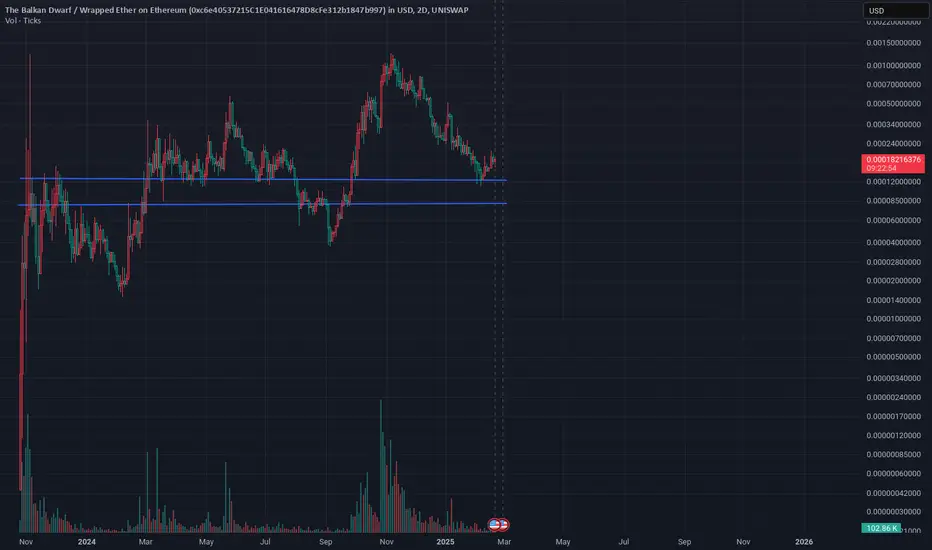
KEKECIn the same meme genre as JOE, with a similar chart pattern. Reference JOE analysis for similar thoughts on where price might be going.
There is a risk on all charts for a final 50% capitulation. If it's going to happen, it's going to happen within the next 2 weeks, likely next week though.
Exp
Key stats
Trading activity
Transactions 185
BuysSells
75110
Volume 333.53 KUSD
Buys volumeSells volume
156.72 K176.81 K
Traders 155
BuyersSellers
6194
About KEKECWETH_C6E405.USD
Related DEX pairs
Summarizing what the indicators are suggesting.
Oscillators
Neutral
SellBuy
Strong sellStrong buy
Strong sellSellNeutralBuyStrong buy
Oscillators
Neutral
SellBuy
Strong sellStrong buy
Strong sellSellNeutralBuyStrong buy
Summary
Neutral
SellBuy
Strong sellStrong buy
Strong sellSellNeutralBuyStrong buy
Summary
Neutral
SellBuy
Strong sellStrong buy
Strong sellSellNeutralBuyStrong buy
Summary
Neutral
SellBuy
Strong sellStrong buy
Strong sellSellNeutralBuyStrong buy
Moving Averages
Neutral
SellBuy
Strong sellStrong buy
Strong sellSellNeutralBuyStrong buy
Moving Averages
Neutral
SellBuy
Strong sellStrong buy
Strong sellSellNeutralBuyStrong buy