KMDBTC trade ideas
Komodo Hits Demand Zone: Double Bottom + Bullish DivergenceKomodo (KMDBTC) Chart Analysis
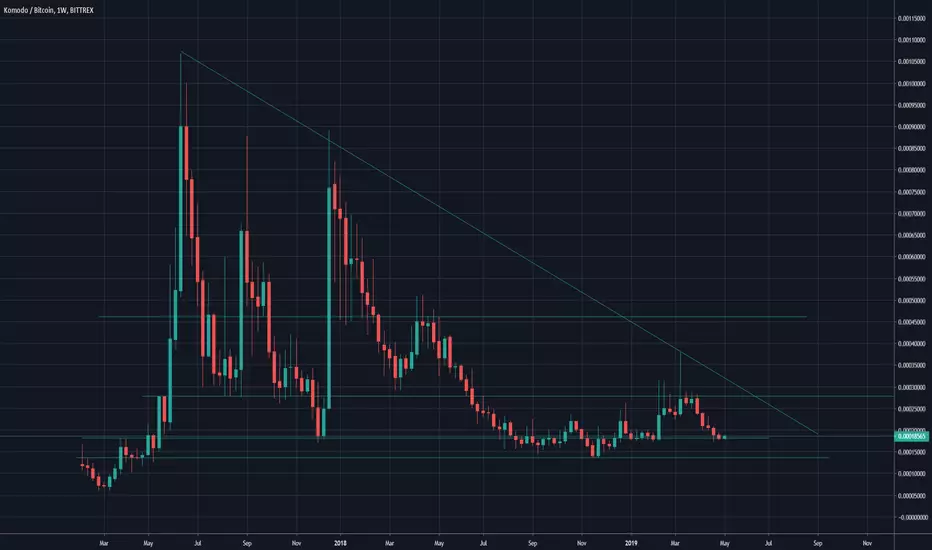
KMDBTC Long term chart:
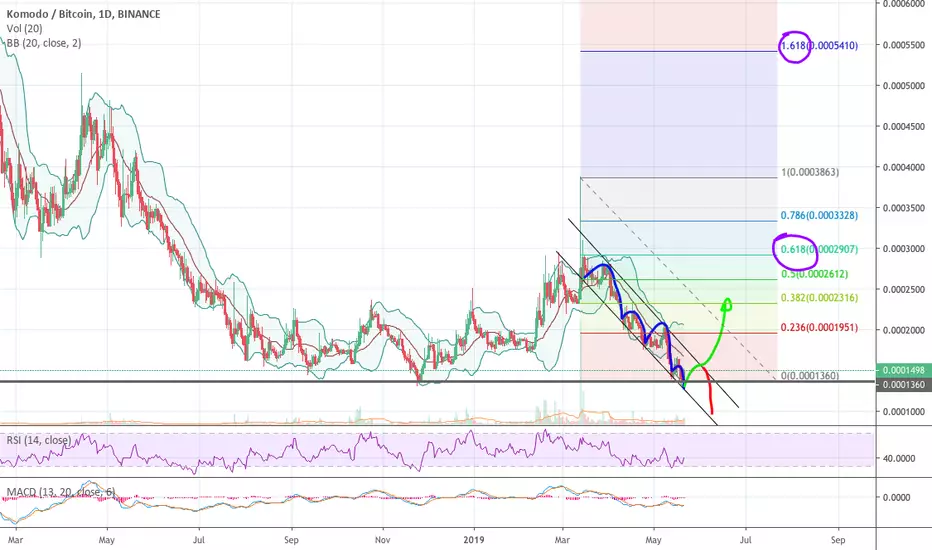
Here we are looking at a double bottom on the long term weekly chart for Komodo (KMDBTC).
After this demand/support zone was hit last time, back in November 2018, KMDBTC went on a bullish wave that generated 190% profits. We believe that the next wave can be even bigger, we are looking at around 250% profits from the current price to resistance. Up to 720% in profits to ATH.
Bullish divergence on the MACD.
Increasing trading volume.
Let's take a closer look to see the different signals in the making (main chart above):
The bullish divergence on the above chart is marked with a purple arrow and is showing up on both the MACD and RSI.
Now trading above EMA10 (needs a close above it on the daily time frame for signal confirmation).
Komodo (KMDBTC) hit strong support (demand zone) and is very likely to produce a bullish wave within the next 1-3 weeks.
All details are shared on the chart.
Feel free to hit like to show your support.
This is not financial advice.
Namaste.

a Bullish case for KMD Komodothe last time the MACD daily crossed this low, it went on 184% run. This time its doing it from a double bottom, with more volume.

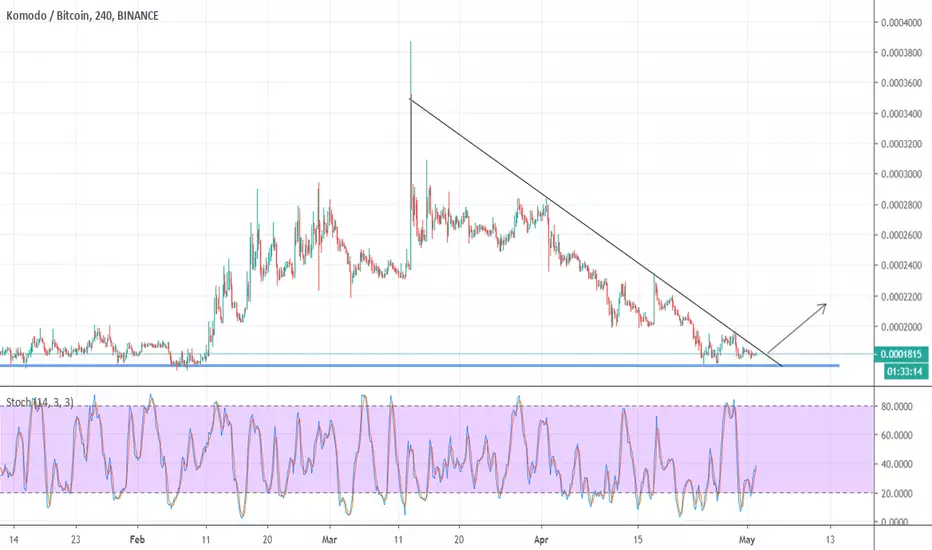
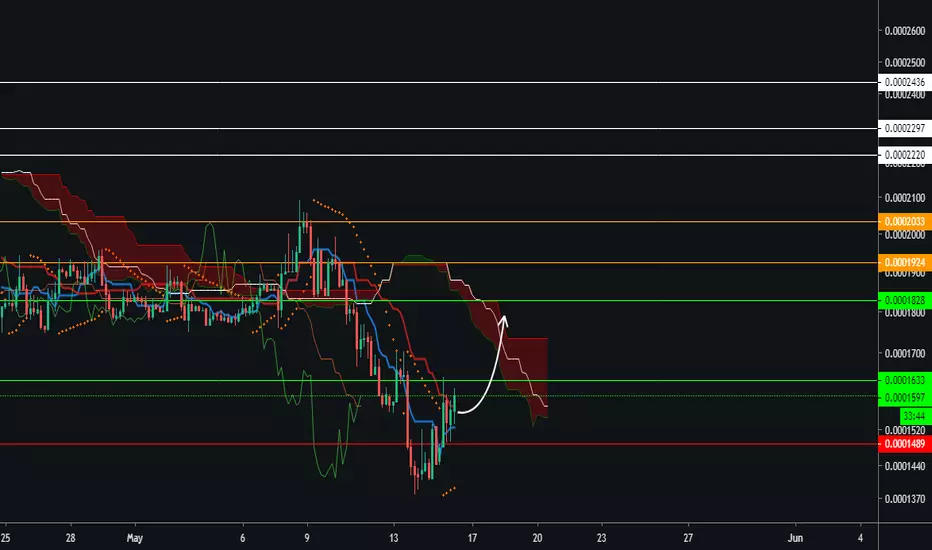
kmdbtc still in this sideways channel, gives us some nice swingsKMD is in a nice sideways channel. Buy area 1390. sell 1560-1630.


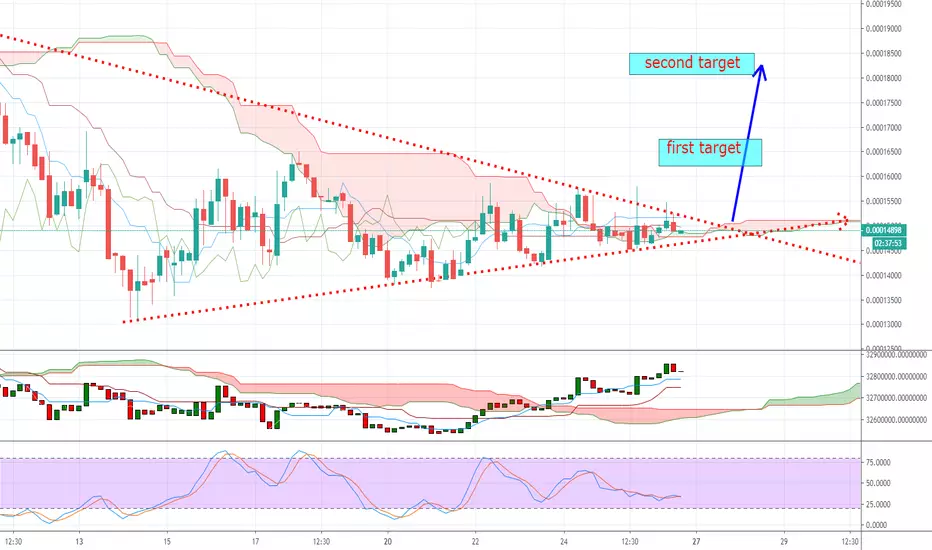
KMD/BTC - 1D Chart (Long)KMD/BTC is setting up for a bullish move over the next few weeks. The price has tested the B.0002250 area repeatedly over the last few months and has held support after each failed attempt. We are now at that price level again and probabilities favor a bull break. Price action has created a bull-cross and the CCI is showing strength. KMD could easily gain 100% from current price; updates will be provided as trade develops.

Komodo just can't stop.The perfect example of the power of S/R flip. After a long period of accumulation, $KMD finally breaks out of the zone and re-claims the support at the original breakout zone. Now is the phase where KMD shoots up.


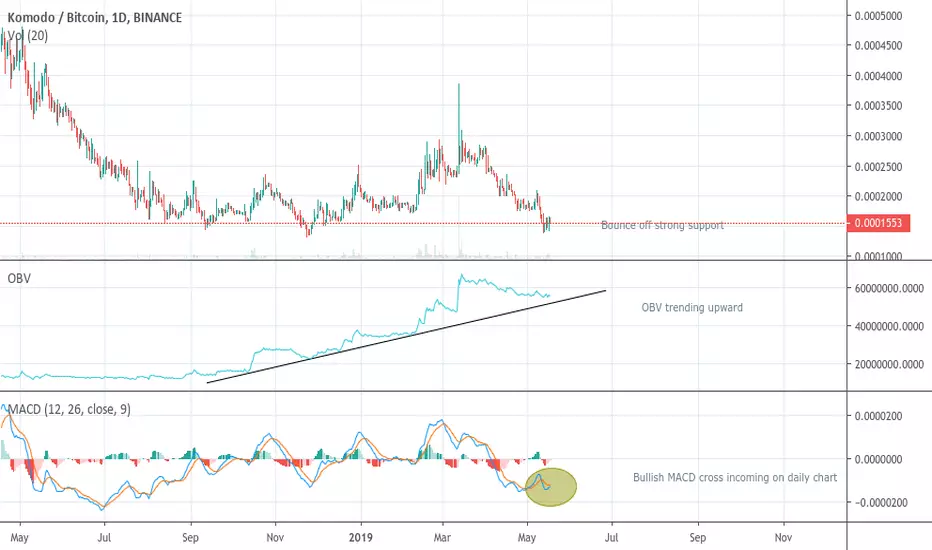
KMD bounce off ATL (long)OBV looking extremely bullish. MACD bull cross in next few days. At strong support. Tons of FA related news coming this summer.
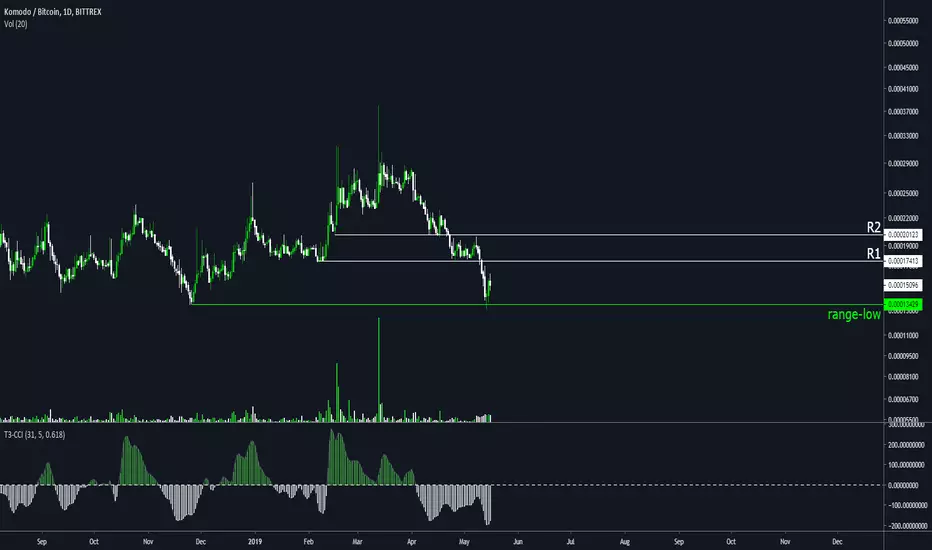
KMD ThoughtsKMD
Quite the brutal sell-off over the last few weeks.
Recently dipped past the range-low and bounced. I think R1 will act as a tough resistance to break on the first try, so I'd be comfortable taking profit and trying to buy lower once price reaches. If I'm wrong, R2 is next.
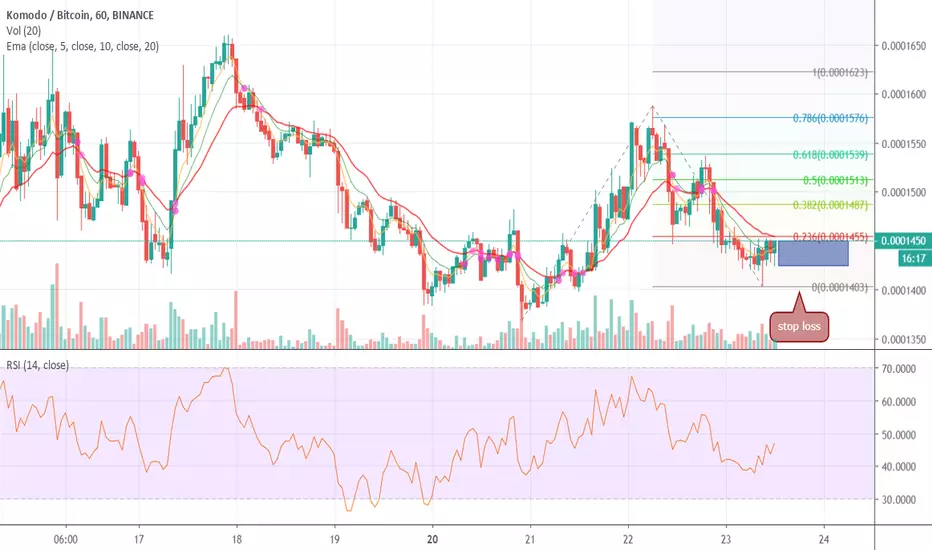
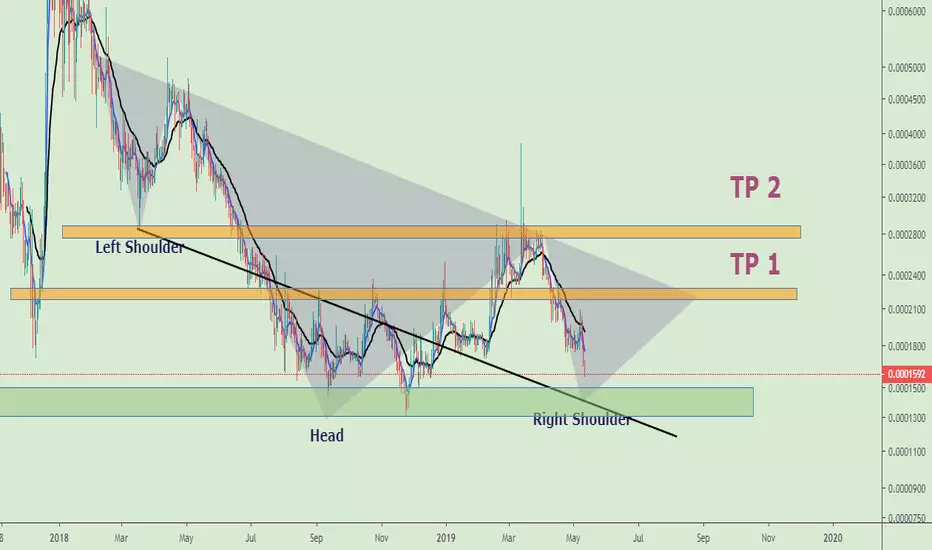
KomodoWe've seen KMD is a giant coin so far. After a massive move in its last bull run, correction started and finally 1430 stopped it. I believe it's a huge potential trade setup. Targets are lined in the chart . Hope you enjoy it.
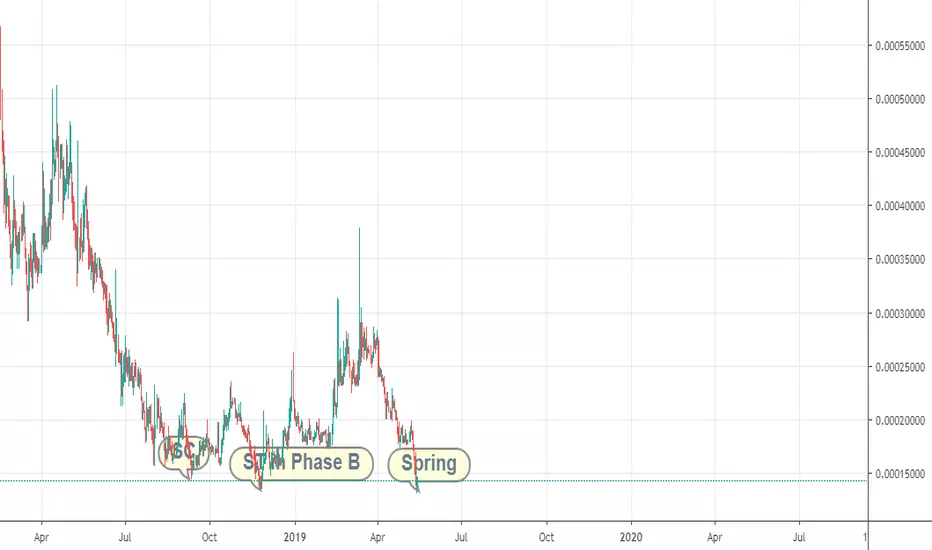
Wickof playing the game again!Maybe it can go little more deeper but we can say freely Spring is here!!!!!
KMD looks Bullish af. KMD BULLISH!
Dangerous time for alts, though! BTC Could break the lower support of her ascending channel and dummmmmp! Or push it's current pennant and push 9k.
Good time to buy long term. Dangerous for weak hands.

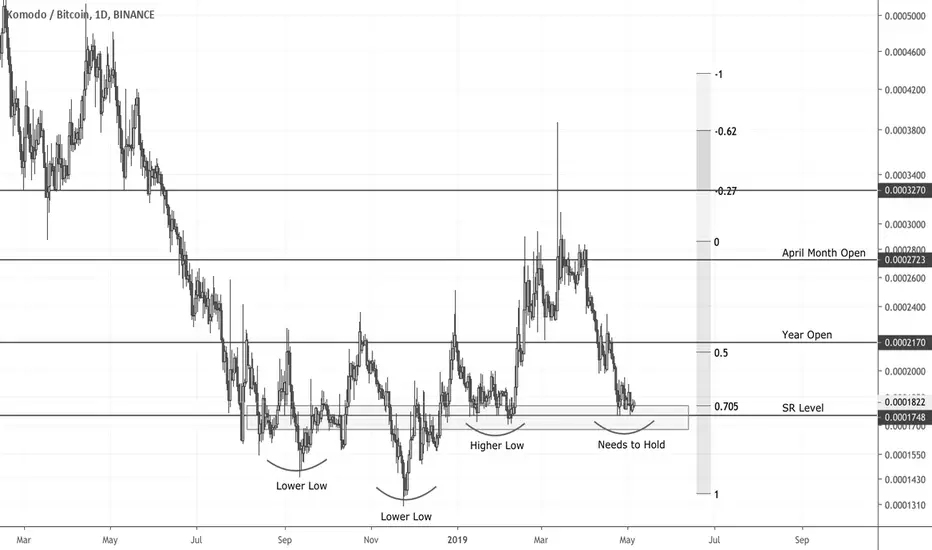
KMD - Looking for SR to holdI like KMD. I like its eco-system, and I like the token.
I've been waiting for KMD to retrace.
The scale of the alt retrace has been stronger than many expected - but it offers up new opportunities.
I will keep watching for the Market Structure to hold for an entry, no point risking all in from here, wait for confirmation for the sake of missing out on a few % gains.
$KMD - LONG - 1D - TRADE IDEAPROS
- Bullish divergence on the RSI Daily
- Currently holding Feb lows
- Price is squeezing in anticipation of a move
- Good R/R for this trade
CONS
- Sill has low volume at this level would like to see a spike in volume
Want to see it hold above its December lows to hold an accumulation and higher lowi if it closes under 1793 I will look to enter again lower

KMD Bullish$KMD
Falling wedge + clear bullish div on the 12H, I think we'll see a bounce here shortly, I'd look at R1, maybe R2 as potential targets/TP's.