KMDBTC trade ideas

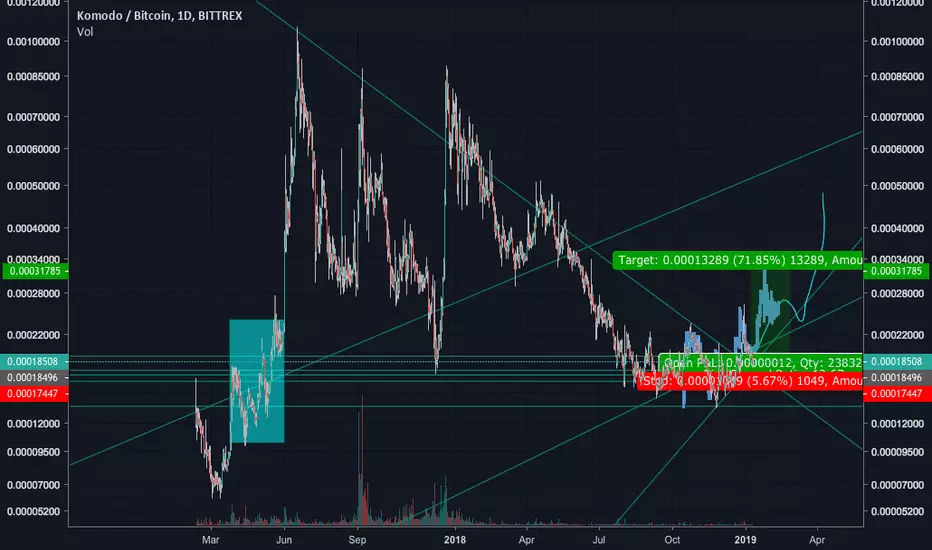
KMDBTC Trade opportunityKMDBTC moving in rising channel after breaking out from the corrective falling wedge pattern.
Kindly follow the suggested accumulation zone on the chart and always remember to apply stop loss.
BLUE: POSSIBLE ENTRY ZONE
RED: Possible Support LEVEL
GREEN: SELL TARGETS
Do know that I appreciate you taking the time to read my posts and Please leave a LIKE and FOLLOW us for more updates.
Thank you
Note:
It will be good to always understand risk involve in trading. Always trade with stop Loss in place.
Set up an entry/exit strategy for every trade, with good risk/reward ratio.
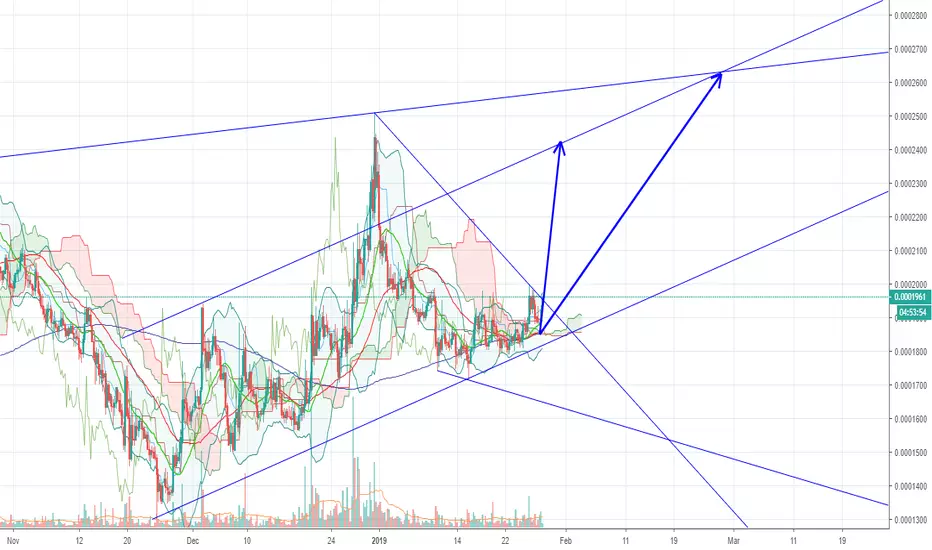
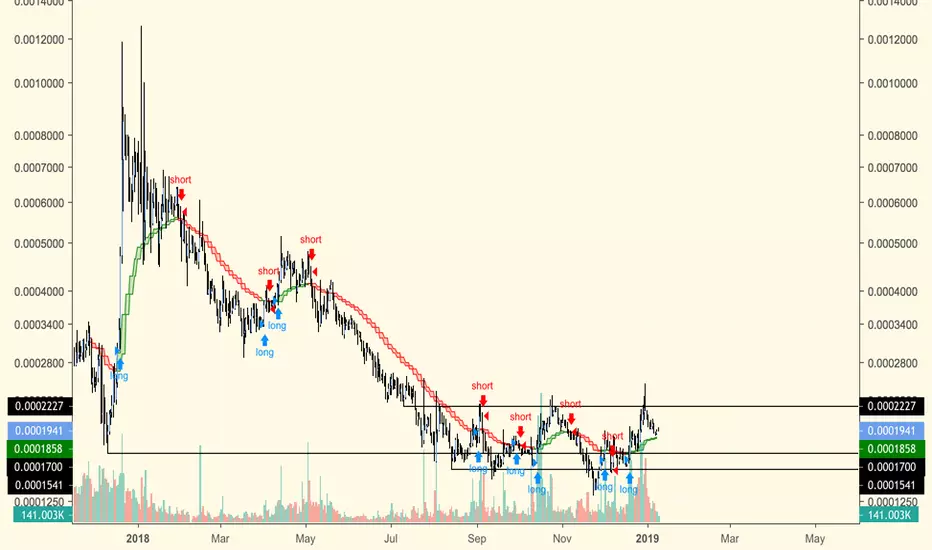
Daily Bullish Signal $KMD #KMD (28 Jan 2019)BLUE ARROW indicates the EXPECTED Time and Targets
Level Stoploss point up to maximize profit and reduce risk
I'm working all the time, even in Bearish Market
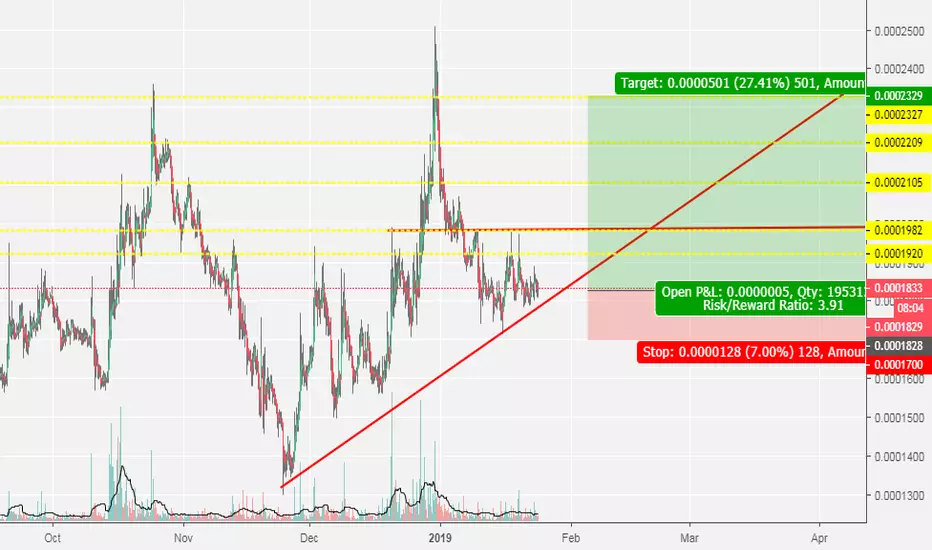
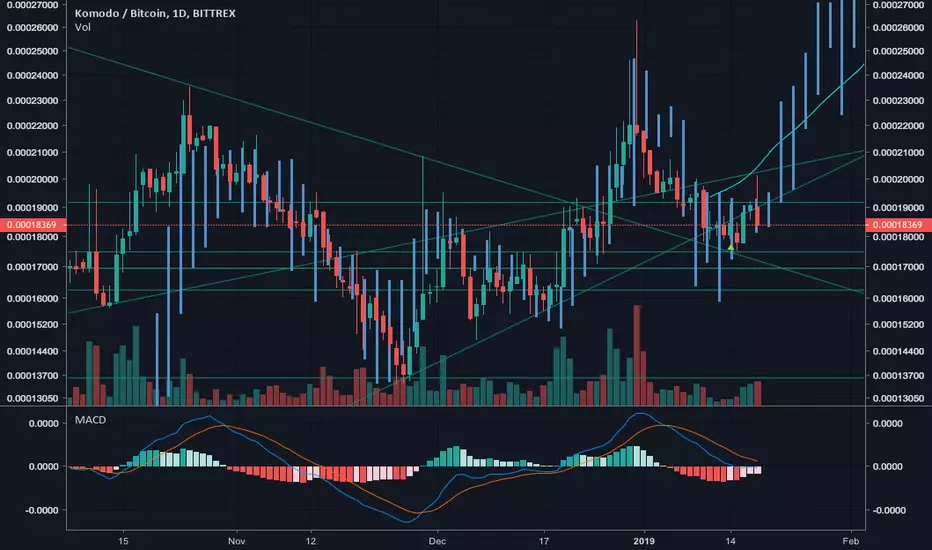
iH&S on KMD 1DKMDBTC could complete this iH&S in the coming days. If so the target long could be a tasty +50%. I would recommend taking profits at levels on the way up. RSI is matching the iH&S pattern and SAR is giving a long signal to boot.

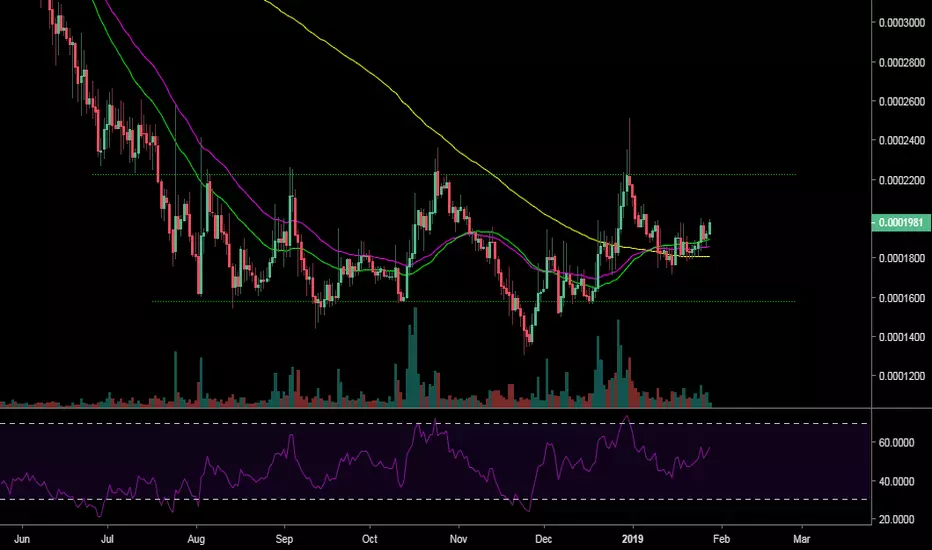
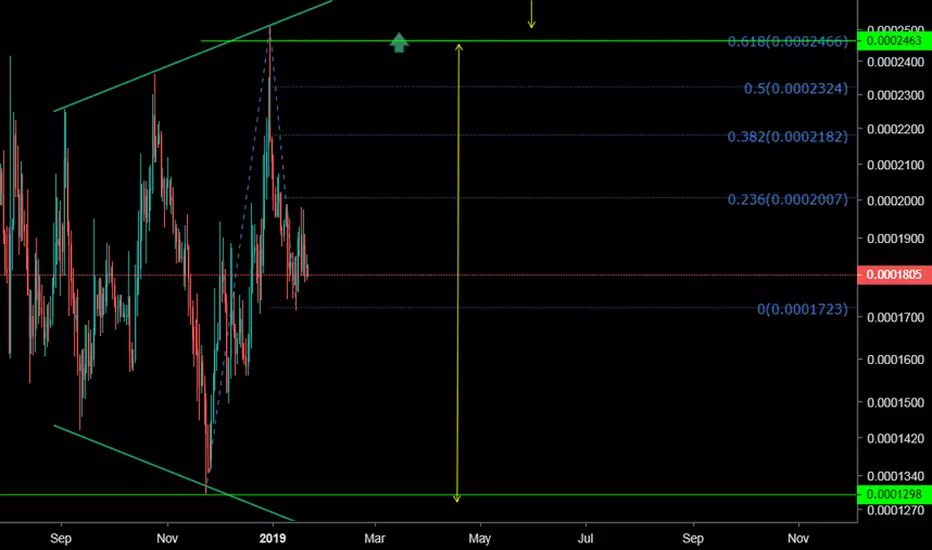
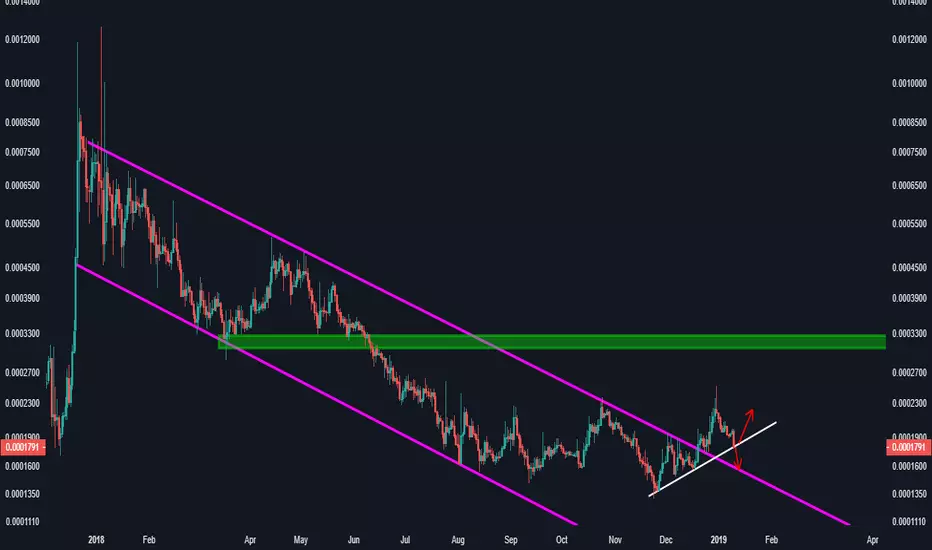
Waiting for the Pump!(or dump...)(I always liked this project) Slowly starts bouncing in a shorter range inside a symmetrical triangle...
Eventually this will break with force to some side, for now set alerts 1863sats & 1805sats.
Wait for Volume and UCTS signal before taking the trade

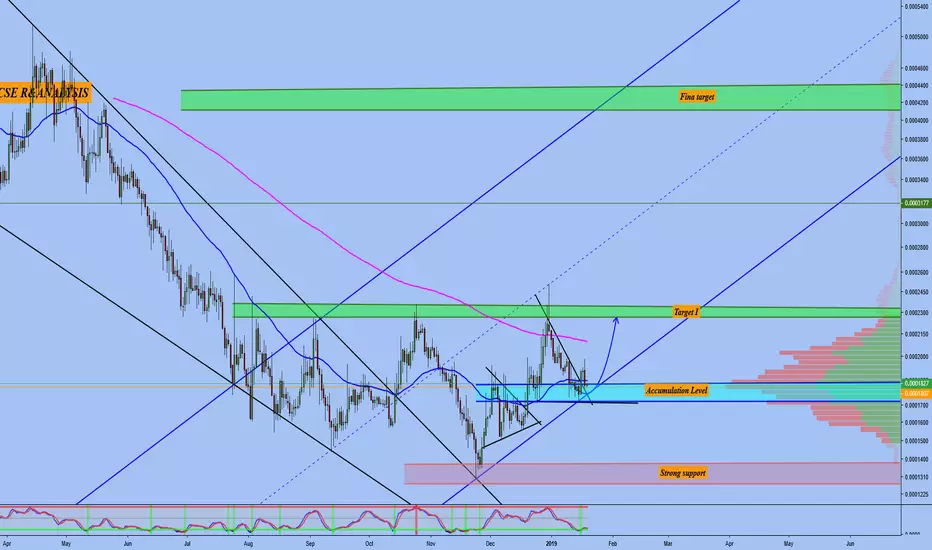
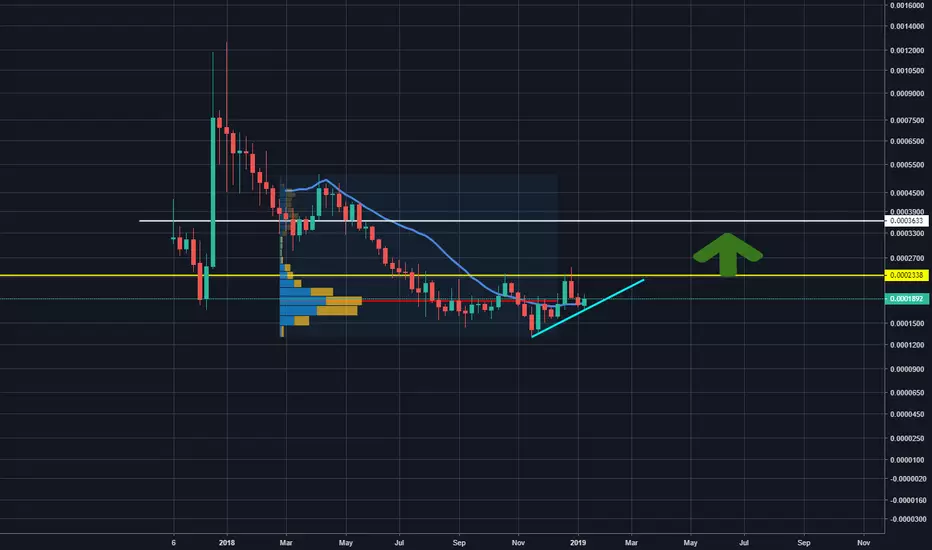
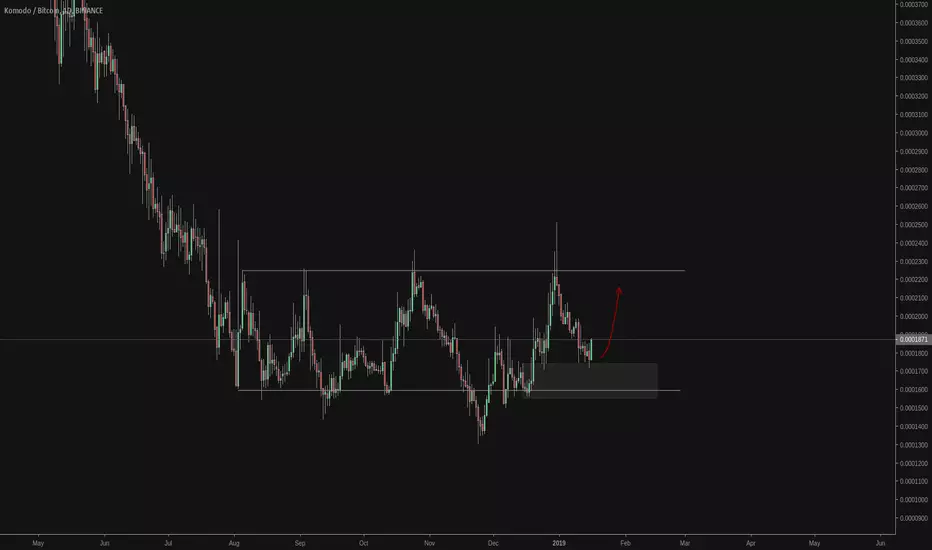
KMD Price Level could Trigger a Bull RunWe have been following the accumulation cycle of KMD for quite some time now. (Aug 2018 - present) In my opinion KMD is reaching towards an end of this cycle and it could result in 30-50-70% increase in price.
KMDBTC SHORT TERM HIGH RISKOnly if we close aboce the orange line I will look for enty
High Risk !!!
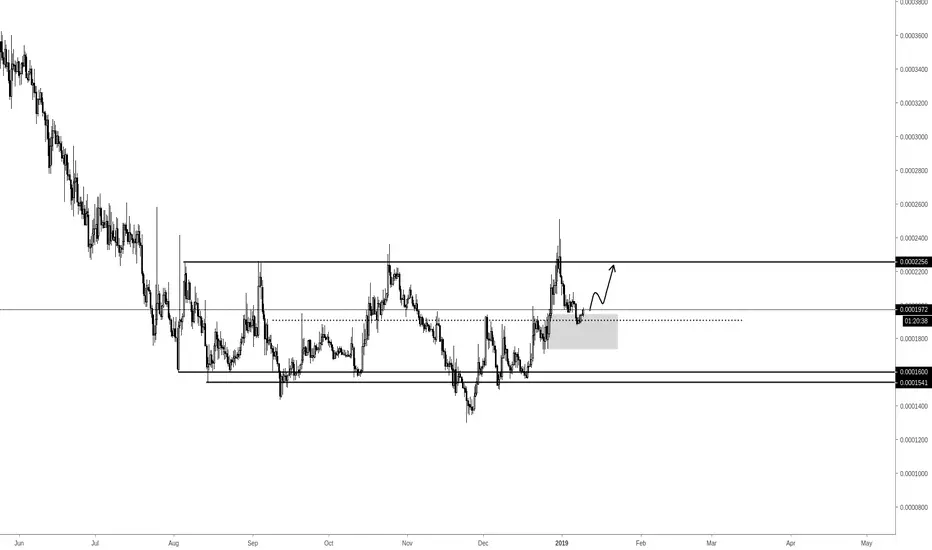
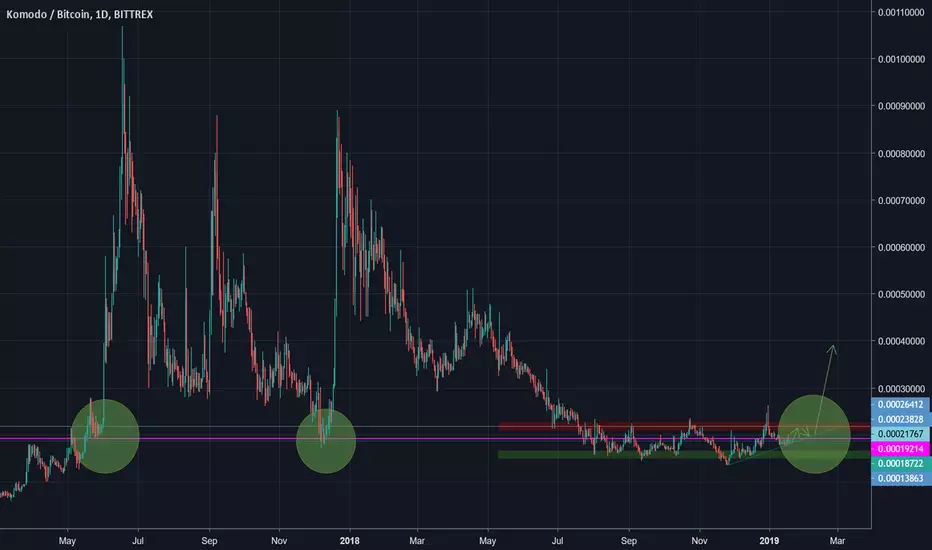
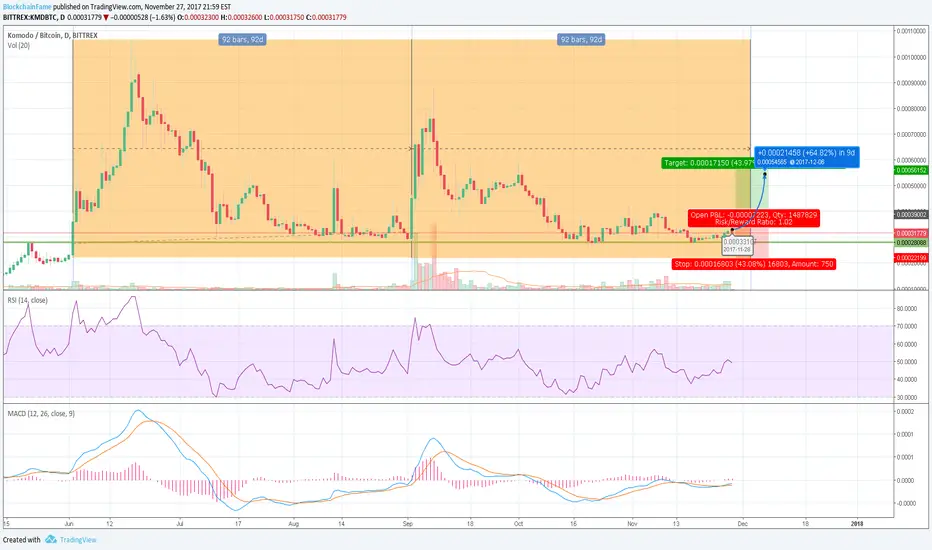
KMD Looking to be in ready for a breakoutLooking at the day chart, it looks like KMD has been accumulating for the past few months, establishing a very solid support line.
Been bouncing off that support line for weeks now.. Looks due for another rally any time soon.
First target around previous resistance of 39k, then 56k, then around 70k.
Personally would set SL at 22k.
bounce now or forever hold your piecethis my last shot at giving kmd a chance to move from this critical horizontal S/R
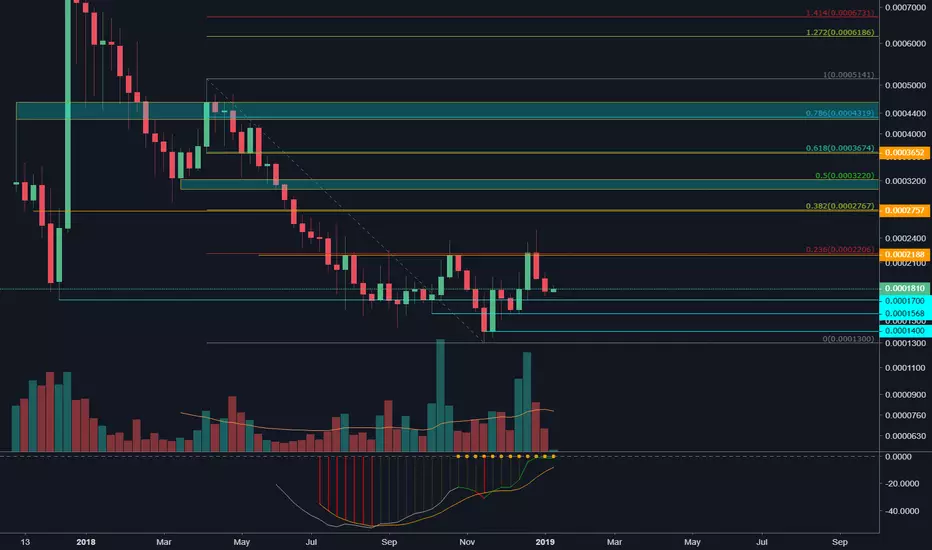
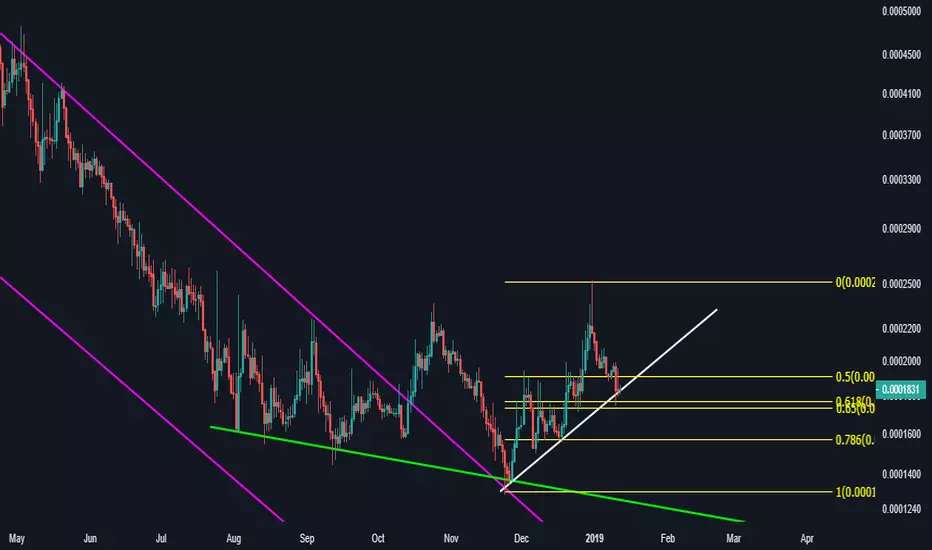
KMD/BTC Weekly Squeeze + Momentum UpTargets line up nicely with the fib levels on the chart.
Levels of support currently highlighted in turquoise.
Maxx Momentum is currently up during a weekly squeeze so the set up looks decent here on KMD.
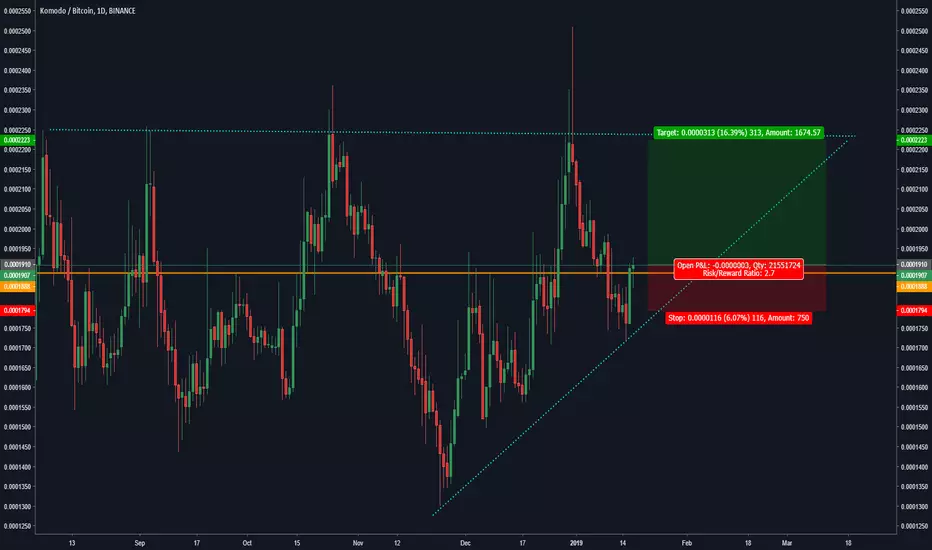
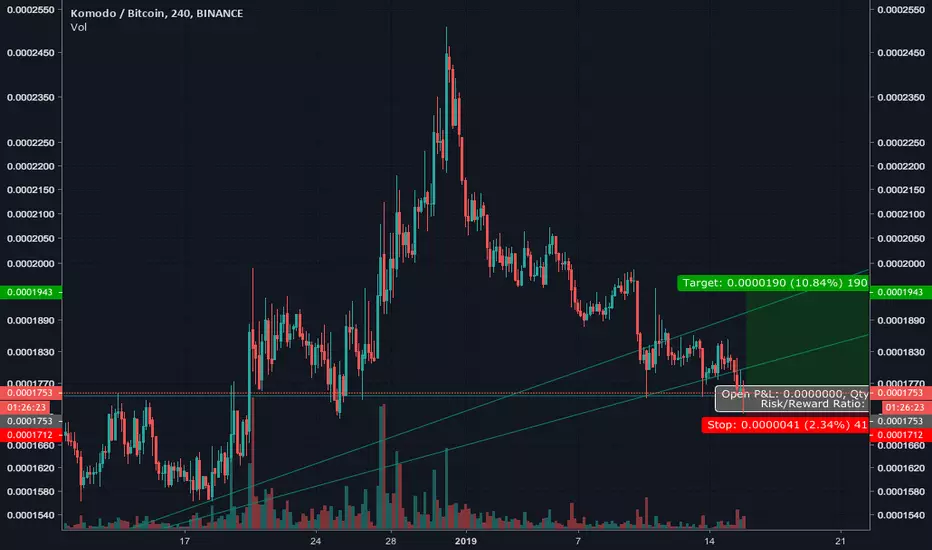
Long first retest on $KMDBTCLooking for a long at around 1.8k on $KMDBTC.
I was originally look to enter at around 1.9k but after looking at the Daily chart it looks like 1.8k could provide a much better entry.
No need to rush it, id rather wait for a better setup than risking getting stopped out.
Patience is key.

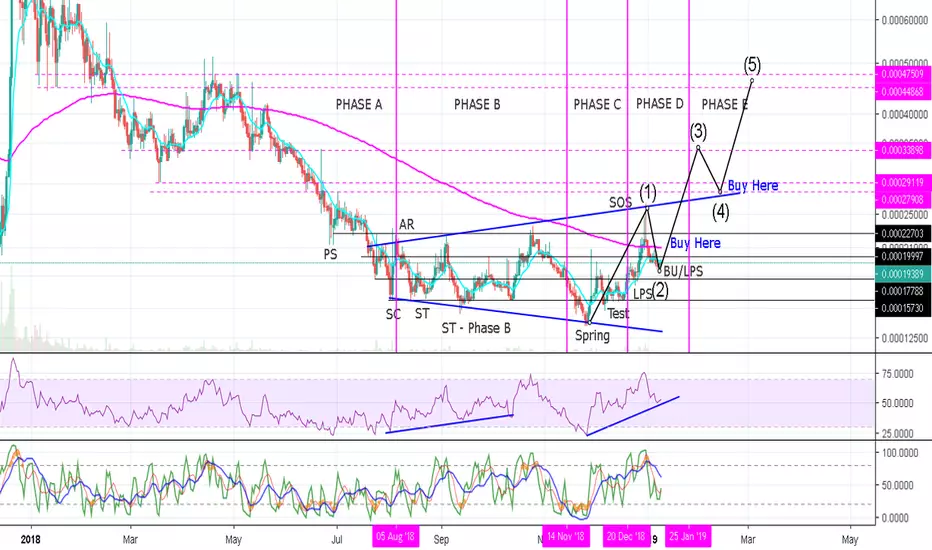
Komodo ($KMD) Wyckoff Accumulation AnalysisHi friends! Welcome to Poop's Wyckoff Analysis on Komodo.
Ever since I learned about Wyckoff Method, I began to include it in my trend trading strategy for the simple reason that it is among the best tools a trend trade could use to spot bottoms and top formation. Today I'm showing you how it looks on $KMD Chart and hopefully aid you in your trading.
$KMD is on a slight variation Wyckoff Schematic -2, That looks like a broadening wedge bottom, specifically its already at its Phase D on Wyckoff Events and Phases.
It of began to show signs of forming accumulation on an broadening wedge bottom on Aug 22 last year specifically on the Secondary Test on wyckoff events after a correction from the point of Automatic Rally . This is the point where I began to follow its progress.
Currently, it is sitting at the Back UP or the Last Point of Supply after it has corrected from its recent top which was a Sign of Strength in the Wychoff Events. This point is coincides with the end of wave 2 (Elliot Wave Count) a buy opportunity to take advantage of the trend reversal which could potentially give us a 70% mark up . After this target it will likely have a correction that could likely bounce at a resistance turned support (Upper blue line). This will be our second buy opportunity that can give us a target of 65% move .
The entire projected move is around 150% from its current price level.
That's it friends, I looking forward for your comments on this analysis.
A definition of terms on the labels included in the chart is at the bottom, for your appreciation.
This is just a guide, not a trading advise.
Hit like and follow for more chart updates!
Thanks
-Your Wychoff Poop Trader
Definition of Terms Included in the chart label:
PS—preliminary support , where substantial buying begins to provide pronounced support after a prolonged down-move. Volume increases and price spread widens, signaling that the down-move may be approaching its end.
SC—selling climax , the point at which widening spread and selling pressure usually climaxes and heavy or panicky selling by the public is being absorbed by larger professional interests at or near a bottom. Often price will close well off the low in a SC, reflecting the buying by these large interests.
AR—automatic rally , which occurs because intense selling pressure has greatly diminished. A wave of buying easily pushes prices up; this is further fueled by short covering. The high of this rally will help define the upper boundary of an accumulation TR.
ST—secondary test , in which price revisits the area of the SC to test the supply/demand balance at these levels. If a bottom is to be confirmed, volume and price spread should be significantly diminished as the market approaches support in the area of the SC. It is common to have multiple STs after a SC.
Test— Large operators always test the market for supply throughout a TR and at key points during a price advance. If considerable supply emerges on a test, the market is often not ready to be marked up. A spring is often followed by one or more tests; a successful test (indicating that further price increases will follow) typically makes a higher low on lesser volume.
SOS —sign of strength, a price advance on increasing spread and relatively higher volume. Often a SOS takes place after a spring, validating the analyst’s interpretation of that prior action.
LPS —last point of support, the low point of a reaction or pullback after a SOS. Backing up to an LPS means a pullback to support that was formerly resistance, on diminished spread and volume. On some charts, there may be more than one LPS, despite the ostensibly singular precision of this term.
BU—”back-up” . This term is short-hand for a colorful metaphor coined by Robert Evans, one of the leading teachers of the Wyckoff method from the 1930s to the 1960s. Evans analogized the SOS to a “jump across the creek” of price resistance, and the “back up to the creek” represented both short-term profit-taking and a test for additional supply around the area of resistance. A back-up is a common structural element preceding a more substantial price mark-up, and can take on a variety of forms, including a simple pullback or a new TR at a higher level.