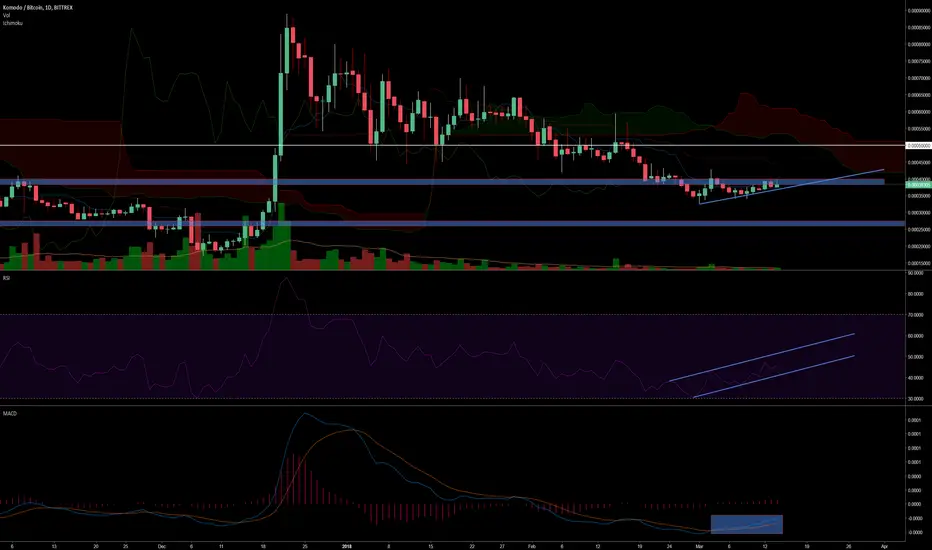
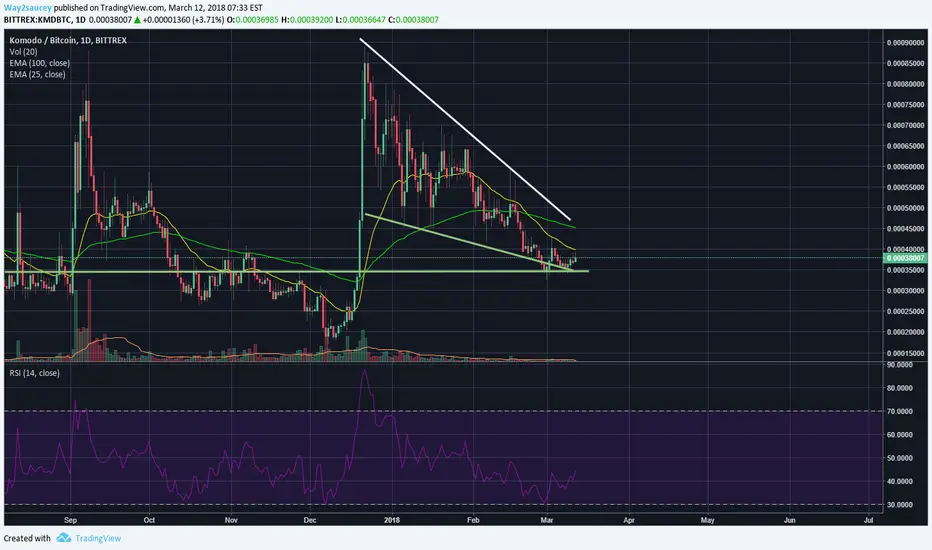
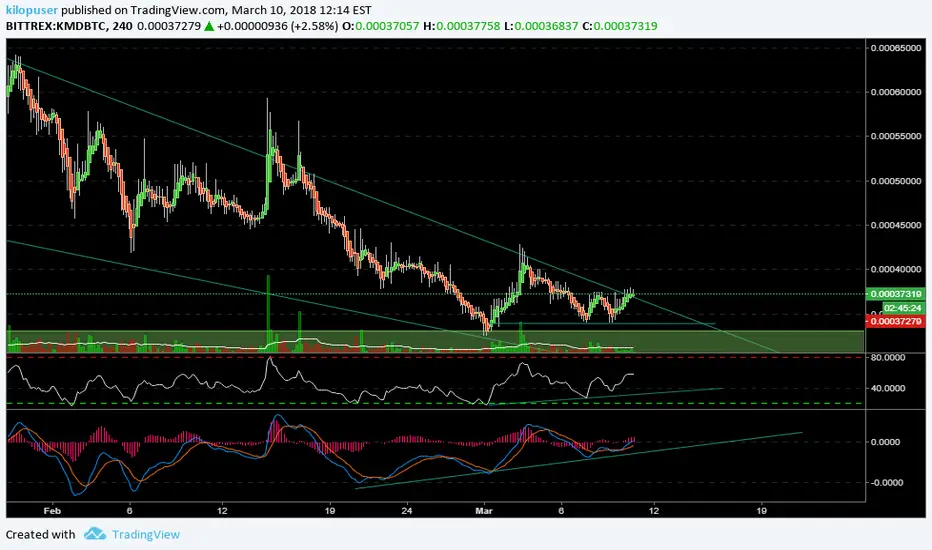
Komodo trending upSeems Komodo has reached it's bottom and is slowly trending up. Looking good for the past few days, on the 4H chart as well. Should hit the 50.000 sats (25% growth) within a week or so. Volume is a bit low but normal considering market conditions. Seems like a perfect buying opportunity right now.
KMDBTC trade ideas
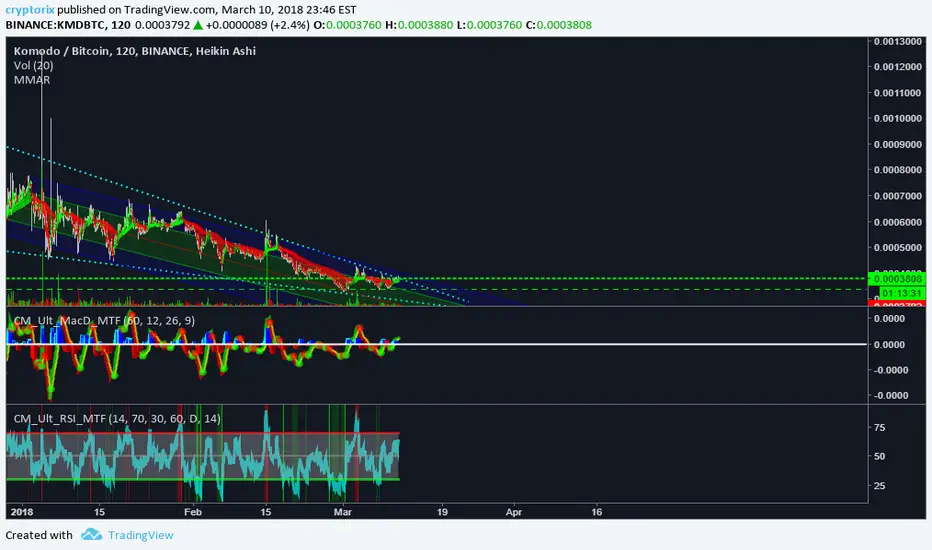
KMD/BTCBullish Cloud forming on 1,2,4 hour charts. Chikouspan is about pass through clouds, Vortex + line has crossed above Vortex - line, RSI seems low, you can make profit on that.

KMDRSI entering oversold area
10 red weekly candles and nearing support - to visit this next week
Have a random buy order at 0.000282 if wants to dip pass the support zone


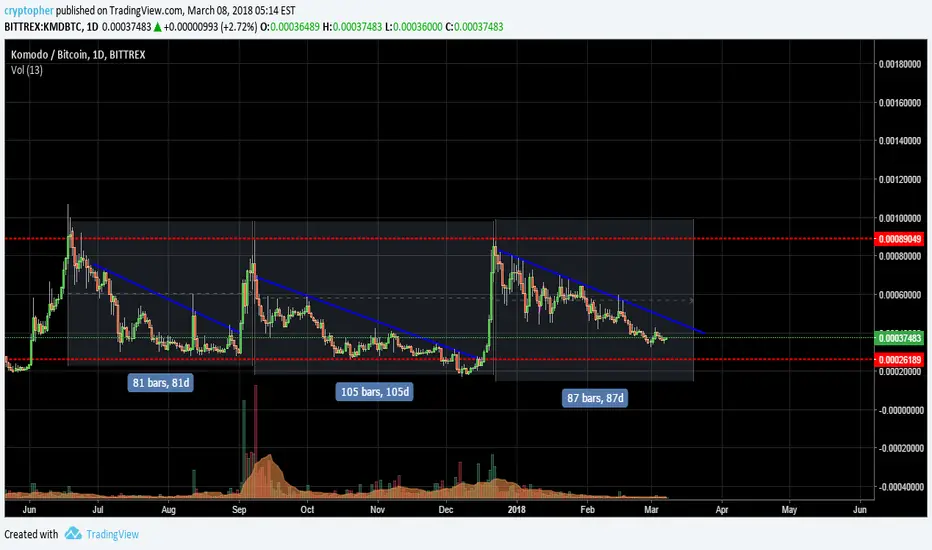
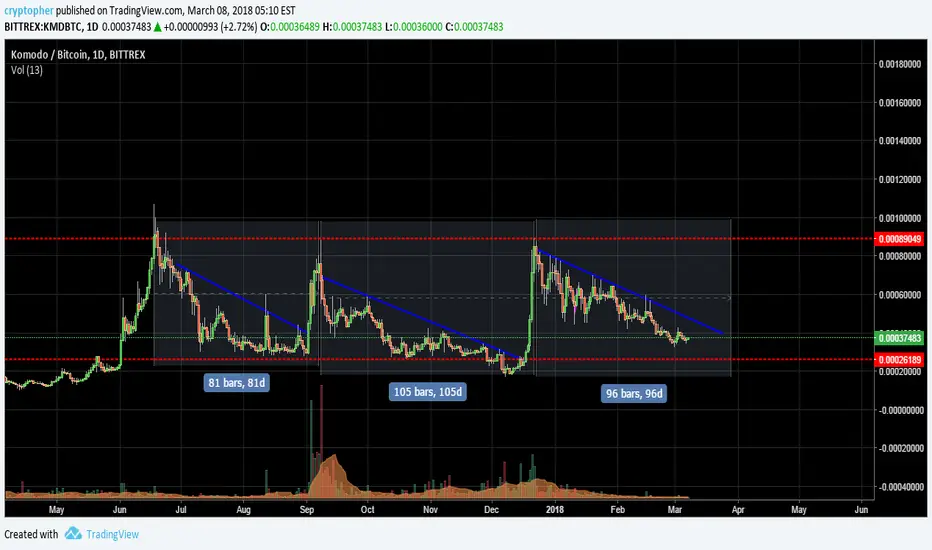
DIGITAL ALPHA Update KMD - Get ready to ride a KOMODO!DIGITAL ALPHA is on a caffeine kick and busting out two scenario charts today. This one was charted by D.A.'s finest "El Sol"!
Today we have Komodo! Great project here. Their BarterDEX is gaining momentum and soon we will see some dICOs (decentralized ICOs) hit their platform, which is why we are keeping our eyes peeled to KMD! So let's get started.
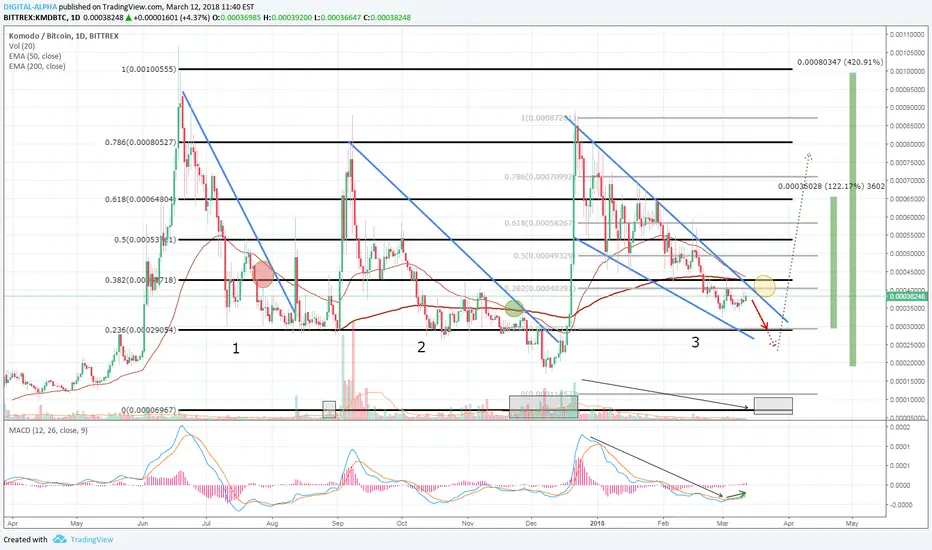
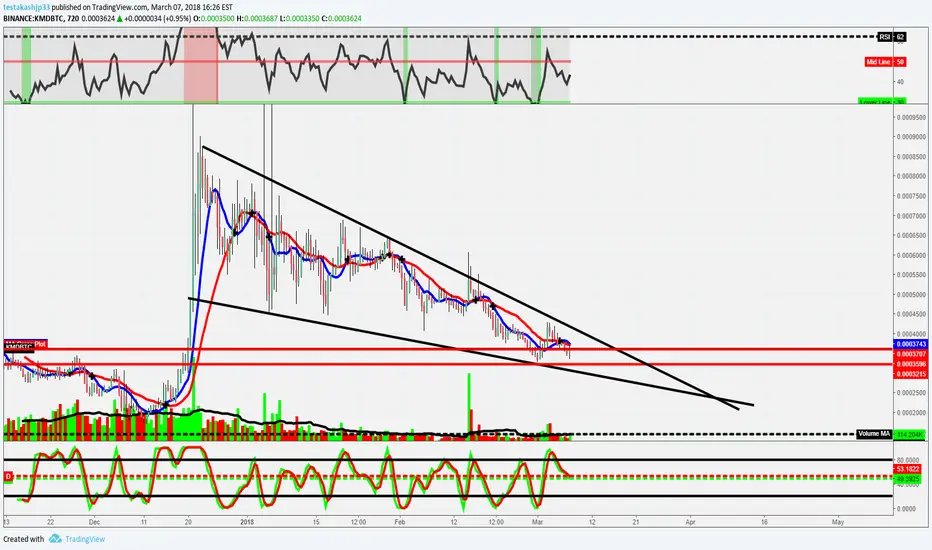
Komodo is in a descending wedge pattern with breakout potential between 122% and 420%. Yes, major discrepancy, but we will explain.
First, notice we have 3 descending wedges on our 1D chart. The first two have broken out and hit a resistance at our 0.786 fib line (0.0008btc). We are now on number 3 and we have not broken out ...yet. There are 3 indicators that need to flash "buy" before we have our breakout. We will look back on the first 2 wedges to explain. So, looking at wedge #3...
1) EMA Crossing (not yet)- We have a yellow circle on wedge #3 highlighting where we might see our 50 and 200 EMAs crossing, which will usually result in a quick downswing...but for us we see it as opportunity! You can see in wedge #2 the breakout happened afterwards and in wedge #1 it was too early for 200EMA.
2) Volume Peaks after a period of low volume (not yet) - Here we are looking great and volume is descending as expected. This is seen with our black arrow on the volume chart. Our MACD indicator looks great as well and has started to turn a little, meaning momentum "might" be starting. We sometimes see the MACD turn before volume starts, so be on the lookout for that. Volume peaked on both Wedge #1 and #2 before the breakout. Also note the MACD here.
3) Upper Resistance Breaking (not yet) - This will be the 3rd indicator we want to see before we buy. Usually the first two indicators (EMA, volume) are both supporting the trend by this point. The upper blue line needs to break before it signals a breakout.
Currently, we see two potentials, The conservative trade would happen during a breakout when price is at 0.0003btc and a potential sell (based on trend based fib lines) at 0.00065btc. If you are more aggressive and buy a dip that usually precedes a breakout AND we revisit ATHs (very possible with BarterDEX and dICOs coming soon) then a visit to 0.001btc levels is possible, which would yield 420% returns.
This is DA, we hope you like our material. Comment below if you want us to highlight any tokens you have an eye on.
- DA Bull
-----
As always - DYOR
Digital Alpha is not a licensed financial planner, financial advisor, stock broker, investment broker, or investment advisor. Before making any trades, check with a financial planner, investment advisor, tax advisor, or anyone else that controls your finances to make sure trading is right for you. The information provided here should not be construed as individual investment advice. All information presented on this site is the opinion of the author only and is not a solicitation to buy, sell, or hold any investment or security of any kind.
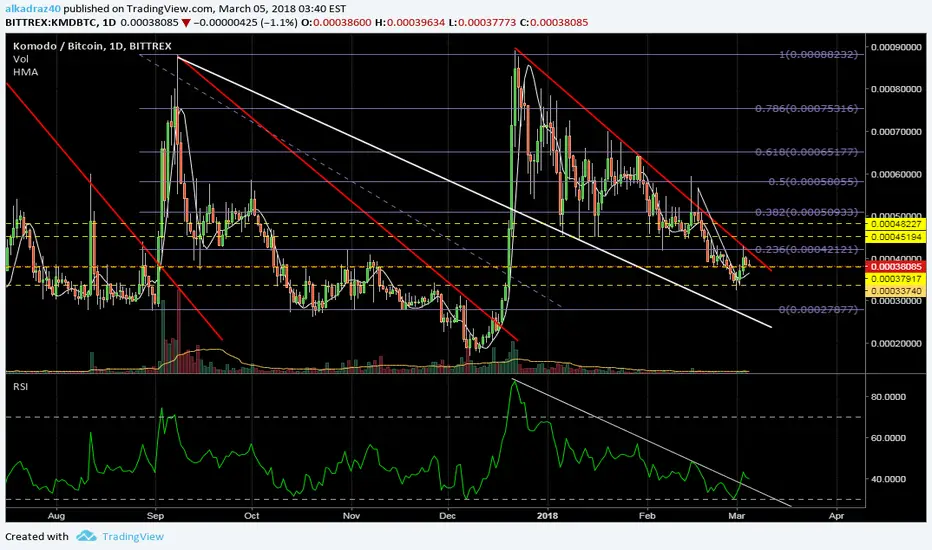
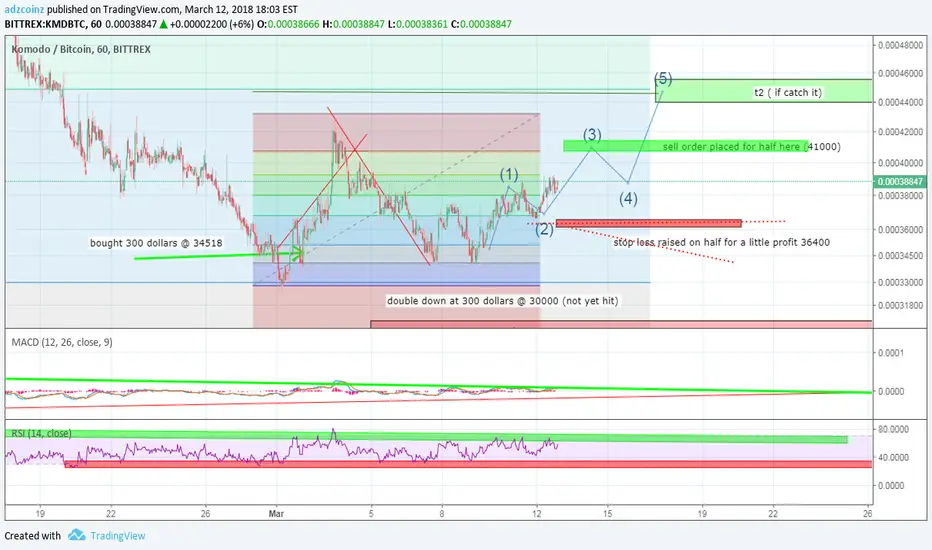
$KMD Falling wedge to support setup. +20%-30% conservativelyFound a safe haven in the 34-35k sats range for support. Could see a play to the mid 40k sat area
If this POS Type coin behaves like NAV and Other POS, up!If this POS Type coin behaves like NAV and Other POS that I've been looking at, then we might be due for a run up!

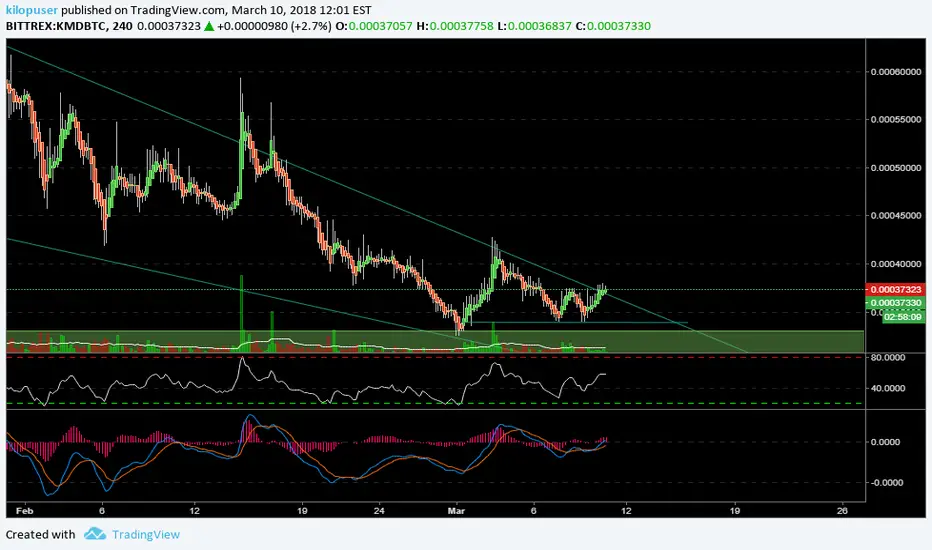
Komodo looking really really good!RSI oversold, MACD blue line just surpassed the orange one, falling wedge and a double bottom formation. I think this is enough, isn't it?
If everything goes as TA shows open a very strong position when it's time and expect huge profits.

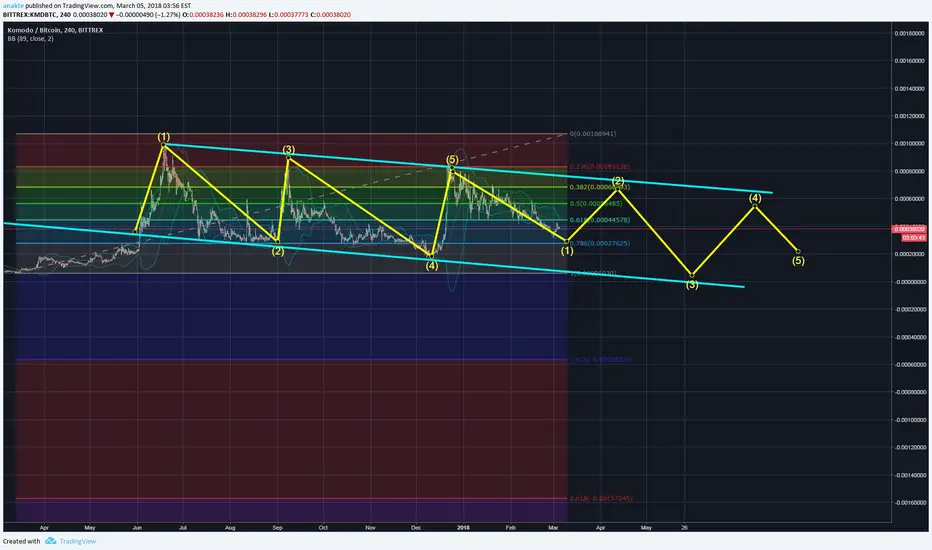
KMD 2H falling wedge breakout?Hey guys, lets directly get into it shall we?
As you can see on the chart, a nice falling wedge has formed and as textbook trading as it is, falling wedge is a continuation pattern that usually bullish, still, i hate the wick on 1-4 and 1-6
im still waiting for it to reach the above resistance line and waiting for its breakout and using my 90 and 100ma as support line
KMD broke uptKMDBTC analyze:
- stable on the last week;
- MACD & RSI bullish;
- broke the down trend some days ago;
- now broke the trend again.
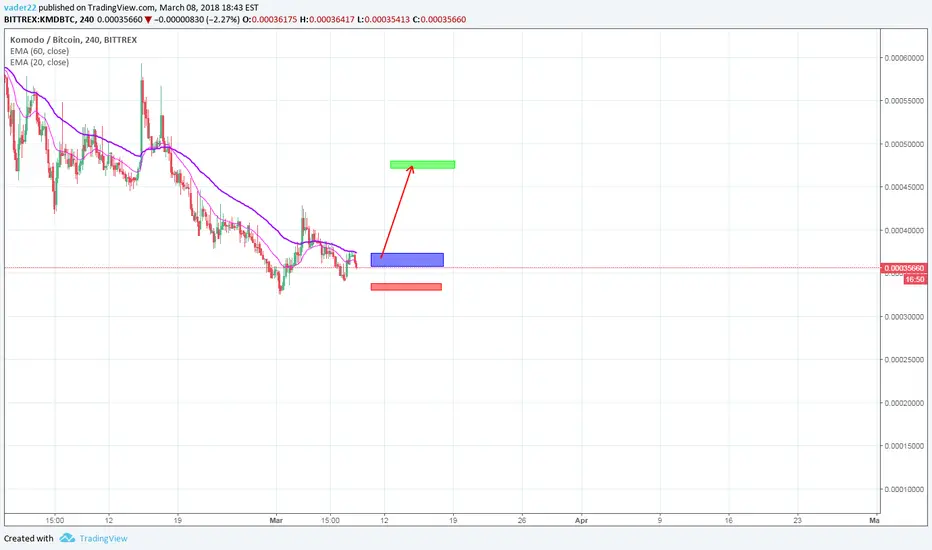
Komodo looks like it may be turning around 123 Bottom formingIt's possible that KMD is turning around it's bearish trend. This is based off the 123 Bottom that appears to be forming. While not concrete, the stop loss, (red box) is relatively tight so presents a moderately low risk trade. Buy zone is blue box with take profit in the green box.
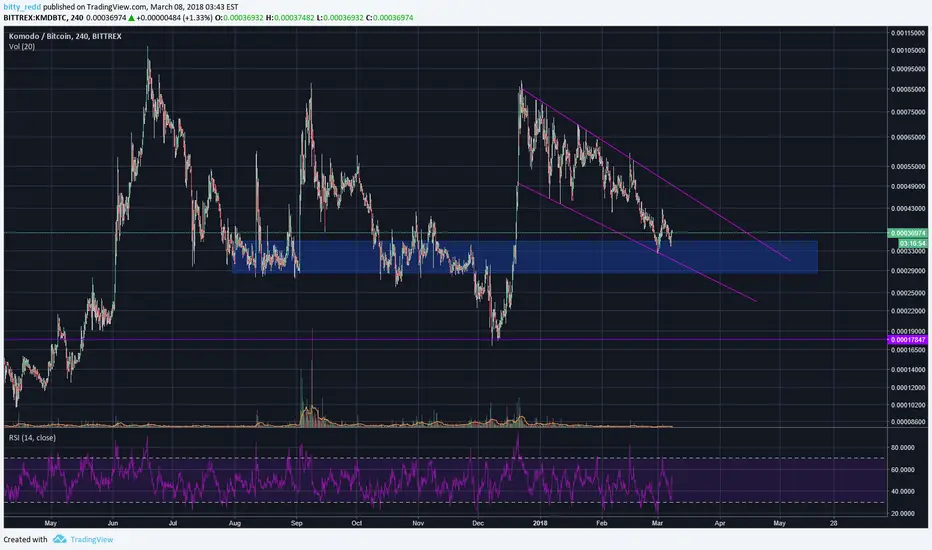
KMD/BTCKomodo is approaching is buy zone in the 33.2-28.2 range. The traders EMA are starting to compress but the inverstors EMA are still expand. So I expect consolidation in that range and I'll wait for the contractions of the Investors EMA before taking any kind of positions to see if the dip is nearing the end or another dip to the other box can be in play. I expect a bounce in that 33-28 range though before a retest of ATH or maybe new ATH we never know. Komodo is a really solid project fundamentally being the first project to do atomic swap between BTC and ERC20 token. New website coming up, new team member, new marketing so pretty neat future in my opinion.

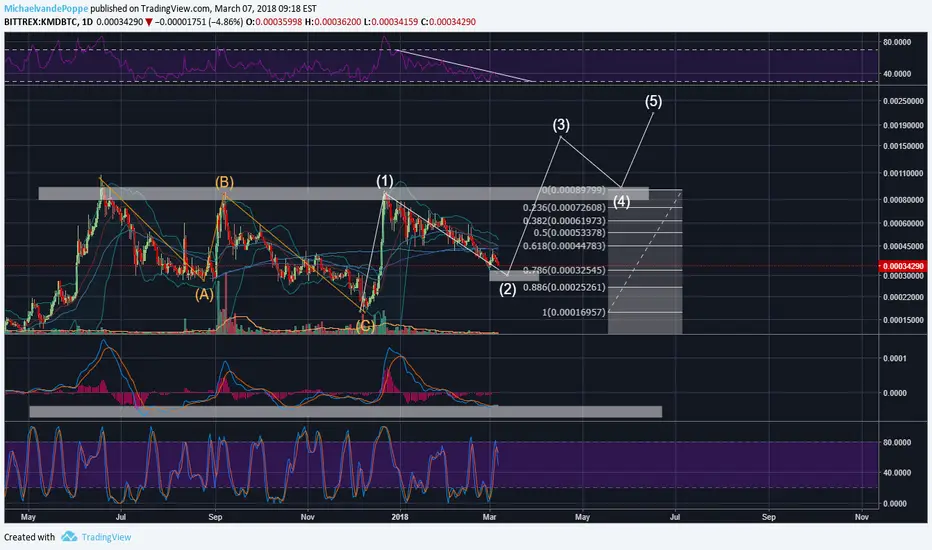
Komodo Trade Idea --> Retracement almost over --> ATH soon? Komodo, one of my favourites, I’d say.
What do we see on the TA from this one?
Well, it seemingly can’t break the 90-100K barrier, as that’s a very strong resistance line over there. Retracing all the way down right now. Made a small jump in the past days, but I'd say we'll be seeing some more retracement towards the indicated box before we'll be heading upwards.
What do we see more?
RSI is on a very low level on the daily, getting in the buy zone. MACD in a negative downtrend, but seemingly about to see the bottom.
I do see an ABC correction from the first run up in 2017. And I do think that we’re starting up new impulse waves from the drop back in December 2017.
What are the targets?
First some more retracement towards the 30K zone.
Then probably around the 150K Sats area for May.