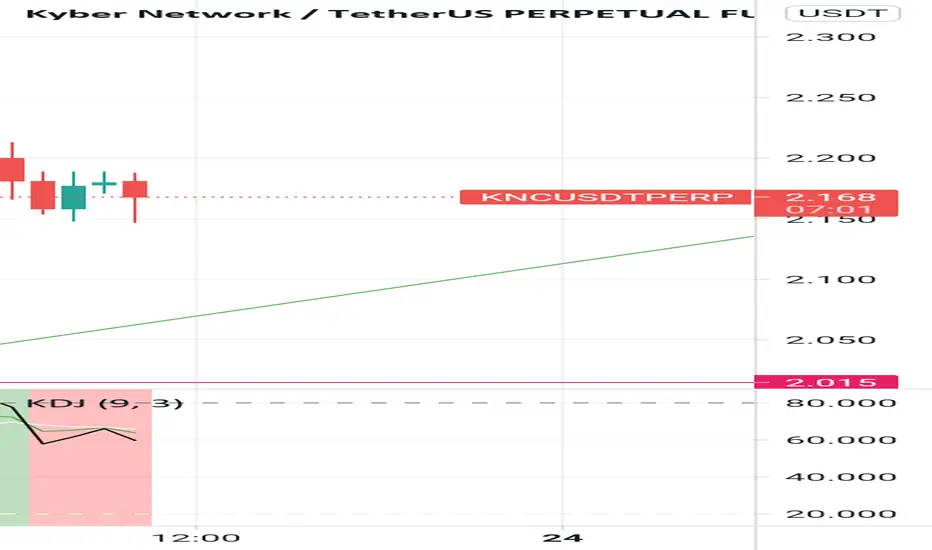
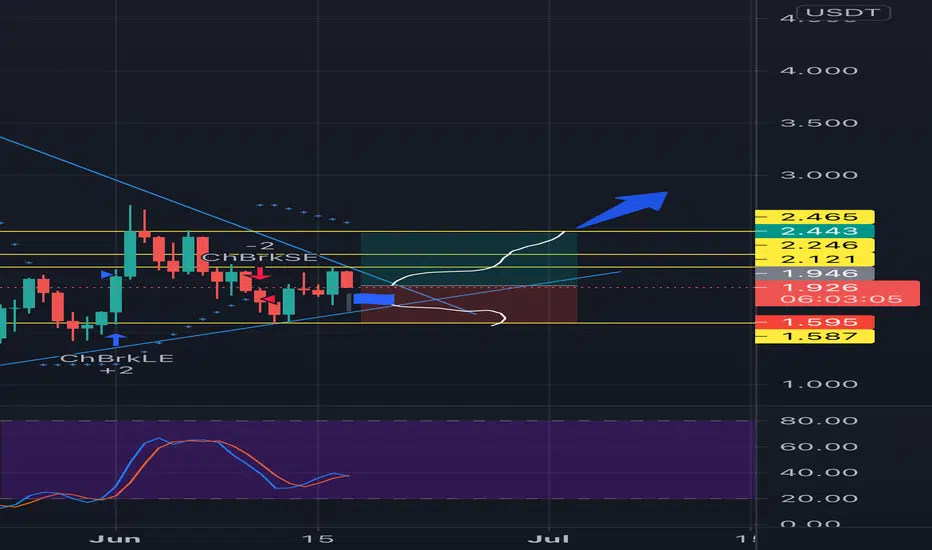
KNC thoughts#KNCUSDT perpetual thoughts.
It looks bullish, but wait for the retracement on the 4H candle to go in
KNCUSDT.P trade ideas
KNC/USDT BUY SIGNALHere we go, the next strong wave on the crypto market. Most likely we have tested the bottom today and now the doors to the upside are wide open.
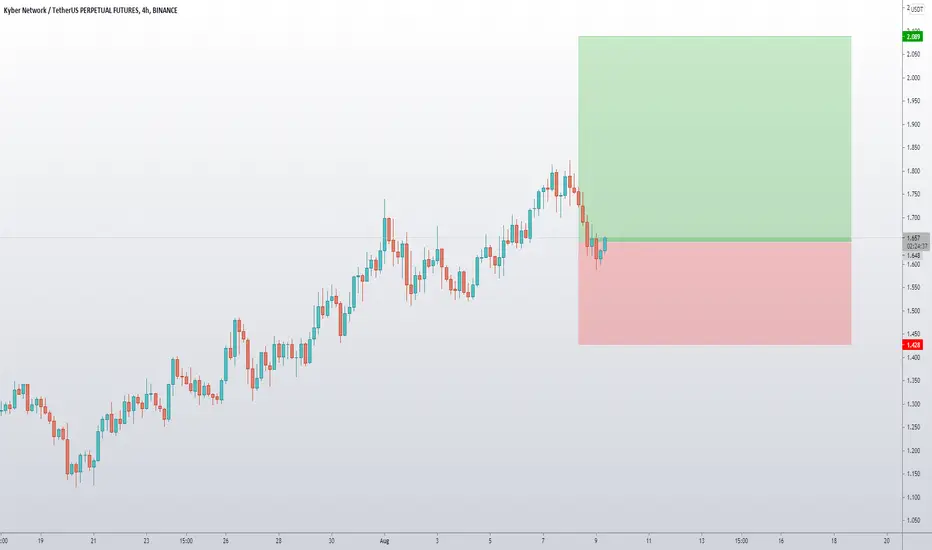
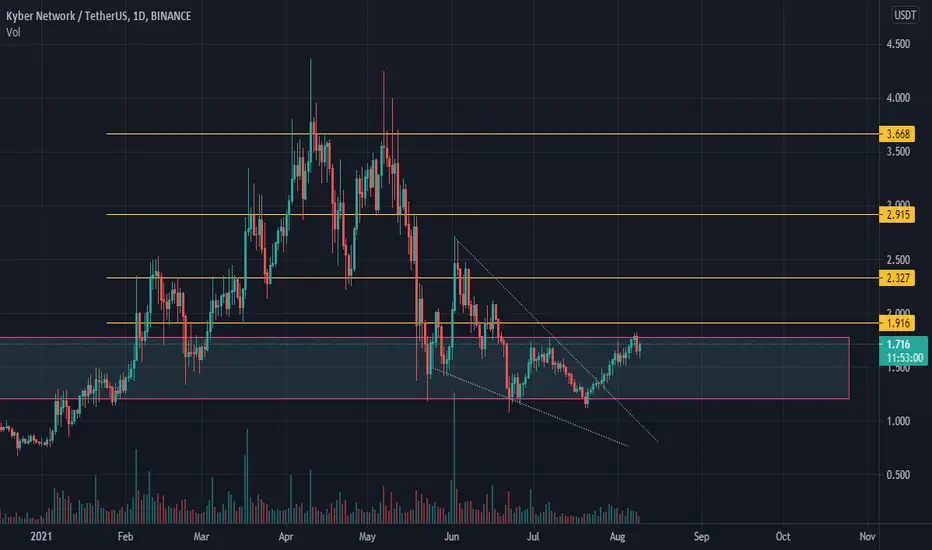
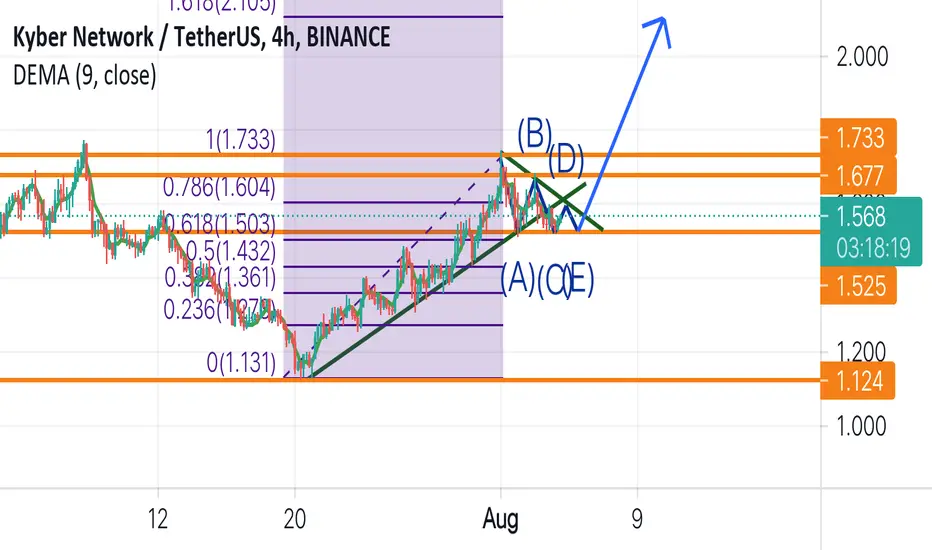
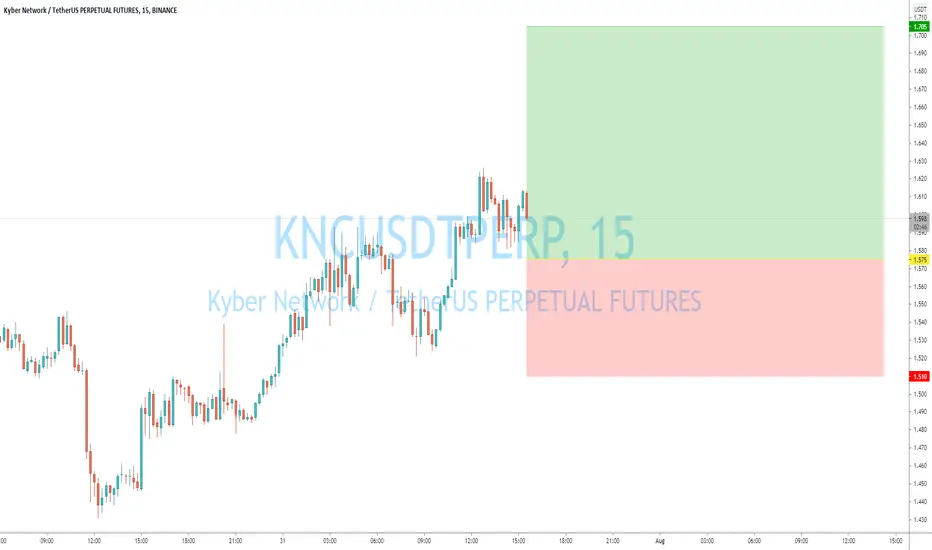
KYBEREntry on continuation, bounce back from the support of fair value (pink area)
Early exit because of possible double top and rejection.
More optimal choice - move stop/loss to the latest HL.
KNC Chase the Beast of DeFiKNC is been ranging very well i know it's keep lagging in price action but this time it may be different hopefully
Defi beast is ready i bet
KNC flying highRisk warning, disclaimer: the above is a personal market judgment based on published information and historical chart data on Tradingview, all analysis is only subjective. Hope investors consider, I am not responsible for your investment decision. Thank you.
Good luck
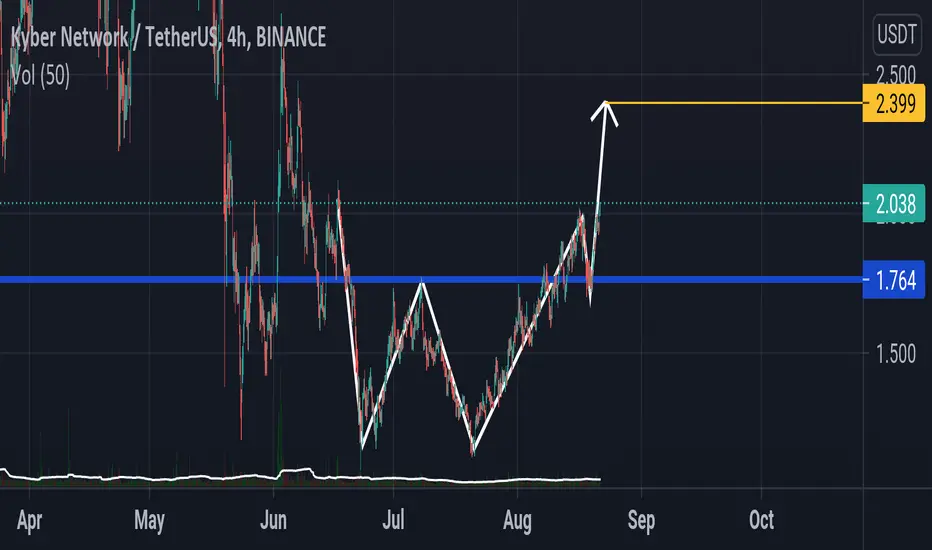
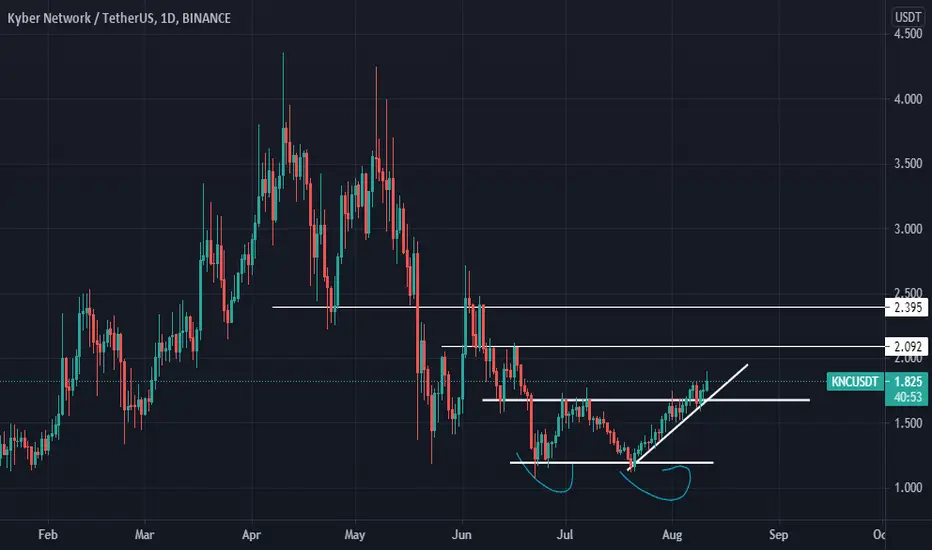
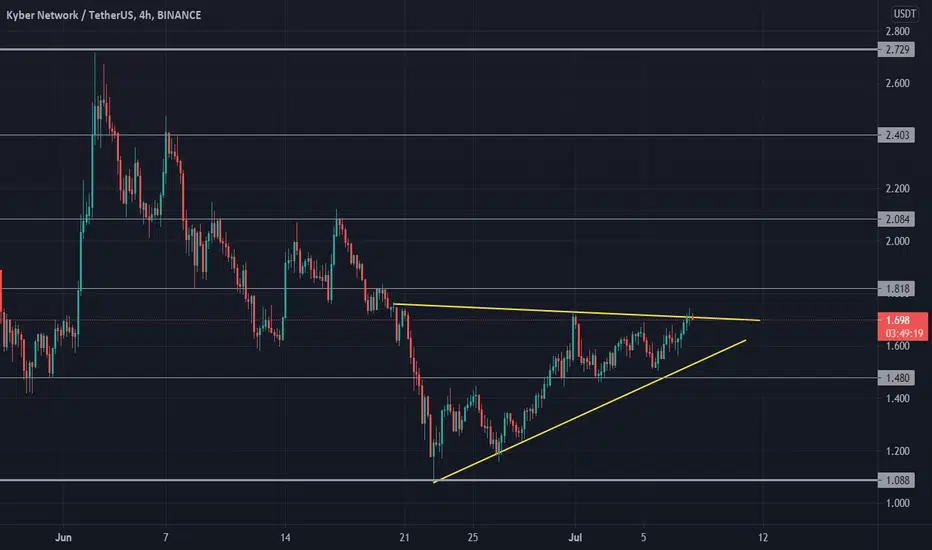
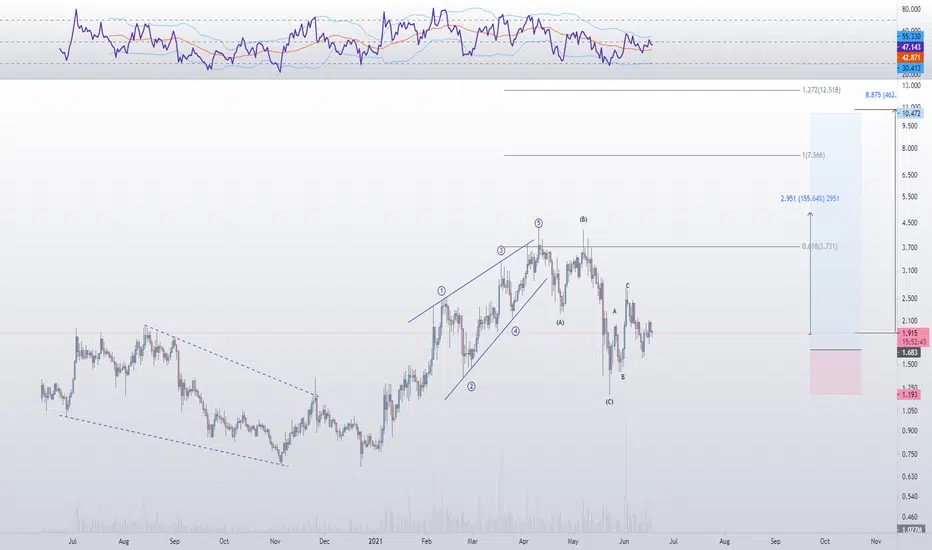
KNCUSDTWe can see that KNC made double bottom and then broke the resistance line. Now it is heading towards mentioned potential Target points.
Enjoy the trade
KNCUSDT long Risk warning, disclaimer: the above is a personal market judgment based on published information and historical chart data on Tradingview, all analysis is only subjective. Hope investors consider, I am not responsible for your investment decision. Thank you.
Good luck!
KNCUSDT 1D TFKNCUSDT has broken the neckline of double bottom and currently retesting and facing resistance of EMA 89. Also moving in a channel, can show a good momentum after a successful retest.
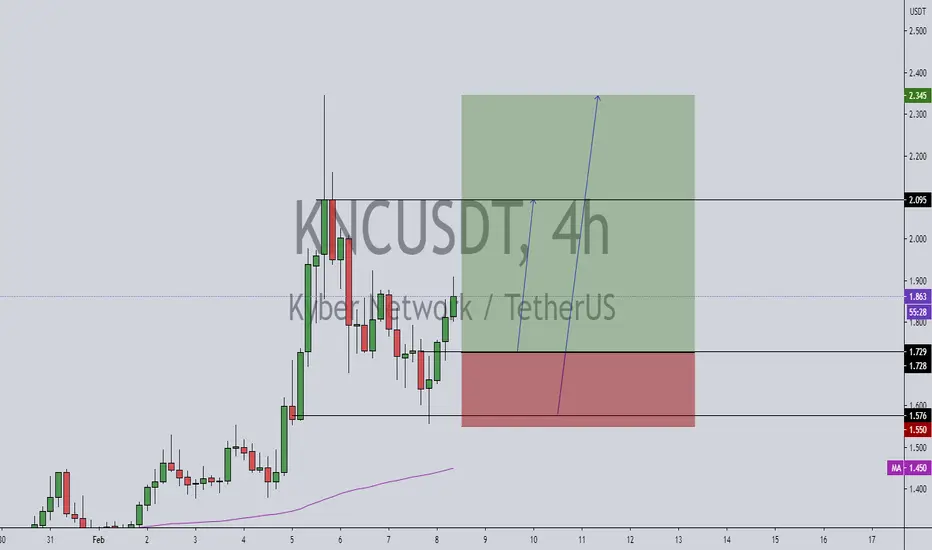
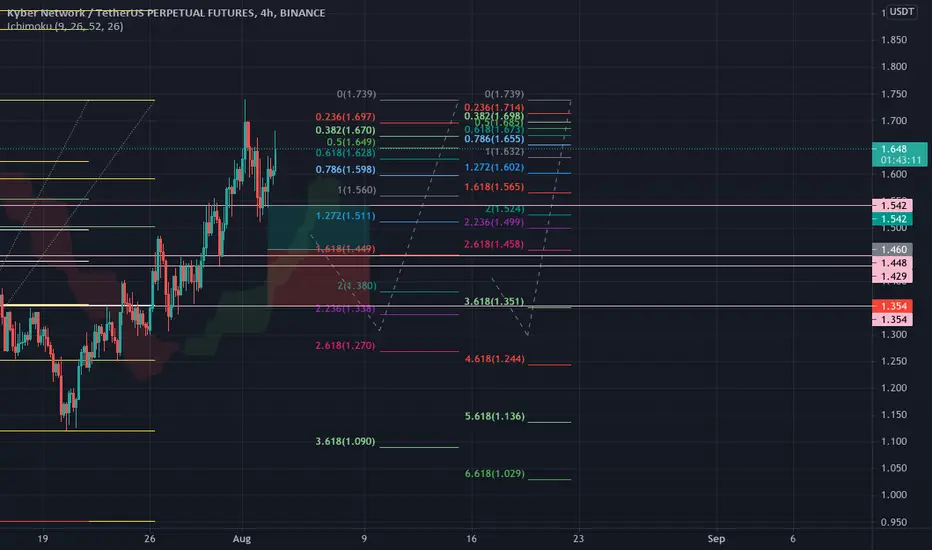
KNCUSDTPER-LONG1. BUYING ZONE : 1.429-1460.
2. TAKEPROFIT : 1.542.
3. STOP-LOSS :1.354.
4. Leverage : 3x-5x
***MINERAL SCALE INVESTMENT***
***VIKTORTEA***
🆓Kyber Network Crystal v2 (KNC) July-31 #KNC $KNCKNC has conquered the $1.50 zone and is moving towards the 1.8 and 2.3$ zone this August. If it loses the $1.50 zone, then the $1.30 zone is still a reliable support
📈BUY
🔴Buy : 1.46-1.54$. SL if B
🔴Buy : 1.76-1.84$ if A. SL if B
📉SELL
🔴Sell : 1.76-1.84$. SL if A
🔴Sell : 2.25-2.35$. SL if A
♻️BACK-UP
🔵Buy : 1.27-1.33$. SL if B
❓Details
🕯Timeframe : 1 Day
📈Red Arrow : Main Direction as BUY and SELL section
📉Blue Arrow : Back-Up Direction as BACK-UP section
🟩Green zone : Support zone as BUY section
🟥Red zone : Resistance zone as SELL section
🅰️A : The Close price of candlestick is Above the zone
🅱️B : The Close price of candlestick is Below the zone

KNCUSDT Will Go Up After the Pullback
Welcome back Traders, Investors, and Community!
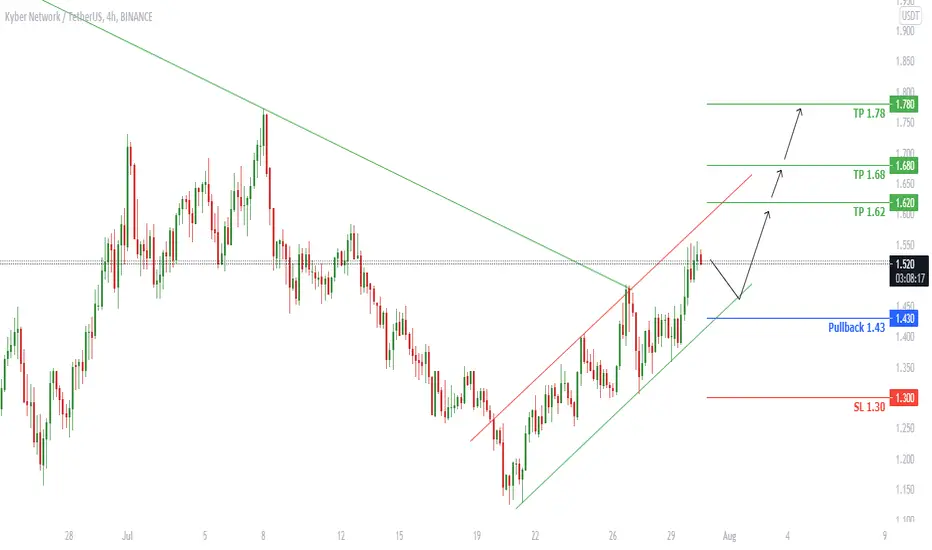
Hi Traders, KNCUSDT On H4 is in the Bullish channel, It seems that it’s going to have a Pullback before it goes up
⬆️Buy now or Buy at 1.43
⭕️SL at 1.30
✅TP1 @ 1.62
✅TP2 @ 1.68
✅TP3 @ 1.78
We will have more FREE forecasts in TradingView soon
❤️ Your Support is really appreciated!❤️
Have a Profitable Day

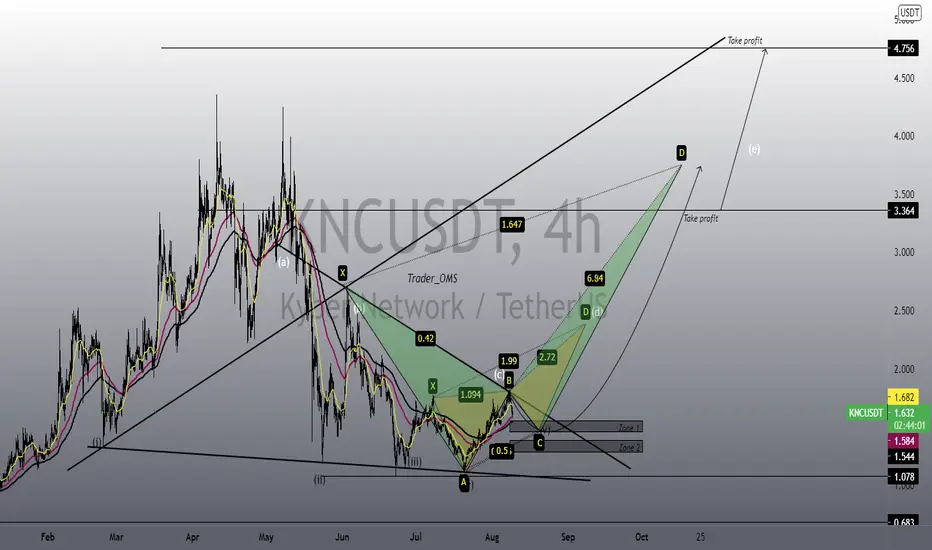
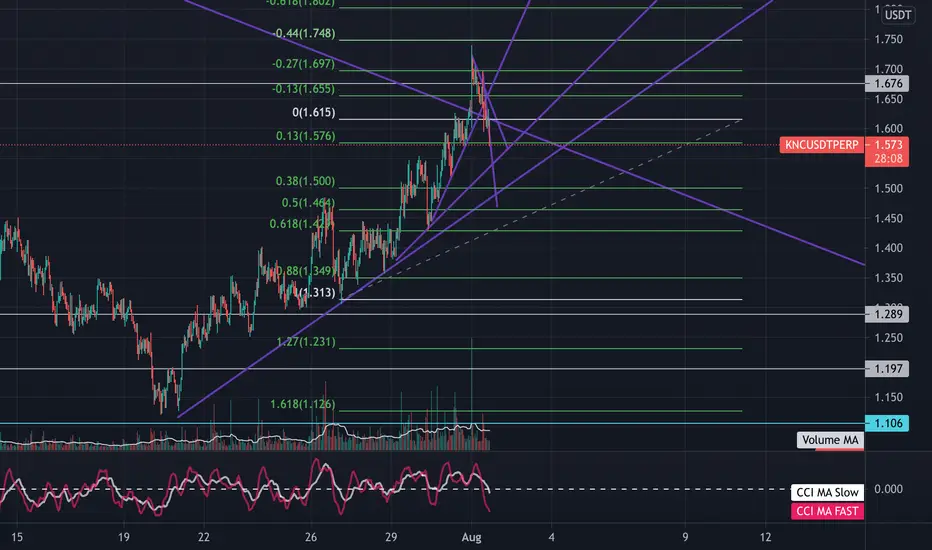
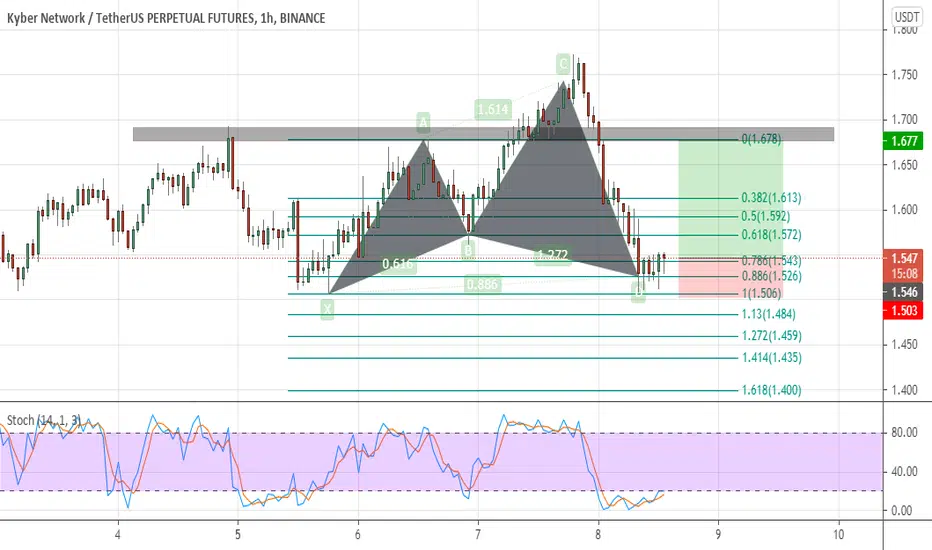
RR=3 buy ideabullish shark pattern + stochastic at oversold zone + doji = price may retest the 1.677 level
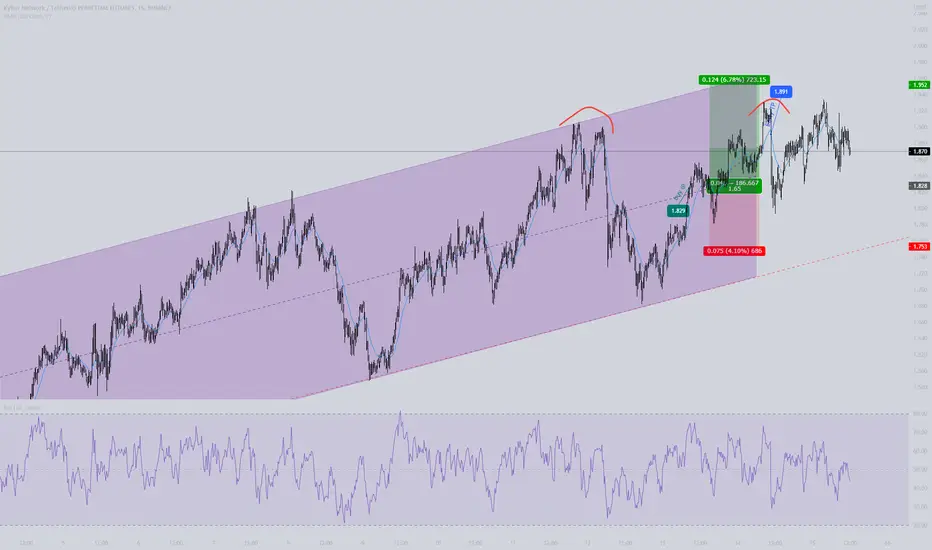
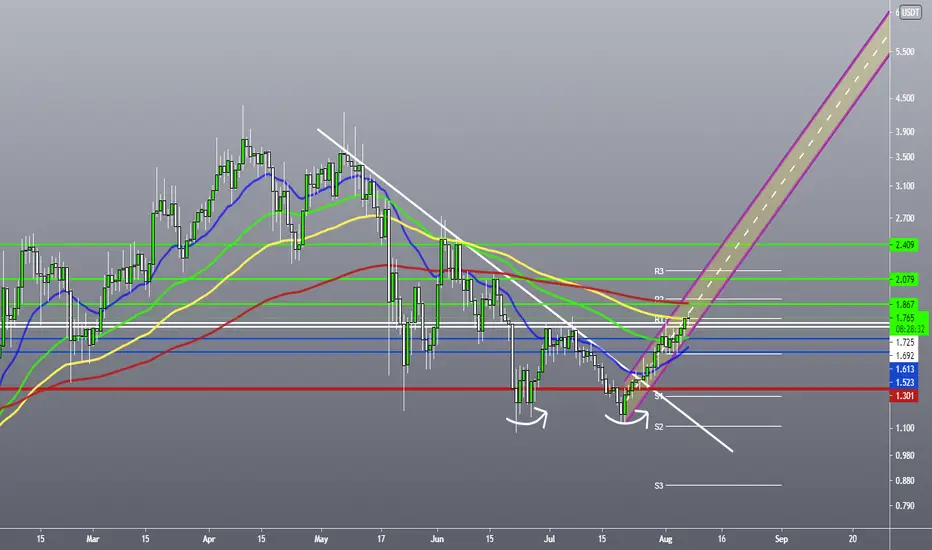
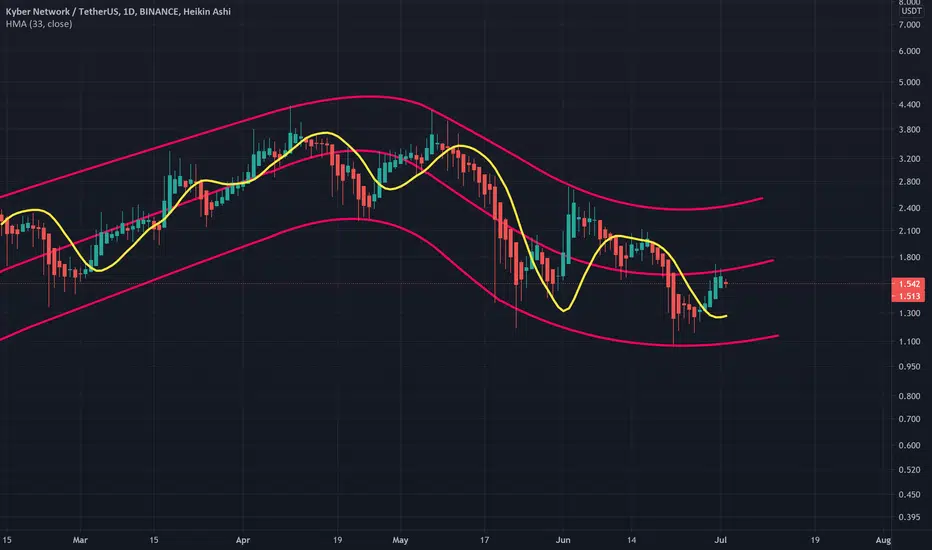
KNC Channel with Upper and Lower limitsThis is a curved projection channel created upon a bounding box. For the creation of the chart, we use 3 "moving averages" that cover the center, upper and lower boundaries for potential movement. Even if this not an attempt to forecast a trend or future scenario, it allows to have an easy to read view of probable limits.
Just sharing my personal charts for learning purposes only. This is not an investment recommendation.
KNCGrayscale Investments updating this list with 13 additional assets: Polygon (MATIC), Solana (SOL), 1inch (1INCH), Bancor (BNT), Curve (CRV), Internet Computer (ICP), Kava (KAVA), Kyber Network (KNC), Loopring (LRC), NEAR (NEAR), Ren (REN), UMA (UMA), and 0x (ZRX).
KNCUSDTHello to you all. Mars Signals team wishes you high profits at all times.
We are in a time frame of 4 hours. The price starts to fluctuate inside a flag. We have drawn a support line for you. If you lose that resistance, we consider it more likely to fall. But if the channel is broken, it can close higher targets. We can sell on the canal roof and watch the market.
Warning: This is just a suggestion to you and we do not guarantee profits.
Wish you luck!
