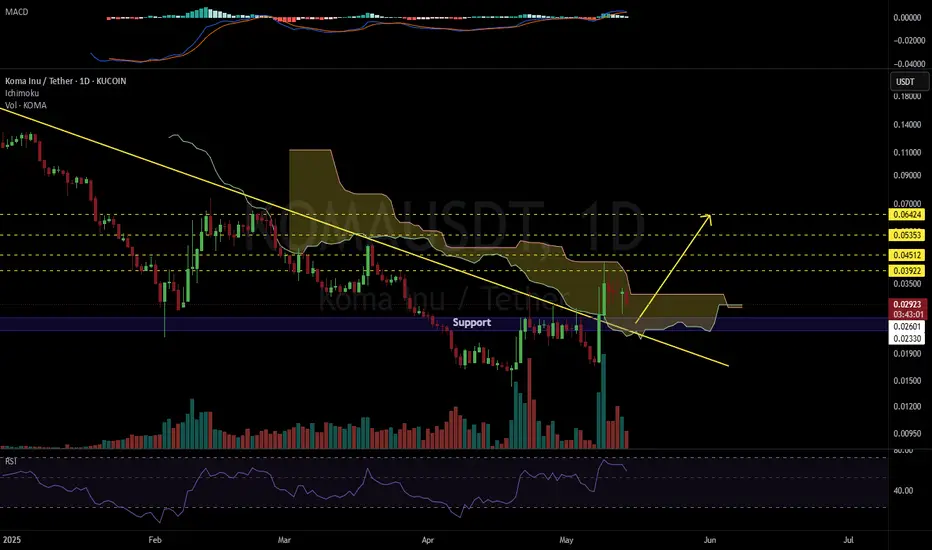
KOMAUSDT 1D#KOMA has broken above the descending resistance on the daily chart. It even entered the Ichimoku cloud but hasn’t been able to break out of it yet and is currently moving inside the cloud. Consider buying some #KOMA between $0.02601 and $0.02330.
In case of a breakout above the Ichimoku cloud, the
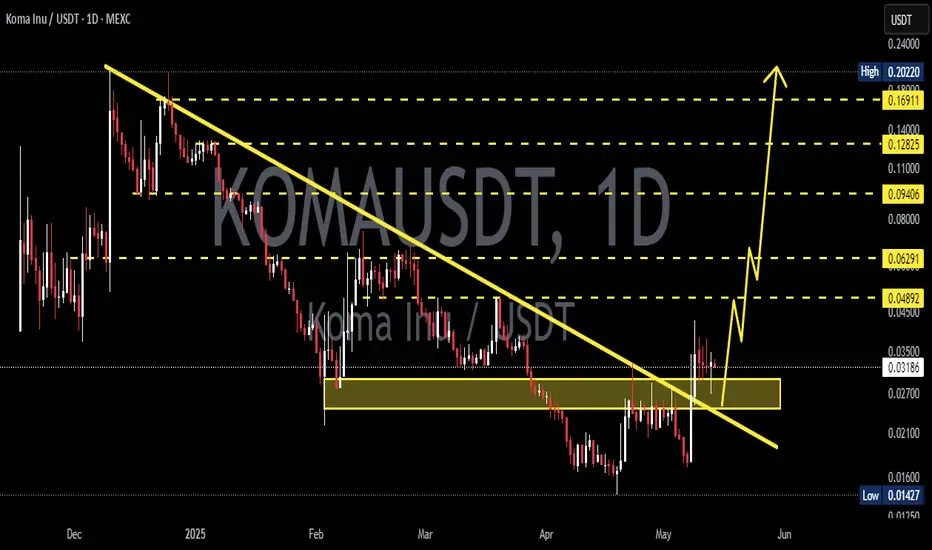
KOMAUSDT 1D Analysis KOMA ~ 1D Analysis
#KOMA di This trade is very high risk
Buy gradually on this support block with a short-term target of at least 10%++
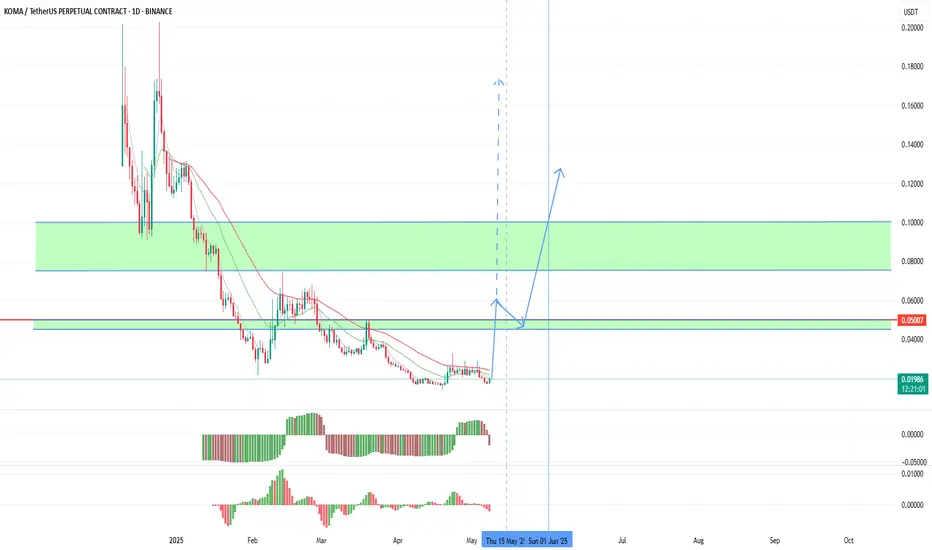
Good KOMA growth potentialAt the end of last week, I recommended keeping KOMA memcoin in mind as having a very high growth potential, as it is only at the development stage. Against the background of a new wave of growth in the second half of this week, we can expect much stronger growth. The minimum goal is to consolidate a
KOMAUSDT CHART ANALYSİS - EDUCATIONAL POSTHow NFT Technology Developed
NFT technology was created in 2017 based on Ethereum smart contracts. Since then, we have witnessed many successful NFT projects and deals. Stories like these perfectly describe the current and future possibilities of the technology.
The development of blockchain tech

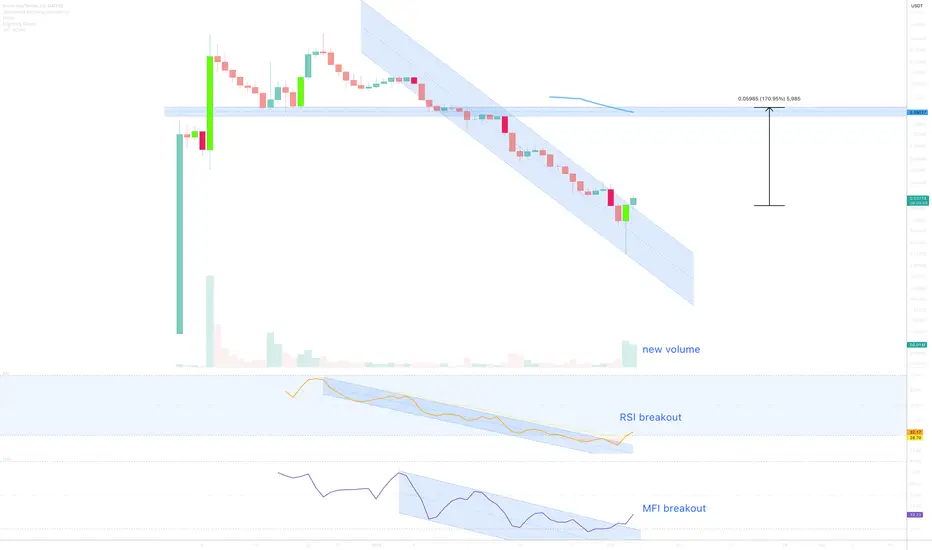
170% rally for Koma INU ??Requested TA, more than once.
On the above daily chart price action has dropped over 80% since early December. A number of reasons now exist for a long position, they include:
1) Price action and RSI resistance breakouts.
2) Volume, a lot of new volume. See MFI breakout.
3) Reversal / hammer can
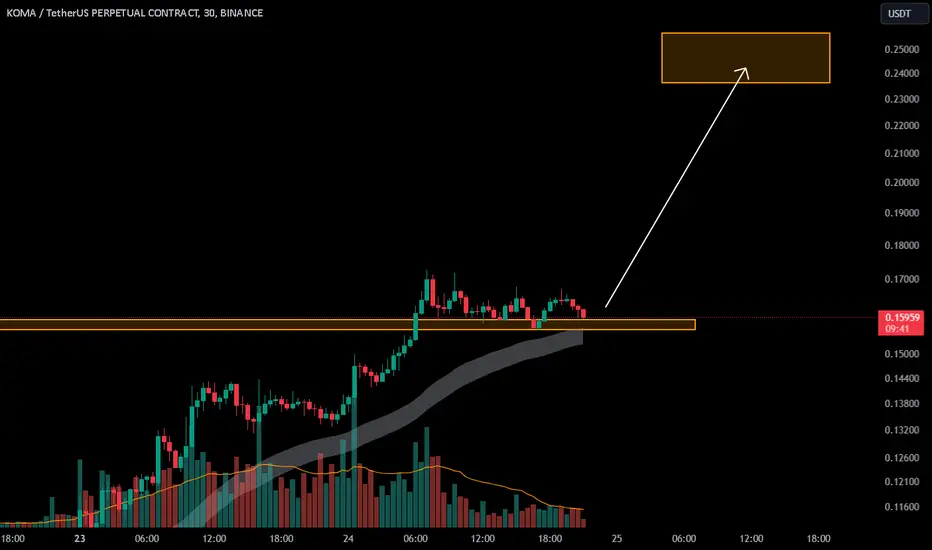
KOMA/USDT Quick Scalp Long On DumpOn this Small Market Correction. We utilising the opportunity to open a small long scalp on meme coin. Let's Try to Print This.

KOMA/USDTKey Level Zone : 0.15617-0.15873
HMT v3.0 detected. The setup looks promising, supported by a previous upward/downward trend with increasing volume and momentum, presenting an excellent reward-to-risk opportunity.
HMT (High Momentum Trending):
HMT is based on trend, momentum, volume, and market st
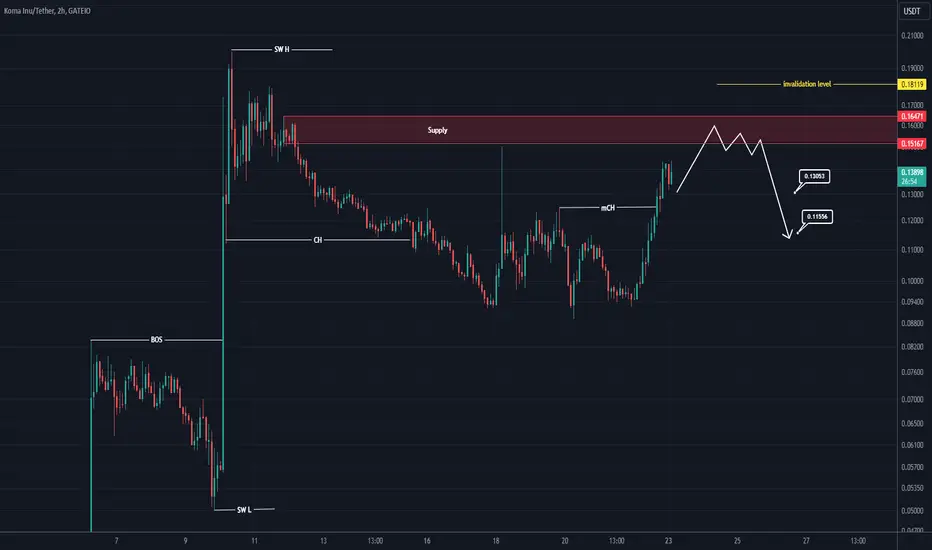
KOMA sell/short setup (2H)KOMA is approaching a supply zone.
Upon reaching this zone, we expect a price rejection.
The targets are listed on the chart.
The closure of a 4-hour candle above the invalidation level will invalidate this analysis.
For risk management, please don't forget stop loss and capital management
Comme
See all ideas
Summarizing what the indicators are suggesting.
Oscillators
Neutral
SellBuy
Strong sellStrong buy
Strong sellSellNeutralBuyStrong buy
Oscillators
Neutral
SellBuy
Strong sellStrong buy
Strong sellSellNeutralBuyStrong buy
Summary
Neutral
SellBuy
Strong sellStrong buy
Strong sellSellNeutralBuyStrong buy
Summary
Neutral
SellBuy
Strong sellStrong buy
Strong sellSellNeutralBuyStrong buy
Summary
Neutral
SellBuy
Strong sellStrong buy
Strong sellSellNeutralBuyStrong buy
Moving Averages
Neutral
SellBuy
Strong sellStrong buy
Strong sellSellNeutralBuyStrong buy
Moving Averages
Neutral
SellBuy
Strong sellStrong buy
Strong sellSellNeutralBuyStrong buy
Displays a symbol's price movements over previous years to identify recurring trends.