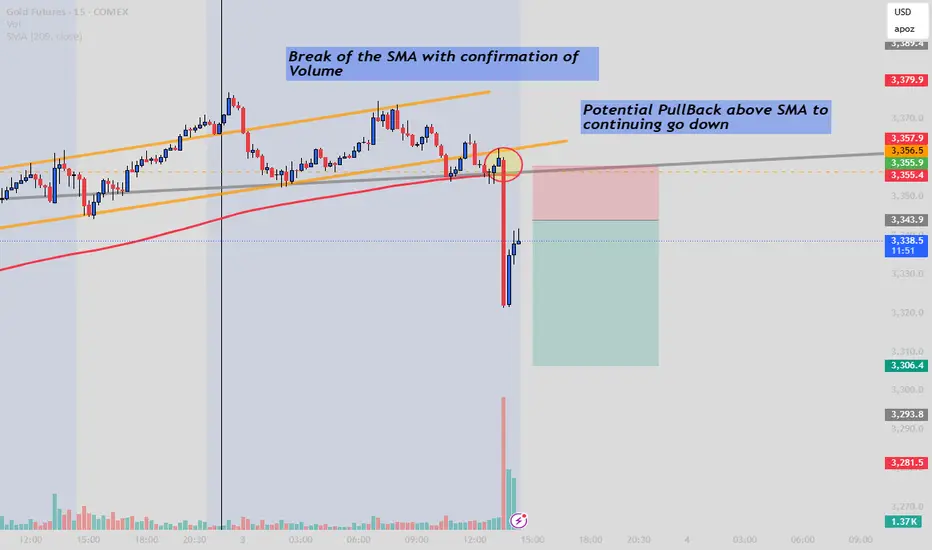
Gold Futures BOS does Bearish move might steps in?There is a breakout of the EMA with confirmation of rising Volume, which indicate a strong short position also with NFP shows strong job claims that's why we anticipated a fall in gold, especially for those who want to enter lastly you should consider waiting for a pullback to catch the second move. Follow GoldenZoneFX For more content and valuable insights.
KGD1! trade ideas
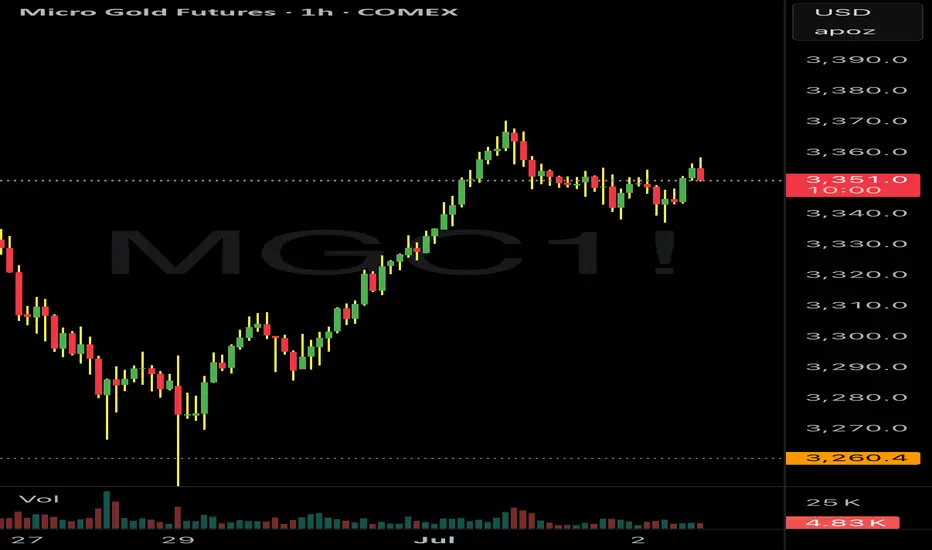
Buying the Dip or Catching a Knife? My Gold Setup Explained.Entered a long position on XAU/USD from the 1H demand zone following sharp intraday selling into a key support level. With gold hovering near $3,300 and a significant testimony from Fed Chair Powell on deck, the setup aligns with both technical rebound potential and fundamental uncertainty that could fuel upside.
The goal here is to play the liquidity vacuum left after aggressive positioning was cleared, with tight invalidation and asymmetric reward.
Technicals:
• Entry aligned with prior price inefficiency and confluence of multiple demand zones
• 1H structure shows clear deviation below the range with immediate buy-side response
• EMA channel flattening, indicating potential compression ahead of expansion
• First target: $3,352
• Risk-managed with defined stop-loss below $3,260
Execution Note: This is not a “hold forever” trade. It’s an opportunistic reaction to unwind + sentiment imbalance.
Fundamentals
• Gold saw a 25% surge in 2024 due to safe-haven demand and dovish policy, but enters 2025 under pressure from:
▫️ A strong USD
▫️ Higher cost of carry
▫️ Speculators taking profit
• Fed policy remains the core variable:
▫️ A hawkish tone from Powell could weigh on price
▫️ Rate cuts would likely revive bullish momentum
• Central bank demand remains supportive
• Geopolitical tensions (Russia-Ukraine, Israel-Iran) could trigger safe-haven bids again.
Bearish headwinds:
• Waning bullish momentum per RSI divergence
• Reduced rate cut expectations post-election
• Powell’s testimony could revive volatility either way.
This is a short-term tactical long, not a macro bet. With sentiment temporarily overextended and key support defended intraday, this is a high R/R window to exploit Powell-related volatility.
Let’s see how price reacts into $3,350+. Any sustained strength there would open room toward $3,400, while failure would confirm a retest of $3,260s.
Note: Please remember to adjust this trade idea according to your individual trading conditions, including position size, broker-specific price variations, and any relevant external factors. Every trader’s situation is unique, so it’s crucial to tailor your approach to your own risk tolerance and market environment.
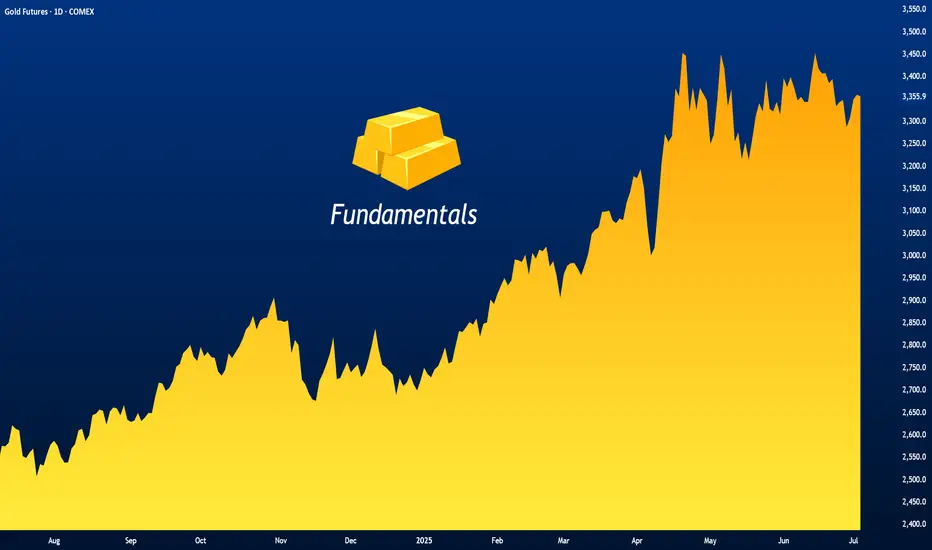
Gold May Find Support From These Various FactorsGold May Find Support Amid Concerns Over U.S. Debt Sustainability, Economic Weakness, and Renewed Geopolitical Tensions
Gold prices are holding steady today, near $1,353 per ounce in spot trading, in what is expected to be a low-liquidity session due to the early closure of U.S. markets. This follows three consecutive days of gains.
The yellow metal’s subdued movement comes as markets await key labor market data that may offer further insight into the health of the U.S. economy, especially after the recent shock from ADP figures.
Gold continues to find support from several underlying factors that could sustain its upward trend this week. These include rising uncertainty around the long-term sustainability of U.S. public finances and the risk of renewed conflict in the Middle East.
Concerns over U.S. fiscal stability have intensified following the introduction of the “One Big Beautiful Bill Act,” which combines tax cuts with spending reductions. In an opinion article for The New York Times , former Treasury Secretaries Robert Rubin and Lawrence Summers warn of the bill’s potentially severe consequences, including persistently high interest rates, reduced business confidence, falling investment, and the risk of a financial shock that markets may struggle to absorb. This could also leave the economy more vulnerable to economic and geopolitical threats.
Such risks may erode investor confidence in U.S. government debt, potentially boosting gold’s appeal as a safe-haven asset even in an environment of elevated bond yields and prolonged high interest rates.
On the geopolitical front, the specter of renewed escalation in the Middle East looms, and this time, the consequences could be more severe. Amid conflicting reports and statements regarding the extent of the damage to Iran’s nuclear facilities, both sides appear to be preparing for the possibility of renewed hostilities.
Diplomatic efforts remain stalled, and hardline voices continue to call for a return to conflict. In an opinion piece for The New York Times, former National Security Advisor John Bolton described negotiations with Iran as ineffective and dangerous, calling instead for regime change and the use of force.
While previous rounds of conflict have not caused lasting damage to the global economy or energy supply chains, a new round may prove more disruptive. According to Reuters , Iran has reportedly loaded naval mines onto vessels, raising fears that it may attempt to close the Strait of Hormuz.
Such a move would cross a critical threshold and turning a contained conflict into one with global economic implications. The Strait of Hormuz handles over one-fifth of the world’s crude oil and liquefied natural gas exports.
However, Iran may avoid this step as long as its own oil exports continue flowing through the strait, as was the case during the last conflict in June.
On the trade front, there is growing optimism about the potential for new agreements that could ease tensions that have disrupted global supply chains and threatened U.S. and global economic growth. This optimism follows President Trump’s announcement of a trade deal with Vietnam.
There is also hope that progress can be made with China. Recent reciprocal steps, that involve the easing of restrictions on rare earth exports by China and some relaxation of U.S. technology export controls, suggest that the de-escalation agreed upon earlier in Switzerland could hold, potentially laying the groundwork for a broader trade agreement.
Samer Hasn
Gold is Pushing Bullish but is it really ready???This looks like a early move to move full on bullish. I feel like it might need to sweep the low from mid week before they really ready to go bullish. waiting for things to show a bit more clear during the Kill Zone.

Gold back to $3300 - Week of July 4thPretty clear cut and dry, we have a significant mark down followed by a pump overnight.
Today and into tomorrow I’m looking for a drop back to the $3300 levels.
Short GC futures at 3,290.Strategy: Short GC futures at 3,290.
Entry: 3,290 (near current price, aligning with resistance).
Target: 3,250 (support level, 1.2% downside).
Stop: 3,310 (above resistance to limit risk).
Rationale: Bearish technicals (RSI divergence, declining open interest) and USD strength support a short-term pullback, with US Retail Sales as a potential catalyst.
Gold Update: Possible Triangular Consolidation Before New RallyIt looks like corrective wave 4 is in the making within a large Triangle
3 waves A, B and C already emerged in 3-waves structure
which confirms triangle
Wave D should stay under the top of wave B
Wave E could either touch or break down the support line
It should keep above the valley of wave C
Target area changed higher as this consolidation tends to narrowing within a
contracting triangle.
Lowest target now $3,900
Optimistic target is at $4,300
Breakdown below $3,123 would invalidate the pattern
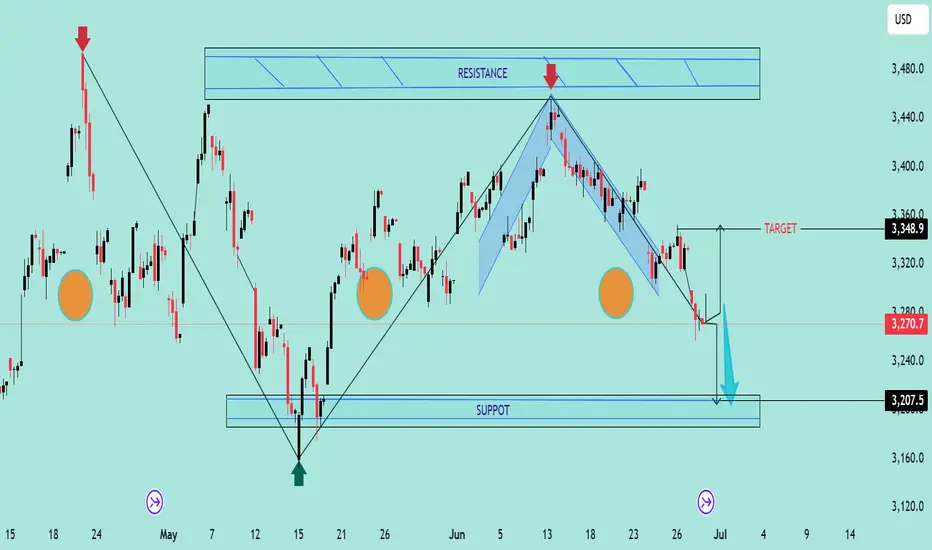
Double Top Breakdown at Resistance ZoneThe chart reveals a classic Double Top pattern formation near the 3,360–3,480 resistance zone, followed by a clear bearish rejection (highlighted with red arrows). This confirms the presence of strong supply pressure in that region.
🔍 Key Technical Highlights:
🔺 Double Top Pattern
The price formed two swing highs near the resistance zone, failing to break above.
After the second peak, the price started declining, confirming the reversal pattern.
📉 Bearish Channel
The recent downtrend is contained within a descending channel, with consistent lower highs and lower lows.
Price broke below the neckline of the double top pattern around 3,270.
🎯 Target Projection
Based on the height of the double top pattern, the projected downside target is near 3,207.5, aligning perfectly with the support zone marked below.
🟠 Historical Support Areas
The large orange circles indicate key reaction points, confirming that the 3,207–3,220 area has acted as support in the past.
📊 Outlook:
If the current bearish momentum continues, price is likely to head towards the support target zone at 3,207.5. Any pullback toward 3,320–3,350 could provide a shorting opportunity with stops above the recent highs.
🔧 Bias: Bearish
📍 Resistance: 3,360–3,480
📍 Support: 3,207–3,220
📍 Target: 3,207.5
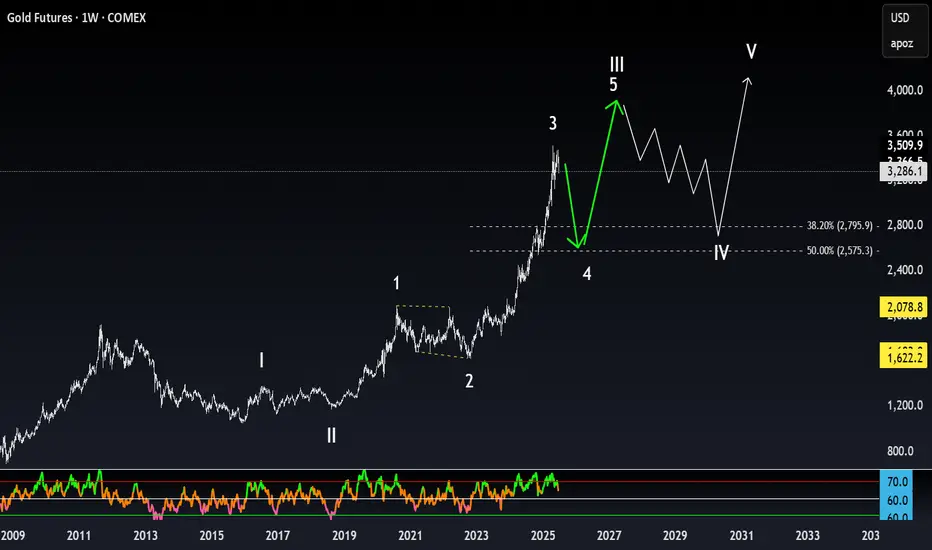
Navigating Gold Futures: Support, Resistance, and ProjectionsCOMEX:GC1!
The chart appears to depict a clear five-wave pattern: I, II, III, IV, and V.
Waves I to III show strong upward movements, indicating bullish sentiment.
Wave IV looks like it could be a corrective phase, with a potential dip before another upward movement in Wave V.
Support and Resistance Levels:
The horizontal lines around 2,800 and 2,575.3 indicate critical Fibonacci retracement levels (38.20% and 50%).
If the price approaches these levels during the correction, they could serve as support, making it a potential buying opportunity.
RSI Indicator:
From the bottom indicator (RSI), we can see fluctuations in momentum, which can aid in timing trades.
Look for interpretations of the RSI: if it trends towards the extremes (overbought/oversold), that could signal reversal points.
Future Projections:
Should the market respect the outlined support levels, Wave V could potentially push towards a new high above 4,000 as indicated by the upward projection.
Market Sentiment:
Overall, the pattern suggests a bullish outlook long-term, but caution is warranted during corrective phases as prices might retrace towards support levels.
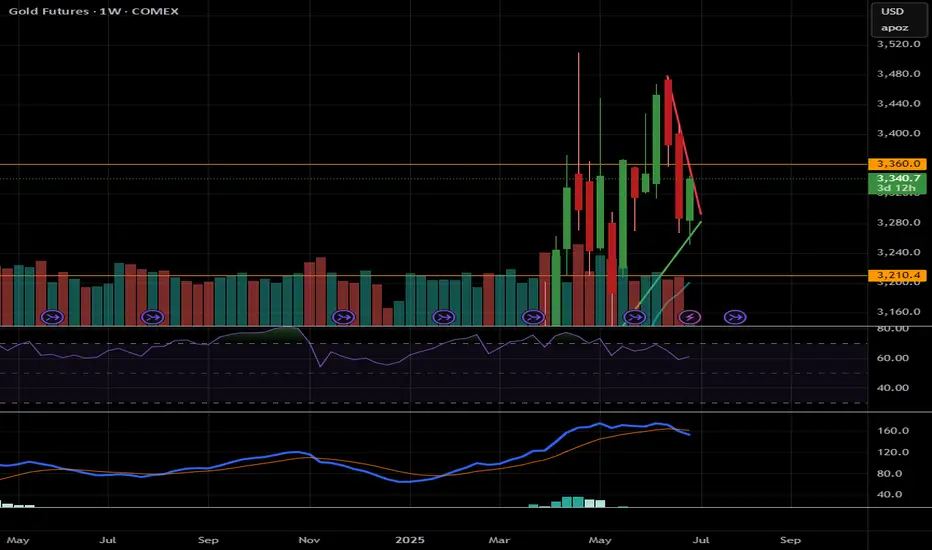
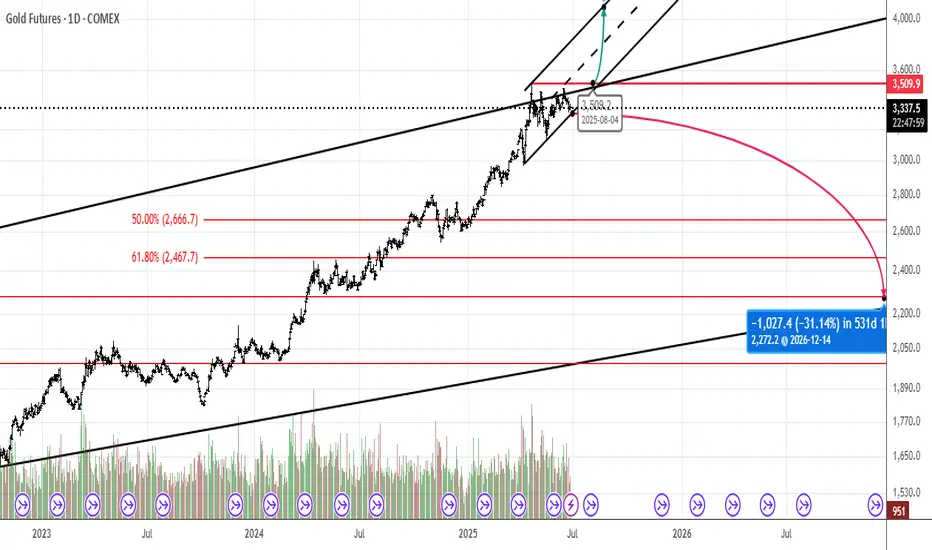
Gold, GC!, Sideway to the Downside (Long Term)06/30/2025, 10:30 PM PT
GC! is currently at its max around 3,500.
On the Weekly MACD, the crossover between MACD lind signal line already happened. There is also a bearish divergence on weekly chart.
On the Daily chart, RSI just crosses below 50 on RSI, and MACD shows weakness on the bull (it still not in the bear's territory just yet).
Reversasl to bear side may happen if price stays below 3,200
Bullish will continues if price break out of all time high
Current range for big timeframe from 3,200 - 3,500
Plan for swing trade:
Bullish Case (short term): break trendline. If hold above 3,360, price could go up to 3,400 -> 3,450
Bearish Case (short term): If price rejects and stays below 3,360, price could go down 3,310 -> 3,280
***Disclaimer: This analysis and trade plan are for educational and informational purposes only and should not be considered as financial or investment advice.
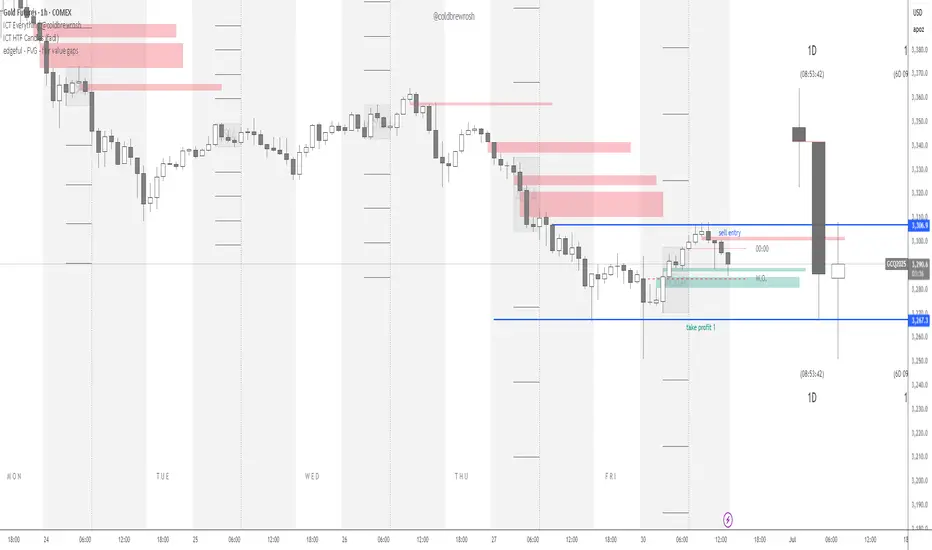
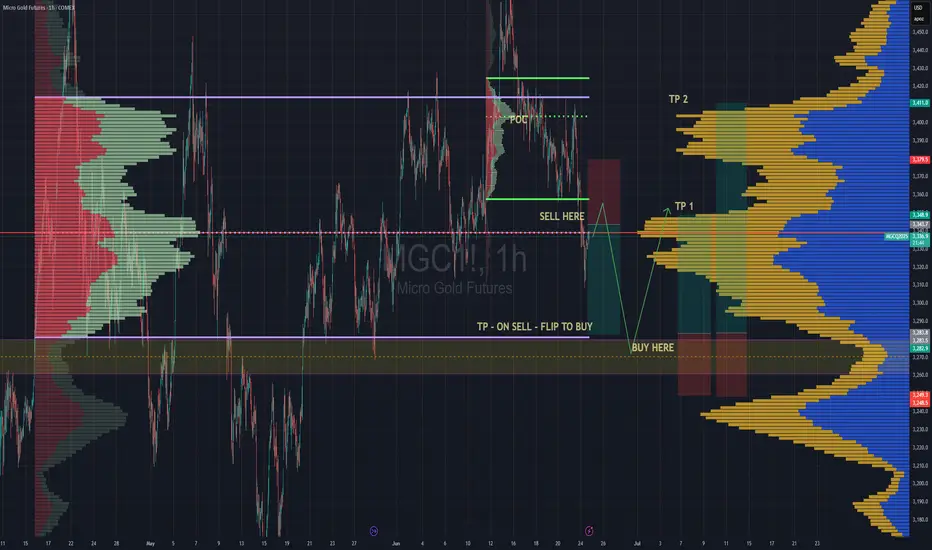
Long & Short Entry Forecast For GoldCooling war tensions seem to be cooling the Gold bullish rally as well.
But we're still in the same range since April 15th and will likely stay in the range until further notice *or the next tweet*
The Sell entry is great now cos we're near the top of the high volume node, so even if we consolidate around that POC this sell entry will still be putting us closest to the top of the node.
Hold your sell and TP at the VAL . We have a very deep low volume area there and its being a point of support since April. So we can place bets with small risk on hoping it holds cos if it doesn't, it wont be pretty. That is still the best place to buy regardless. So manage your risk accordingly
TP 1 for the Buy trade is at the POC , which also happens to be the top of the huge volume node. Totally make sense to take a decent chunk of profit of your position there, then move you stop loss into profit and grab some pop corn. Depending on the news , the best case scenario of for the uptrend is to continue all the way up to TP2 which is at the VAH
Secure the bag :)
Enjoy
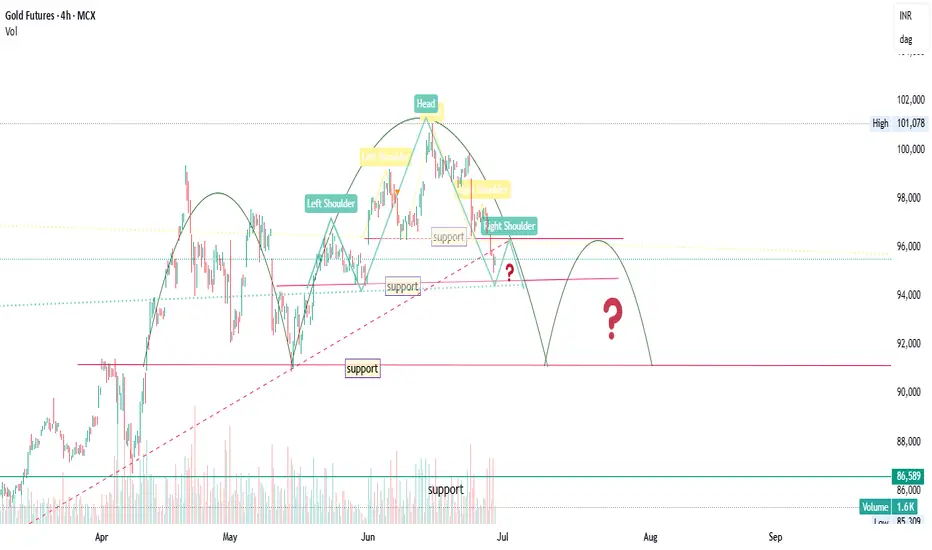
Gold 4H-figment of my imagination. Chart Overview:
Timeframe: 4H (MCX)
Current Price: ₹95,524
Volume: 1.6K
Trend: Short-term bearish
📉 Observations:
1. Break of Support Zones:
Multiple support zones have been drawn on the chart:
Around ₹96,200, ₹94,700, ₹91,800, and finally near ₹86,600–82,200.
Price is now trading below the ₹96,200 support, showing clear weakness.
2. Structure:
This looks like a lower high – lower low formation.
Recent price action has broken previous swing lows, indicating bearish momentum continuation.
3. Next Key Supports:
₹94,700 – could act as the next immediate support (minor bounce possible)
₹91,800 – stronger historical zone
₹86,600 to ₹82,200 – major demand zone (strong support last seen in April)
4. Volume Analysis:
Volume hasn’t spiked significantly on the recent fall, suggesting no panic yet, but also lack of buying interest.
📌 Conclusion:
The trend is weak and corrective, favoring sell on rise until price reclaims ₹96,200 convincingly.
Safe buy zone: Near ₹91,800–₹86,600, if price shows reversal signals.
Watch out: If ₹91,800 breaks, ₹86,600 or even ₹82,200 could be tested.
STEEL-NERVE SETUP – ARE WE RE-LIVING GOLD’S 2020 BEAR-TRAP?Retail sentiment is ultra-bearish, positioning is cooling, Silver is outperforming and the S&P 500 is screaming risk-on … exactly the cocktail we saw in June 2020, right before Gold & Silver exploded higher.
1️⃣ WHY THIS FEELS LIKE 2020 AGAIN
2025 (now) 2020 (pre-rally) Read-through
> 70 % of TradingView ideas are bearish 💬 > 60 % were bearish Crowd may be offsides again
Managed-money net-longs -18 % from April peak 📉 -25 % from March peak Powder for fresh longs
First monthly ETF outflow (-$1.8 bn) 🚪 Record inflows Capitulation, not euphoria
Gold/Silver ratio down to 94 ⚖️ Fell to 95 Silver leadership = bottoming tell
S&P 500 at new ATH 📈 S&P at new ATH Risk-on backdrop identical
2️⃣ WHAT’S DIFFERENT THIS TIME
Real 10-y TIPS yield +0.7 % (2020: -1 %) → smaller monetary tail-wind.
Gold already at inflation-adjusted ATH → upside could be shorter & sharper, not a fresh super-cycle (yet).
3️⃣ CHECKLIST FOR A REAL BEAR-TRAP
Signal Watch-level
Gold holds $3 200–3 250 (100-d SMA + fib) Daily close above zone
Gold/Silver ratio breaks < 90 Momentum confirmation
CFTC net-longs < 150 k Position flush
ETF flows turn positive Fear → FOMO
S&P stumbles / vols spike Classic risk-bid for Gold
Need 3 of 5 boxes ticked to validate the squeeze thesis.
4️⃣ CATALYST CALENDAR
3 Jul – NFP: sub-75 k print could fire the opening salvo.
9 Jul – Tariff freeze decision: escalation would revive safe-haven demand.
15 Jul – CPI & 30-31 Jul – FOMC: dovish turn + soft data could complete the squeeze.
Disclaimer: This post reflects my personal opinion for educational purposes only; it is not financial advice. Trading futures and commodities involves substantial risk and can lead to total loss of capital—do your own research (DYOR) and consult a qualified professional before acting.

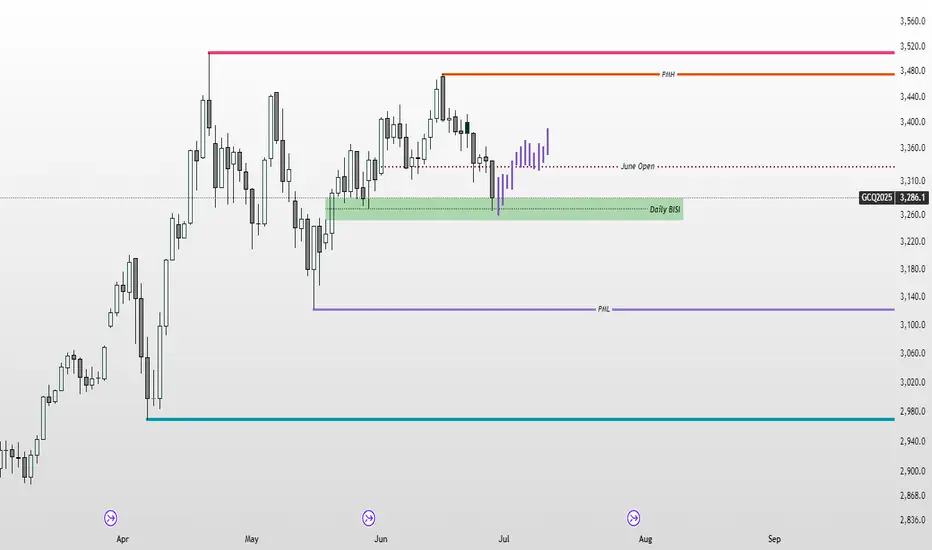
Is time to be a Gold Bull?Gold has been steadily repricing lower prices since June 16th after it took out May 16th's High. On Friday, June 27th, Gold moved into the Daily BISI (+FVG) zone and retraced upside. We may see another lower prices to purge the sellside liquidity before reverse upside for the short term. I don't expect another ATH next month, unless we have the right catalyst to do so. I'd anticipate for the price action to remain inside a large consolidation within the current Dealing Range as indicated in the chart. My Bullish case will be if price breaks above the 3500 convincingly, and the Bearish case if it breaks below 3120 convincingly also. In the meantime, we'll have to be satisfied playing tic tac toe inside the range. Don't get married to a strict bias at this time. Stay nimble, and let the price presents itself to you.
Global Gold at the Crossroads of CrisisGold’s response to historic geopolitical crises demonstrates that while “big fear” is rapidly priced in, the durability of rallies—or the depth of corrections—depends on a confluence of monetary policy, dollar valuation, oil prices, and the genuine scale of the threat.
At present, the gold market sits squarely between global “fear of instability” and “hope for de-escalation.” Divergent signals from the Fed, global central banks, and oil markets only deepen volatility, making investor decisions more complex. As previous wars (Iran–Iraq, Ukraine) have shown, gold is prone to both scenarios, but its long-term direction will be shaped by a mix of economic, policy, and psychological factors.
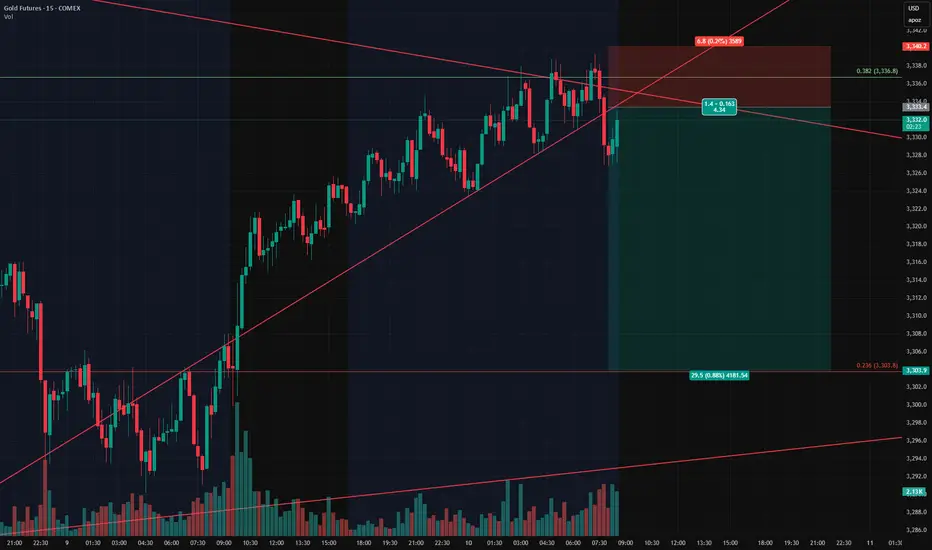
Gold Futures Short Bias Into NY CloseGC is stalling beneath the 3330–3336 resistance cluster after failing to break out during NY session. Price rejected the fair value gap (3312–3318) and is now compressing just above the mean-reversion anchor (LWN). There’s no momentum reclaim from buyers, and structure suggests weakness into Friday.
We’re positioning short into expected downside continuation.
Key Levels
Reactive Resistance Cluster: 3330–3336
FVG (rejected): 3312–3318
Mean-Reversion Anchor (LWN): 3290–3300
Absorption Shelf (Target Zone): 3275
PDH/PDL (provisional): 3325 / 3280
VWAP: Flattened, near 3302
Short Setup (Active)
Entry: 3332
Stop: 3340
TP1: 3305 – Mean reversion
TP2: 3288 – LWN sweep
TP3: 3275 – Absorption shelf
Staakd Setup: 1:5.7 R:R to final target
Bias confirmed by rejection from inefficiency and absence of buyer follow-through
QM Probabilities
Bear Move 60–65% Structure favoUrs continued rejection + flush to 3275
Bull Move 35–40% Requires reclaim of 3318 + aggressive close above VWAP
Range/Flat Possible pre-close Tight range unless displaced overnight
Staakd Bias:
Structure is holding beneath resistance. Without a reclaim of 3318, we remain short-biased into Friday with eyes on 3275. Probability favours continuation unless buyers reclaim initiative fast.
Follow for post-close recap and updated levels ahead of Friday's NY open and we hope your trades worked out how you expected today.

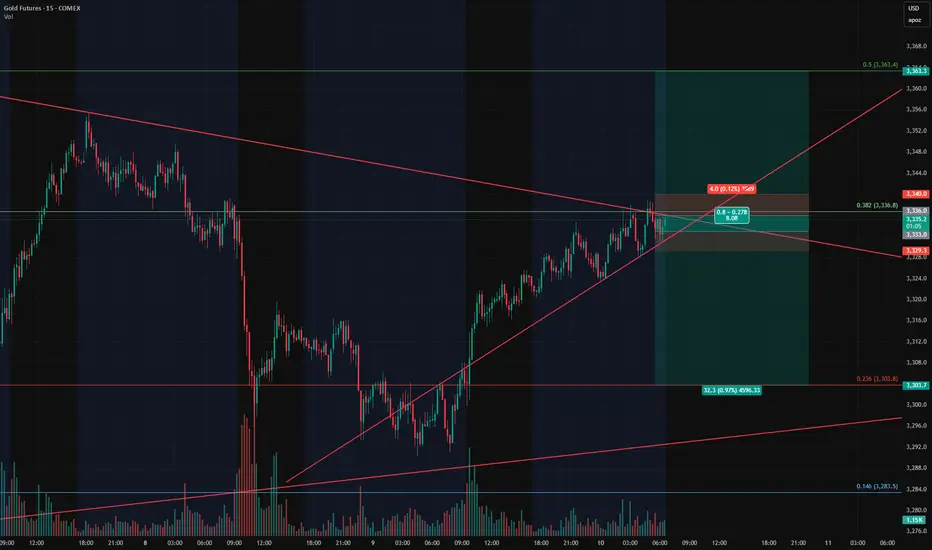
Gold Trade Setup – Long Invalidated, Watching Retest for ShortGold has been consolidating between $3,200 and $3,500, recently pressing against a descending resistance line that has rejected price several times. I was favoring the upside, but our long setup was invalidated — the stop loss at $3,330 was hit.
Price is now retesting ascending support, and I'm shifting focus to a short opportunity, using our previous long entry level (~$3,333) as a key area of interest for entries.
Here’s the updated plan:
Short Entry: Around $3,333
Stop Loss: $3,340
Take Profit: $3,303
Remaining cautious but opportunistic — the larger structure is vulnerable and could break further if support fails.
Gold Trade Setup – Watching the BreakoutGold Trade Setup – Watching the Breakout
Gold is currently consolidating between $3,200 and $3,500, with price action now pressing against a descending resistance line that has triggered multiple rejections in the past. We’re approaching a key decision point.
I'm favoring the upside in this setup — the momentum and structure suggest a potential breakout — but I fully recognize the downside potential and want to be prepared for both scenarios. Tight risk controls are key here.
Here’s how I’m positioned:
• Long Entry: Around $3,333
- Stop Loss: $3,330
- Target: $3,363 (looking for this level to be reached by end of day)
• Short Entry: Around $3,336
- Stop Loss: $3,340
- Take Profit: $3,303
The structure could resolve sharply in either direction, so I’m staying nimble and reactive.
GoldI am the best Trader in the World !
Even if other many professional traders says that Gold will go up , I am here to tell you No ! the Gold will very soon Collapse more than 11% !

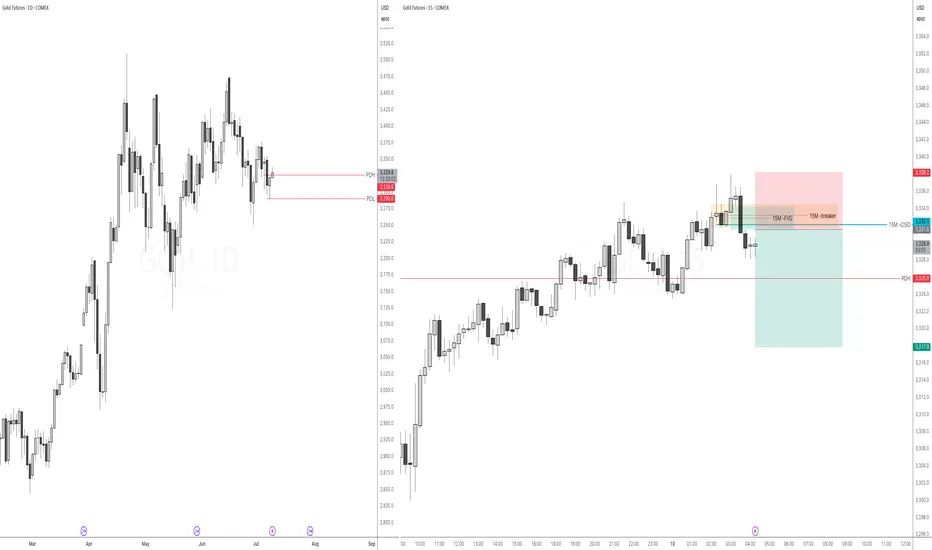
Sell GC based on 15M bearish unicorn breakerGC swept previous day high, 4h high during London open. It reversed sharply making 15M bearish change in state of delivery (CISD) and moving through 15M breaker and forming 15M FVG. Nice ICT unicorn breaker!
I have my sell limit placed at the low of 15m FVG. Will be targeting RR 1:2.

Early impulsive action got me active! This was a move I was looking to happen yesterday but got slapped trying. It just rocks out like that some time and you have to wait for the next opportunity. In this move early and looking for it to continue if it can hold well above yesterdays high. Trailing stop with every 50 ticks cause anything can happen turning price around and I dont want to give to much back.

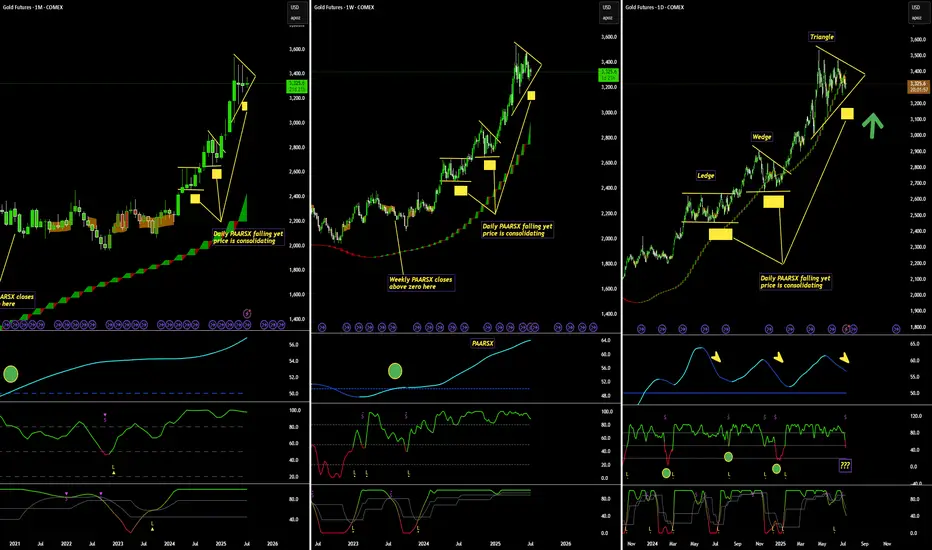
Gold Potential Bullish Break Showcasing Loxx's HandiworkNo surprise that bullish momentum is clearly evident on the Monthly & Weekly time frames with Higher timeframe hulls sloping on the M W D charts
What is interesting is how Loxx's PAARSX indicator, on the daily timeframe, clearly shows
a dark blue cycle downwards while price consolidates (yellow boxes under the price action)
providing us with hidden bullish divergence and another potential breakout very similar to the previous 2 ledge and wedge patterns.
Adaptive-Lookback Stochastic Top & Stochastic of Two-Pole SuperSmoother
Bottom show some solid daily historical entries. I can only imagine the 4 hour chart entries look just as profitable and enticing
This trader will be going long soon