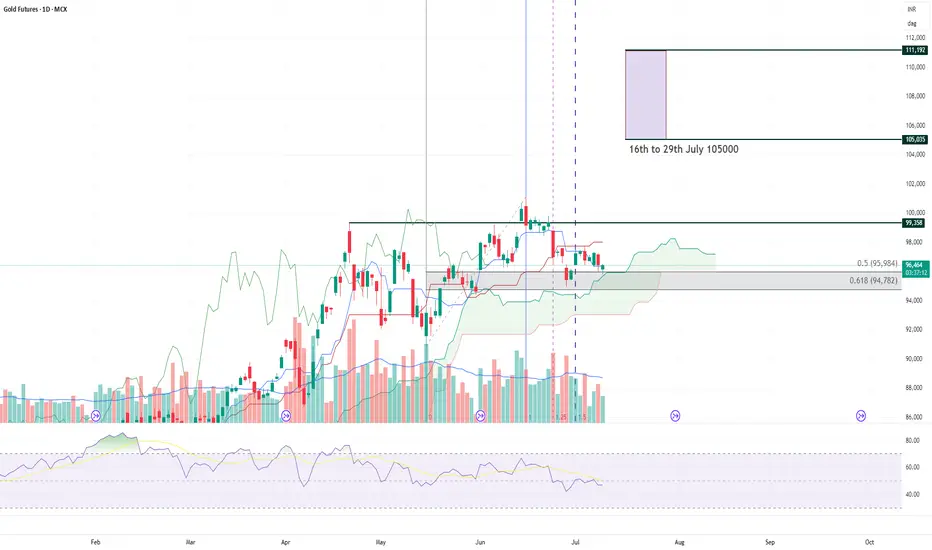
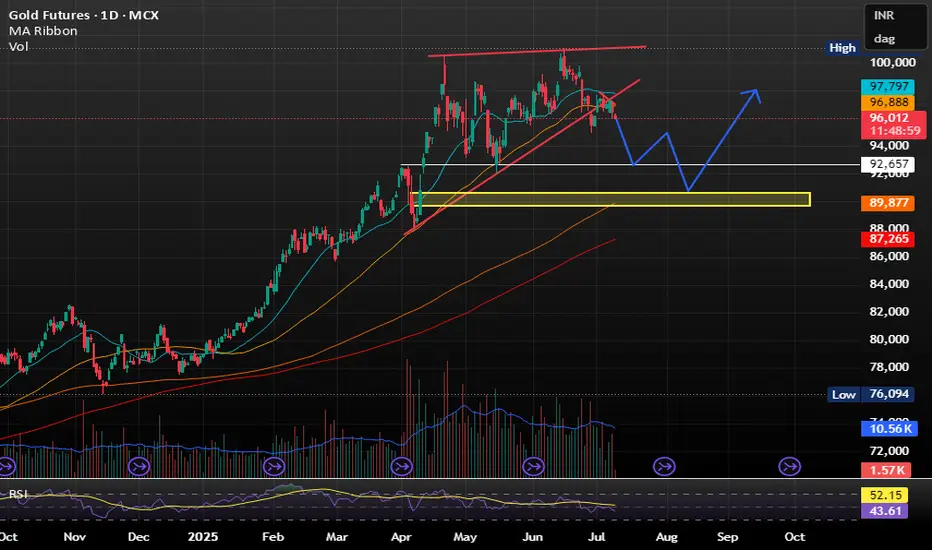
Gold MCX Bullish MoveGold as long as it is staying above the ichimoku cloud it can show a bullish move from here within a few days.. this month we can expect some movement on the upside clearing highs.
Stop loss can be kept near 94700-95300 levels with target of 102000 - 105000 with this month.
KGD1! trade ideas
Shorting gold again Well, it does look like there is still some room for a short trade that might actually hit.
Personally, iam not 100% confident in this trade, but i would have liked to see more confirmations before taking the short entry, yet still i think it is still worth the risk.
if you want more confirmations then here is the thing, wait the price to close below this yellow line, and i mean a close not a wick, then wait the price to pullback and take a short position.
my confidence in this setup is 6 out of 10.

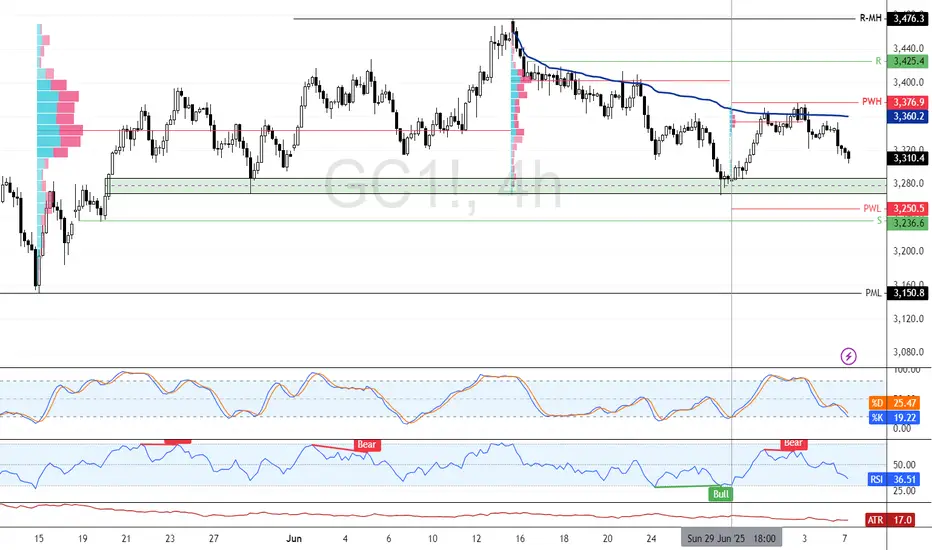
Compression Structure at Key Inflection PointDescription:
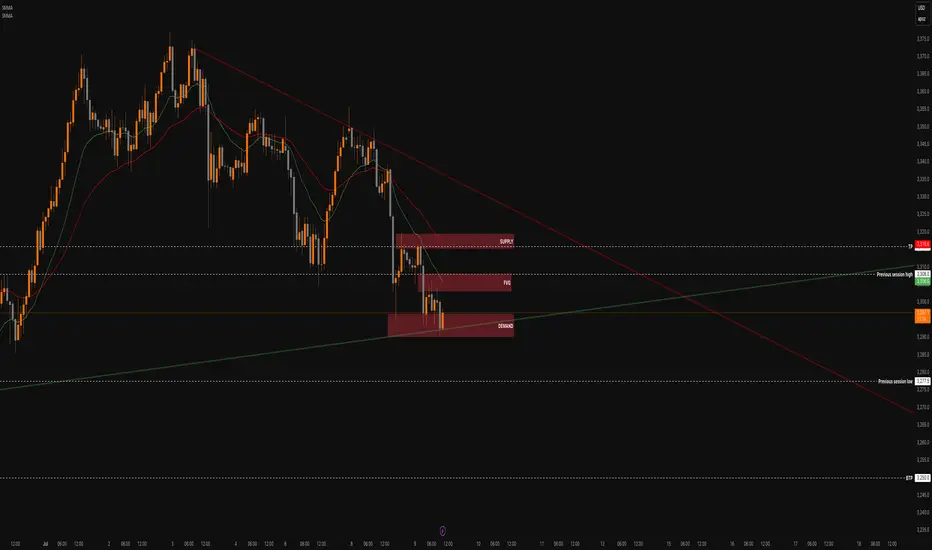
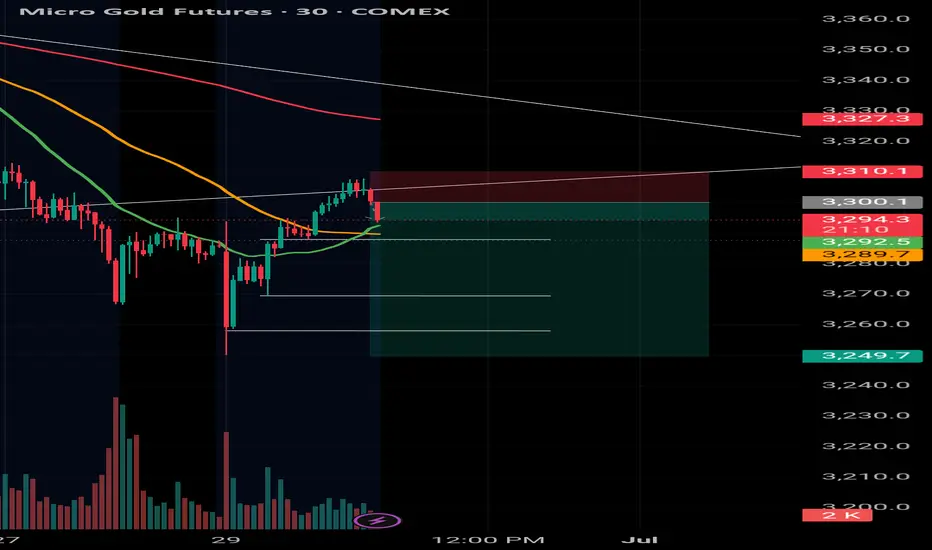
GC is currently trading within a high-probability inflection zone defined by confluence between structural demand, a well-defined fair value gap, and multi-timeframe descending trend line resistance. The asset is compressing between key volume thresholds and macro trend lines, presenting a binary scenario with favourable asymmetry in either direction.
Context & Market Structure
Chart Basis: 4H
Instruments Used:
GC1! (COMEX Gold August 2025 Futures)
20 & 50 EMA for short-term dynamic structure
Manual markups: S/D zones, FVGs, trendlines
Session Data: NY session highs/lows (previous day)
Key Technical Elements
Descending Trendline (Macro):
Initiated from swing high on July 5th, currently acting as dynamic resistance. Confirmed via 3+ touchpoints. Linear regression indicates slope remains intact.
Rising Trend line (Structural Support):
Originates from June 26th low supporting current bullish attempts. Intersection with demand and session low adds weight to this level.
Demand Zone (3280–3286):
Structurally valid with absorption wicks and bullish reaction. Volume clusters indicate localized buyer interest. Rejecting this zone twice already.
Fair Value Gap (FVG) (3297–3304):
Formed post-impulsive leg. Statistically, ~78% of FVGs in gold futures are filled within 2 sessions when no continuation candle follows which is the current setup.
Supply Zone (3314–3318):
Defined from previous consolidation pre-selloff. Aligns with ORB high + unfilled inefficiency, creating layered resistance.
Previous NY Session Levels:
High: 3310.0
Low: 3277.5
Price trading midpoint of this range increased probability of expansion after compression.
Scenario Mapping
Bullish Scenario:
Trigger: Break and 15-min hold above 3305
Validation: Acceptance into FVG zone + reclaim of previous session high
Target: 3316–3320 (supply zone + inefficiency fill)
Extended Target: 3334 swing high (mean reversion area)
Bearish Scenario:
Trigger: Breakdown below 3277.5 session low
Validation: Failure to reclaim demand zone; increased volume on breakdown
Target: 3250 (local HVN & previous accumulation node)
Extended Target: 3227 structural low (trend continuation)
Bias Model:
Volatility Compression: 3-day ATR declining; tightening range.
Mean Reversion Probability (MPR): 58% if price returns to mid-FVG before rejection.
Expansion Probability (EXP): 64% post-session high/low sweep.
Trend Alignment Bias: Bearish until > 3305 is sustained. Below 3280, short bias accelerates.
Summary:
GC1! is currently in compression between confirmed demand and a clean FVG/supply stack, with trend lines boxing in price from both directions. A breakout from this tri-zone structure is statistically likely in the next session. I remain neutral-biased with actionable directional triggers above 3305 or below 3277.
Not a market to guess, wait for confirmation. High-quality setups require patience at the edge of structure.
Staakd Rating: ★★★★☆ (4.6/5)
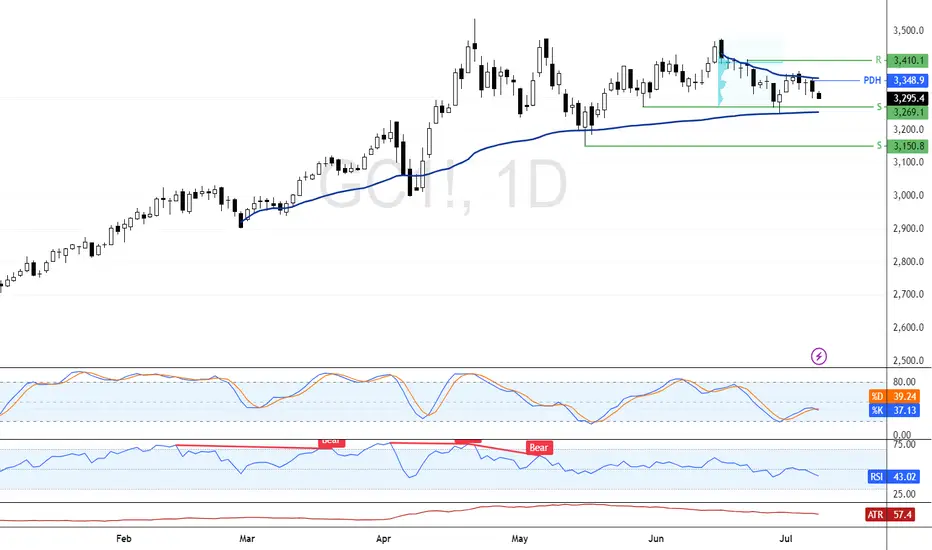
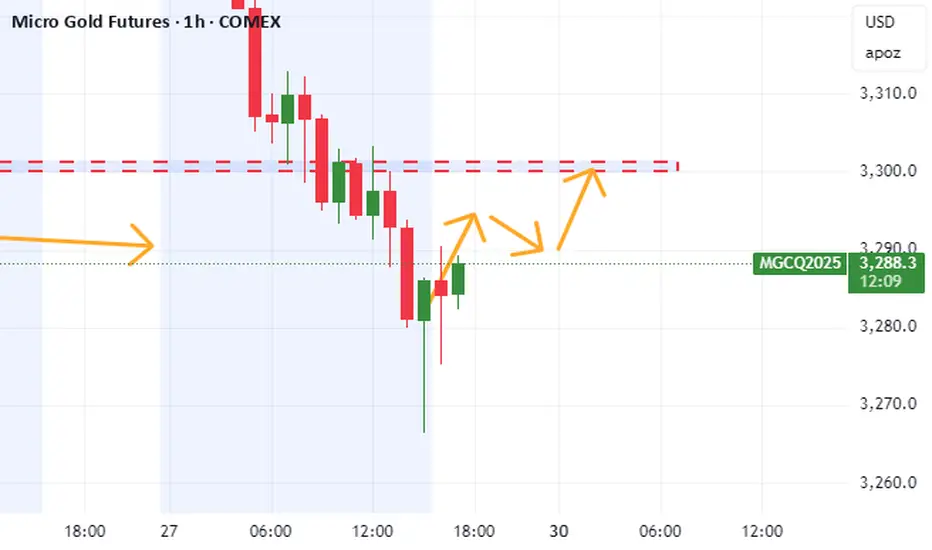
Gold Eyes Recovery From $3,269 Support ZoneGold dropped 0.65% to trade around $3,290.0, resuming its bearish bias. Immediate support rests at $3,269.1, backed by anchored VWAP. The bullish view holds above this level, aiming for $3,348.9.
A close below $3,259.1 would expose the $3,150.8 support.
GOLD IS MELTING LIKE A ICEGOLD IS MELTING LIKE A ICE -
Trading below 20SMA and 50SMA making it less attractive at current price level.
ALSO RELATIVE STRENGH IS WEAKNING .
As per my view Sell on rise will be profitable for short term .
DOWNSIDE TARGET SHOULD BE WITHIN 92000 TO 90000 .
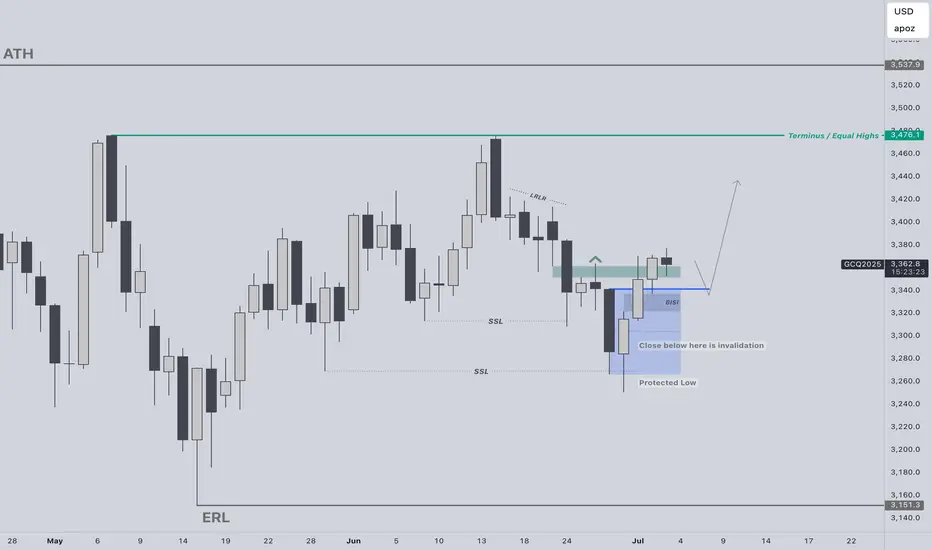
Gold LongsSolid daily structure for Gold heading into the holiday weekend. Bullish going into next week if price closes bullish on the week.
Daily discount SSL swept and closed back inside the range on Monday. Daily OB confirmed on Tuesday. FVG created and inversion fvg confirmed on Wednesday.
Anticipating Thursday to possibly pull back and offer a prime continuation to the upside. I'd like to see the inversion be respected. Price can wick into the BISI but I don't want to see price close below the BISI. That's a red flag.
Targeting Equal Highs.
$GC / Gold Update - The Bears Strike BackHello fellow gamblers,
I'm making this video to tell you all that nothing has changed!
Both scenarios are still at play and in this video I explain why I'm playing safe.
I might have mentioned in the video some of the trendlines, but at this time, it is best to play off the key levels for any confirmation.
- Levels to watch: 3418, 3363, 3283, 3208

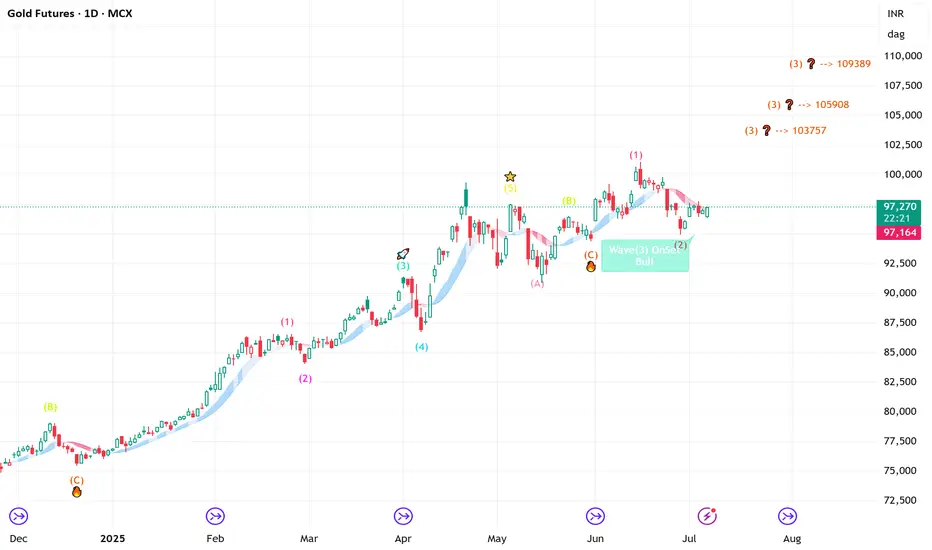
GOLD - Lovers Elliott wave - looking strong Short/Medium termGOLD-----Daily counts indicate Excellent bullish wave structure.
Both appear to be optimistic and this stock invalidation number (S L) wave 2 low
target short / long term are already shared as per charts
correction wave leg seems completed (C)
Investing in declines is a smart move for short/ long-term players.
Buy in DIPS recommended
Long-term investors prepare for strong returns over the next two to five years.
one of best counter
Every graphic used to comprehend & LEARN & understand the theory of Elliot waves, Harmonic waves, Gann Theory, and Time theory
Every chart is for educational purposes.
We have no accountability for your profit or loss.
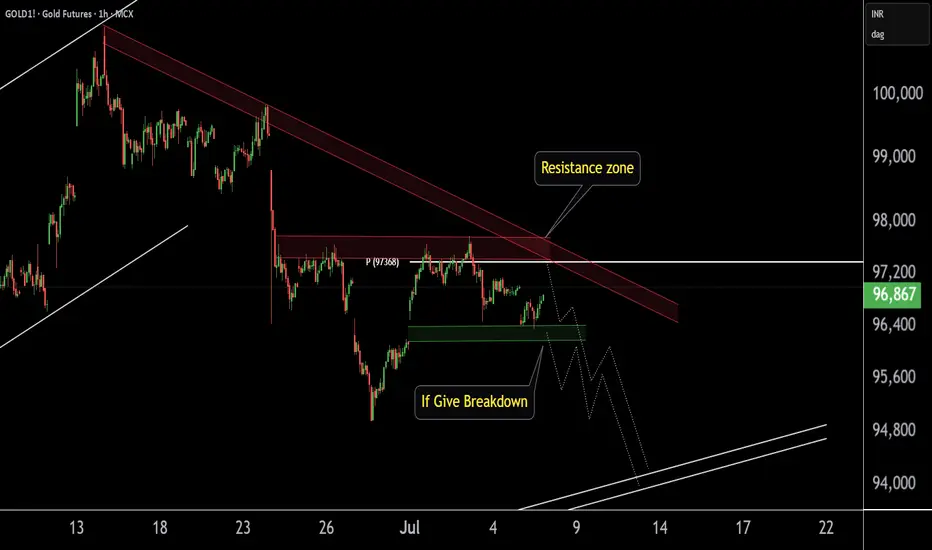
GOLD1! Best Key Level !!This is the 1 hour Chart of Gold!.
Gold is forming a bearish structure and is consistently respecting the resistance zone, leading to a downward move. The key resistance area is between 97,800 and 97,400..
Gold is finding support in the 96,250 – 96,330 zone on the short time frame.
A breakdown below this level may trigger aggressive selling pressure.
Thank you !!
Gold Faces Pressure After Rejection at $3,376 ResistanceFenzoFx—Gold dropped from the $3,376.0 resistance, a level reinforced by the anchored VWAP. June’s bounce at $3,250.0 marks a key support for the broader bullish trend.
If the $3,250.0 support holds, XAU/USD can potentially resume its uptrend. However, a close below $3,236.6 would invalidate the bullish scenario.
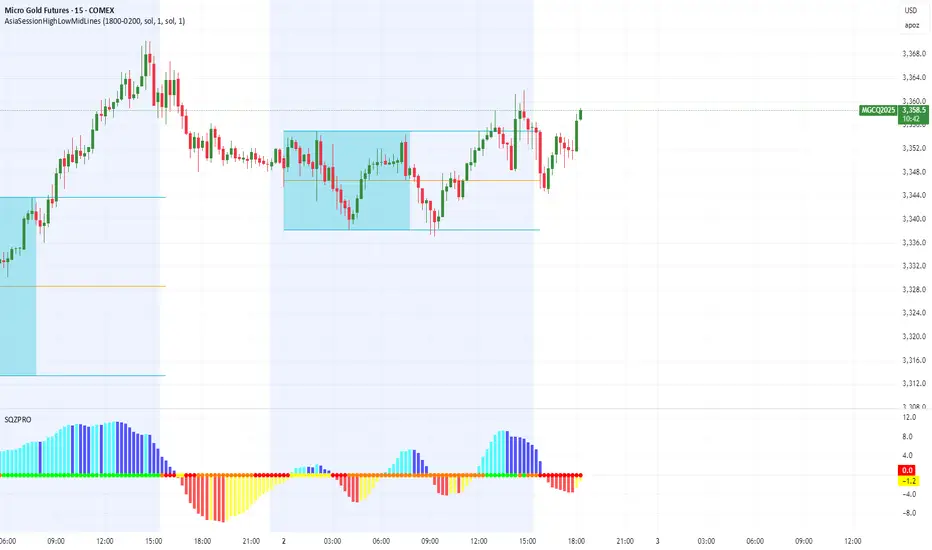
MGC UPDATE 7/2/2025COMEX_MINI:MGC1! played out as expected weekly level was respected and it it clear because of BFI sponsorship Thanks for the people who gave some interest to my last post always happy to help another fellow trader
tradingview.sweetlogin.com
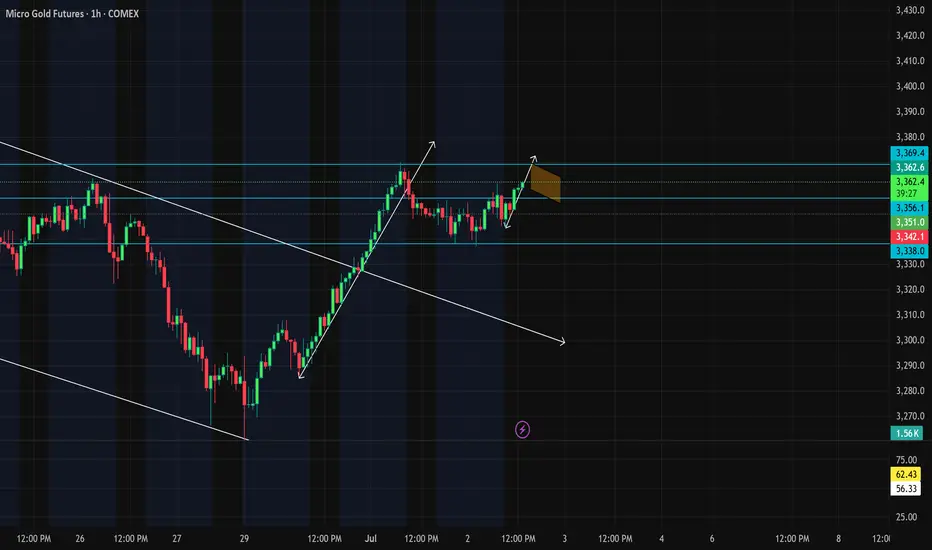
$MGC1! cup and handle forming.will this cup and handle play out on the 1HR and make a rip back up around 3400.?
Gold Market Update – Buy Signal (Swing Trading)A buy signal has been confirmed on the gold market for swing trading. if we want to scalp, it’s better to focus only on long opportunities — short positions could be too risky for now.
Big buyers are active, aggressive, and clearly pushing the price up.
As for targets, I prefer not to give fixed levels. I always monitor the market in real time to see how big buyers and sellers are reacting.
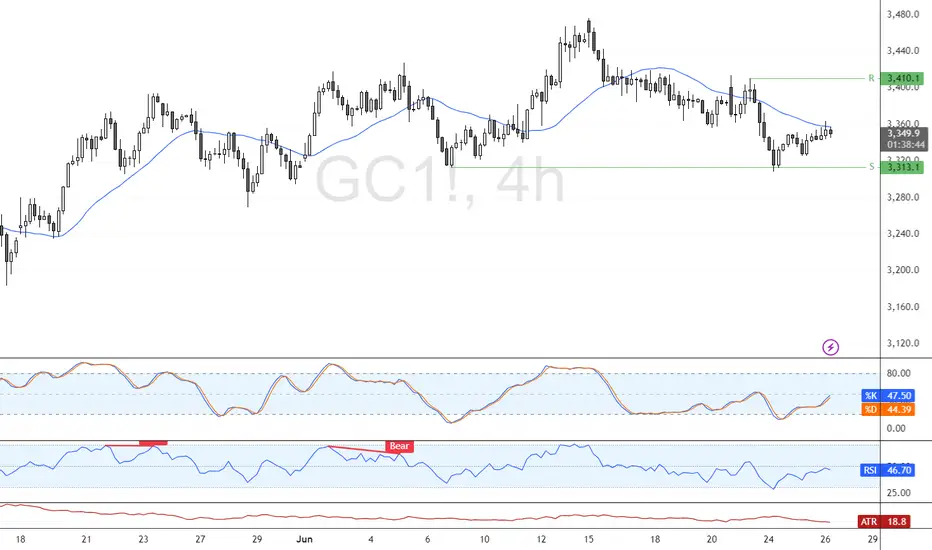
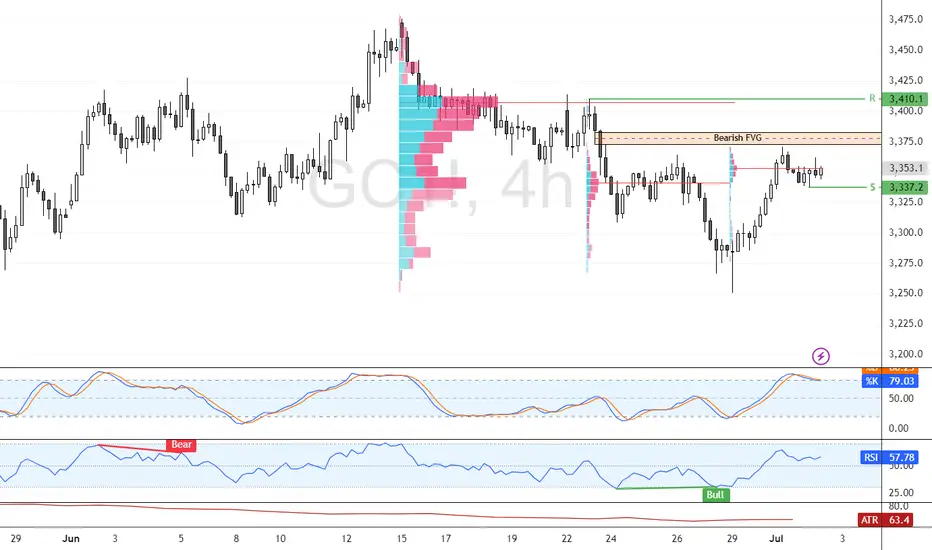
Gold Holds Ground as Bulls Eye $3,410 Volume ZoneGold built support at $3,337.2 in today's trading session. However, the uptrend is capped, and the price remained below the Bearish Fair Value Gap.
From a technical standpoint, XAU/USD outlook remains bullish above $3,337.2. In this scenario, the target is likely to be the next high volume area, which stands tall at $3,410.0.
Please note that the bullish outlook should be invalidated if Gold closes and stabilizes below the $3,337.2 support.
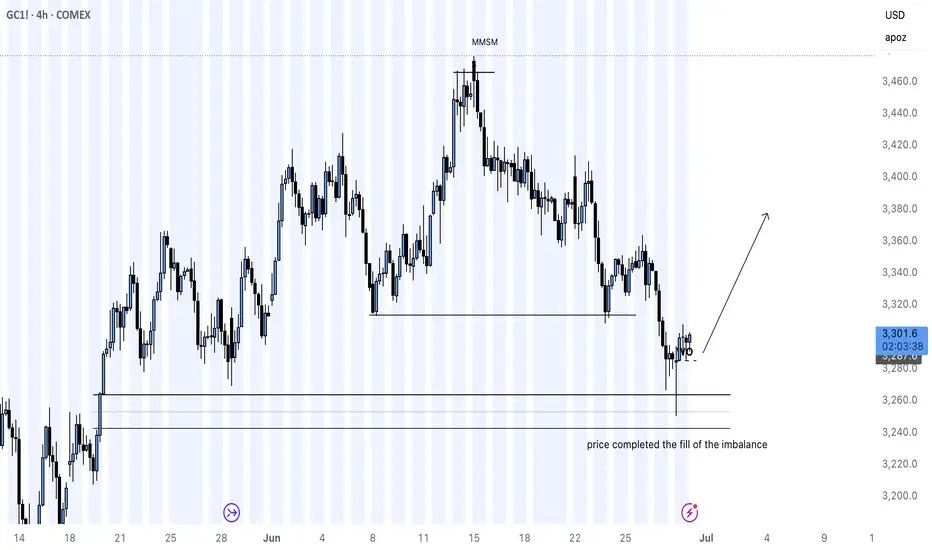
GOLD LONG IDEA MARKET STRUCTURE CHANGEgold futures were on a full sell off due to ongoing global turbulence in the month of June macro news is there to show the bigger picture but price tells the full story
imbalance was filled and the week opened with a bearish candle closing above 3,250 COMEX:GC1! price range now it is time to see It play out to the buyside for the precious metal
Broken uptrend on the dailyBreak and retest of the uptrend on the daily.
Entered short position after retest break.
$GC / $MGC / Gold - Weekend Update - 6/29Hello fellow gamblers,
The target for the ABC retracement has been hit and we are now looking for a reversal confirmation to enter any buying positions.
- The target for a possible Wave 1 of a new cycle will be above 3402.
- 3283 level needs to hold. A break of this level could take price lower towards 3208 to fill the VP gap.
- Levels to watch: 3208 - 3283 - 3357 - 3418

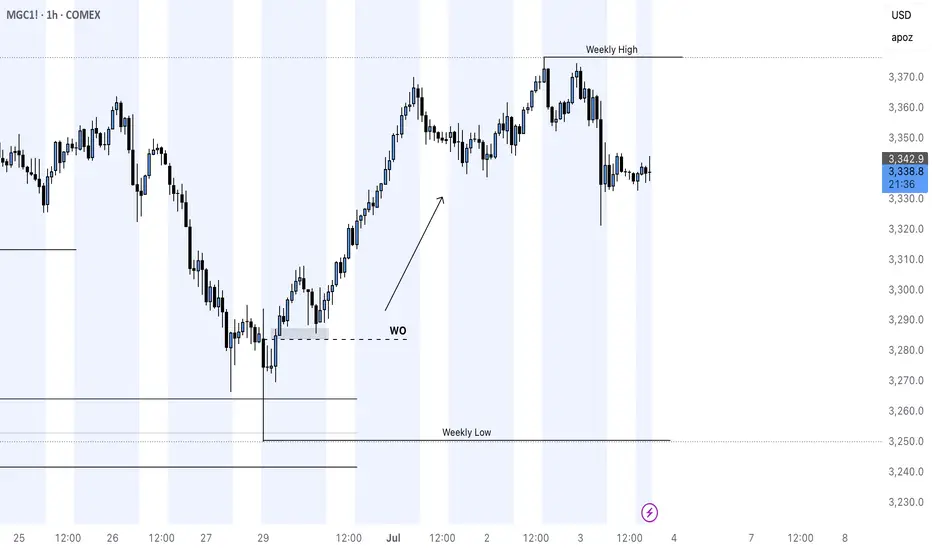
Will Gold Break out for the New Month this week?I was anticipating these possible sweeps. with it being the end of the month I'm thinking I might need to do more watching for now than positioning. waiting for the market to show its hand on what it wants to do next.

Gold Trade Suggestion
With a 90% win rate on recent gold trades, I recommend a long position.
Target 1: Around 3290.6
Target 2: Around 3300
Strong buying pressure is present in the market — big buyers are here and pushing with force.
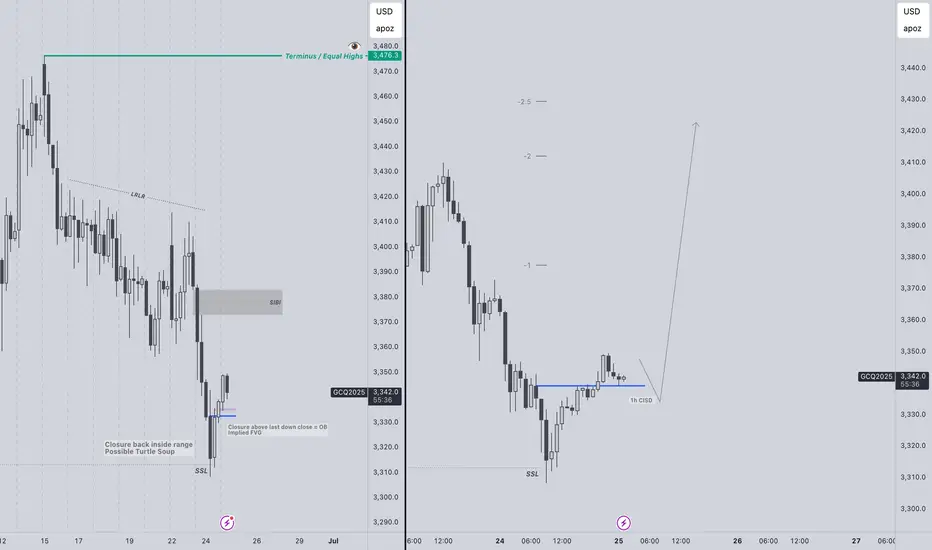
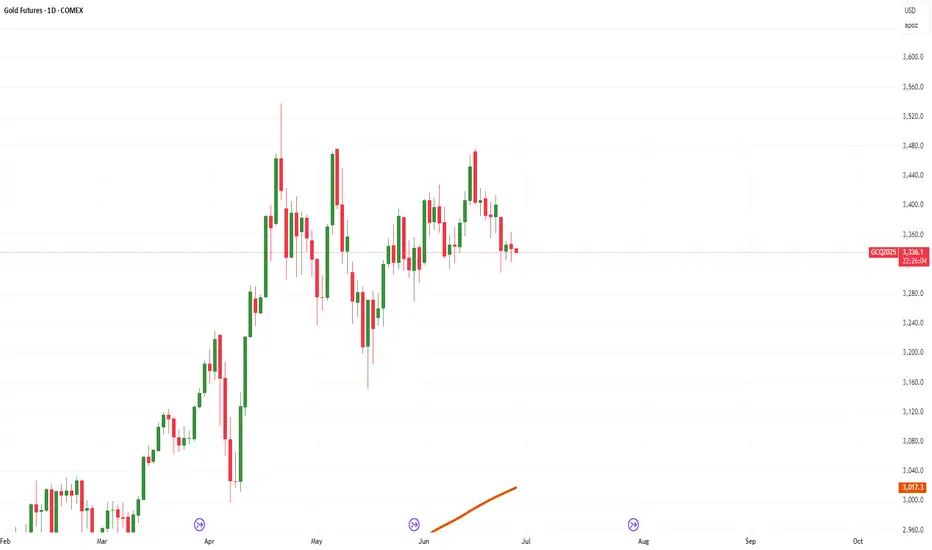
Gold LongsBullish weekly bias for Gold.
Classic Expansion Weekly profile in play. Price opened lower first, Im treating this as the possible manipulation for the week. Tuesday swept key ssl and closed back inside the range.
Drop to a 4h and OB is confirmed. 1h CISD aligned with 4h. Execution off 4h OB with stop at OB Low / Tuesday low. If BSL is the draw, I would like to see Tuesday low be protected.
LRLR is first low hanging fruit objective. 3420 roughly, with equal highs at 3476 being final target.
Gold Market Under Pressure - Key Support Levels📉 Update – Gold
Since Friday the 13th, buyers have been squeezed and sellers have taken control of the market.
The trend is currently bearish, and large buyers are not present. The price could drop toward the 3320 – 3298 zone.
If this zone is broken, we could see a further decline toward 3255 – 3175.
Today, while watching the New York session using order flow, we saw large buy orders hit the market.
Agree to disagree... Gold is topping right now.My price path seen above is a complete guess but it stems from long term trend lines and more importantly order flow from last week.
On Thursday there was a #1 trade on AMEX:PHYS for $200+ Million at the green levels in my chart above (Equivalent levels). PRICE WILL 100% go to my green lines by end of this week 04/25.
We are over shooting the dark pool sale but a lot, however, this is always to trap retail and create fomo/peak fear.
In the correction/recession cycles, gold ALWAYS TOPS LAST before the crash...

Gold Builds Bullish Momentum After $3,294.0 ReboundGold bounced from $3,294.0, forming a double bottom pattern as XAU/USD consolidates near $3,330.0. Stochastic has exited oversold territory, signaling strengthening bullish momentum.
If $3,294.0 holds as support, the uptrend may continue toward the $3,393.0 target.