KSMUSDT.P trade ideas
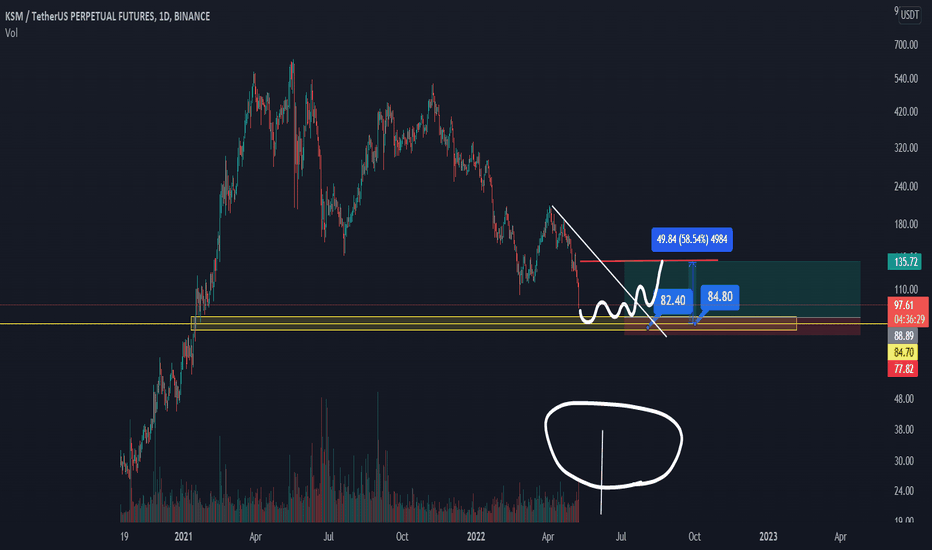
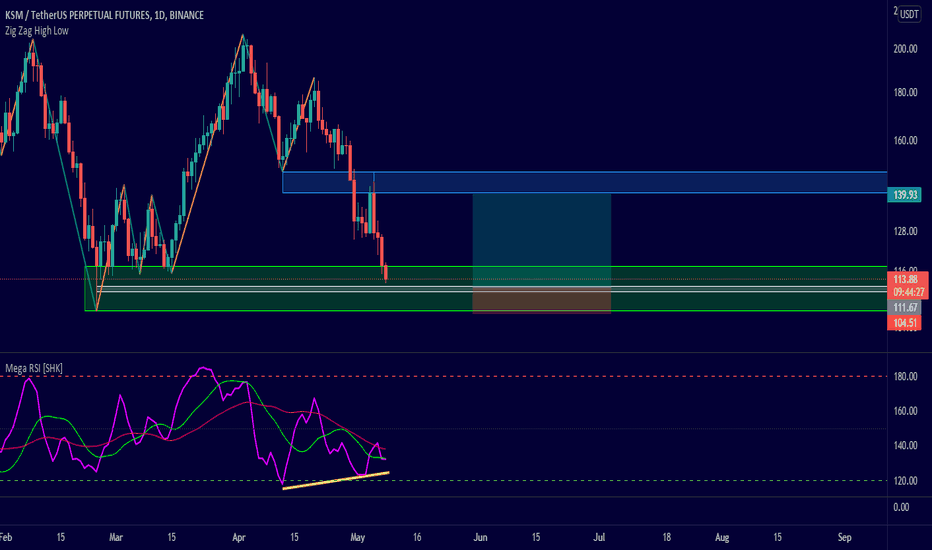
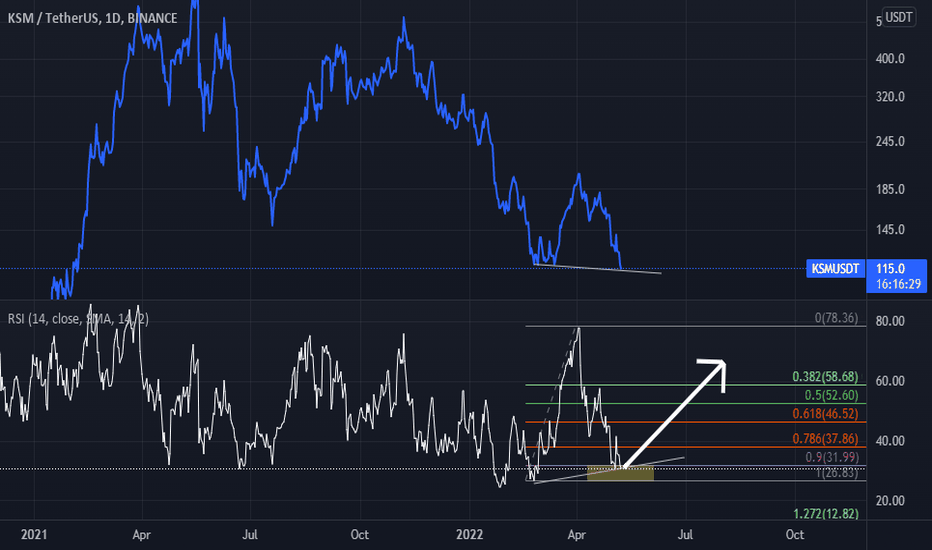
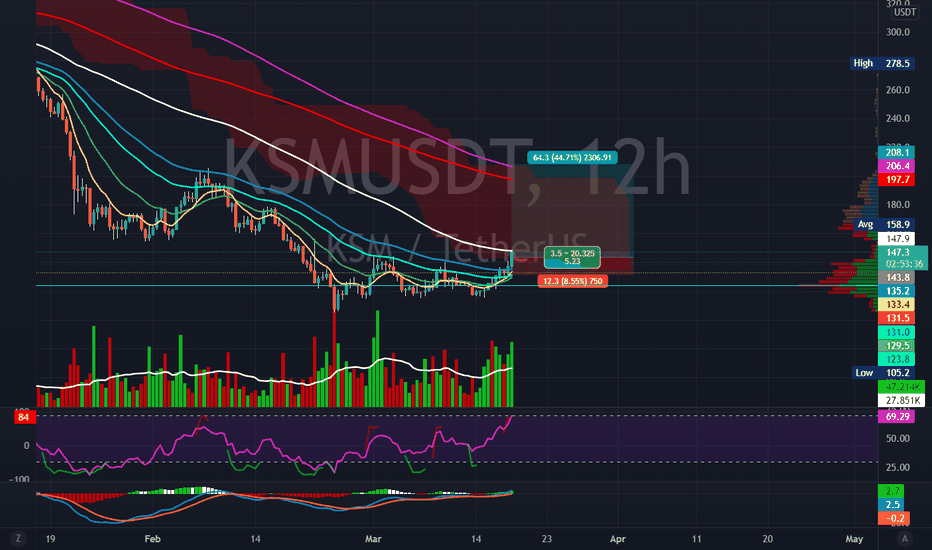
Bullish outlook for KusamaRSI levels on Kusama has reached 0.9 level on the daily timeframe which is usually brings about a reversal in this timeframe. If price closes daily around these levels we can expect a bullish reversal in price action.
Most of the Altcoin market seems prime for bullish momentum
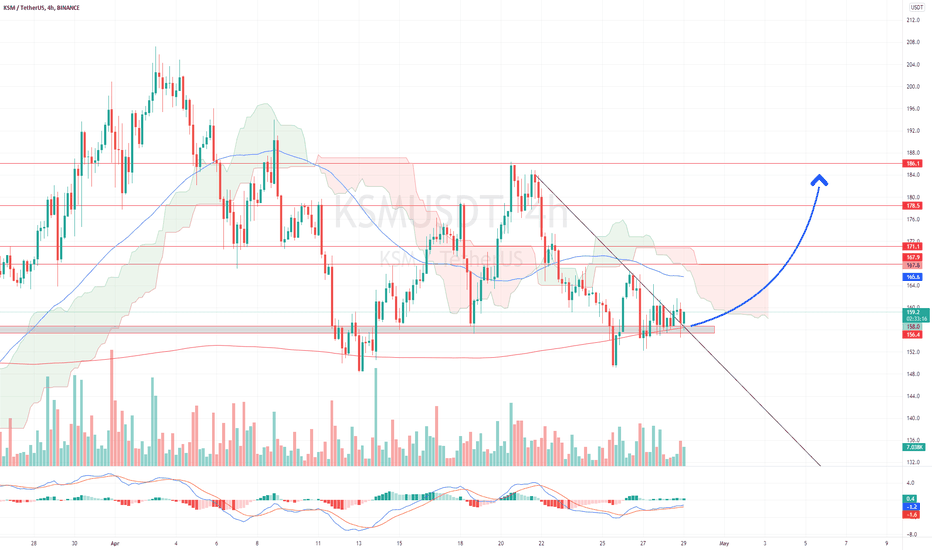
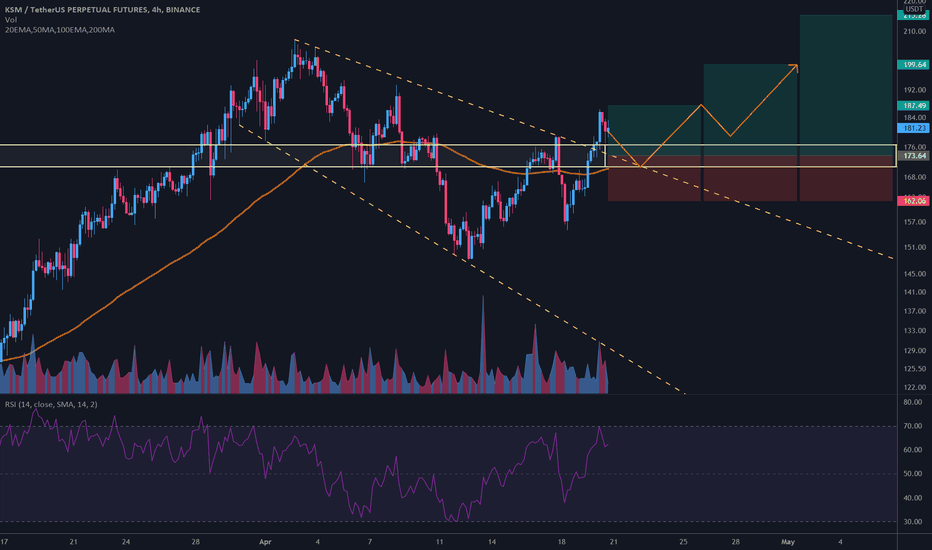
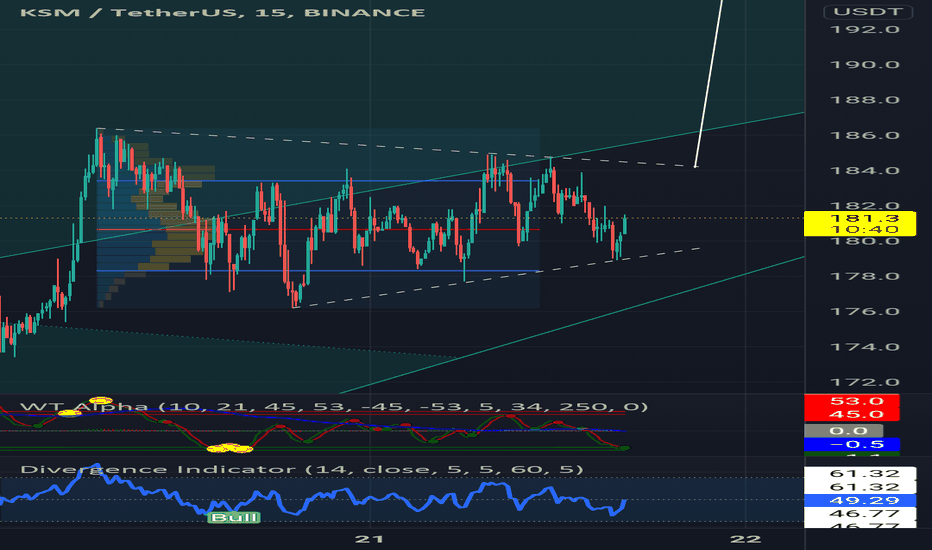
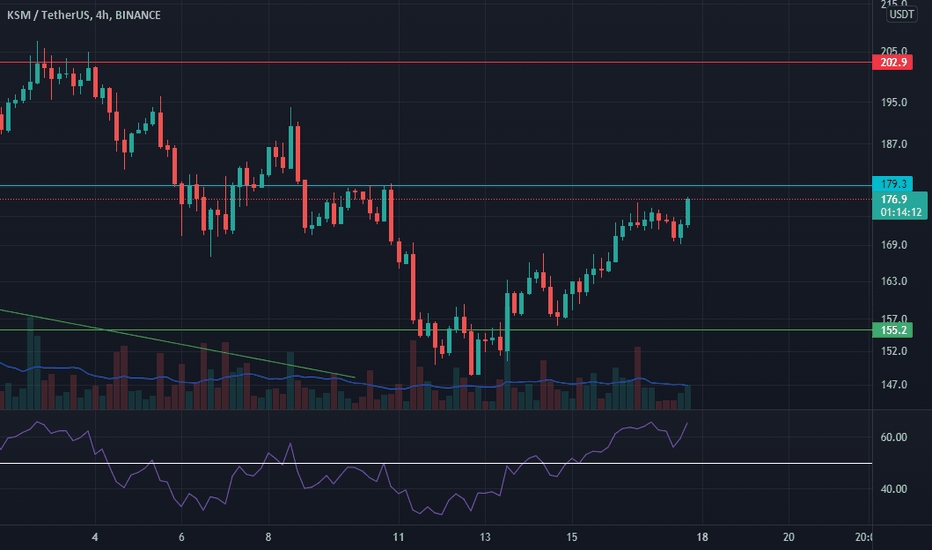
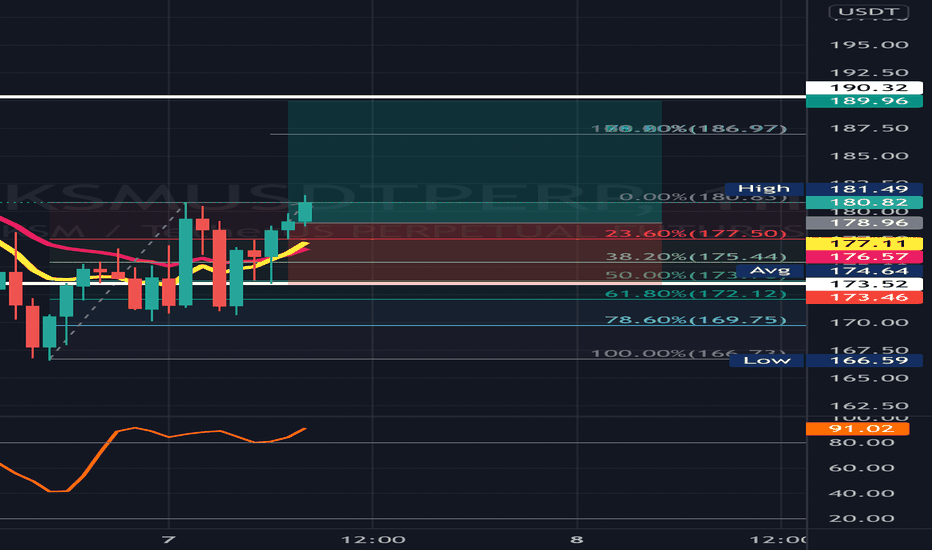
$KSM/USDT 4h (#BinanceFutures) Falling broadening wedge breakoutKusama Network is pulling back towards 100EMA support where we expect it to bounce and resume bullish.
Current Price= 181.23
Buy Entry= 176.54 - 170.74
Take Profit= 187.49 | 199.64 | 215.28
Stop Loss= 162.06
Risk/Reward= 1:1.2 | 1:2.25 | 1:6.43
Expected Profit= +15.96% | +29.94% | +47.96%
Possible Loss= -13.34%
Fib. Retracement= 0.702 | 0.883 | 1.117
Margin Leverage= 2x
Estimated Gain-time= 2-3 weeks
Tags: #KSM #KSMUSDT #Kusama #Statemine #Substrate #Parachain #DotEco #Polkadot
Website: kusama.network
Contract:
#Mainnet
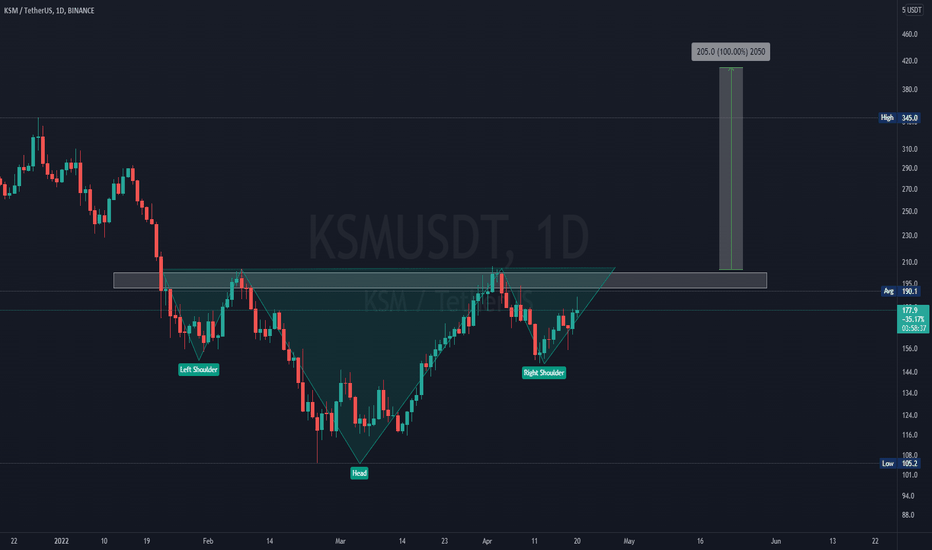
KSM/USDT Bullish ViewHello Traders
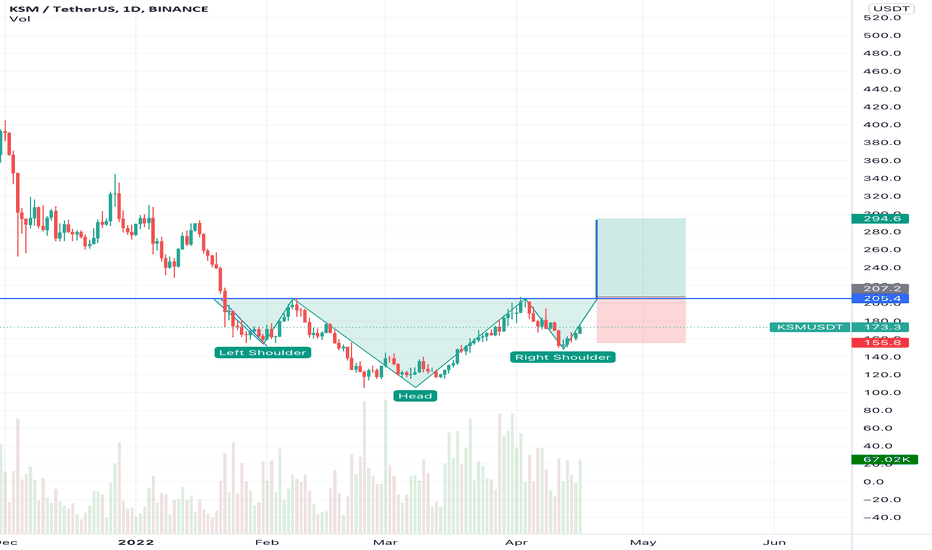
KSM/USDT is performing well in daily TF.
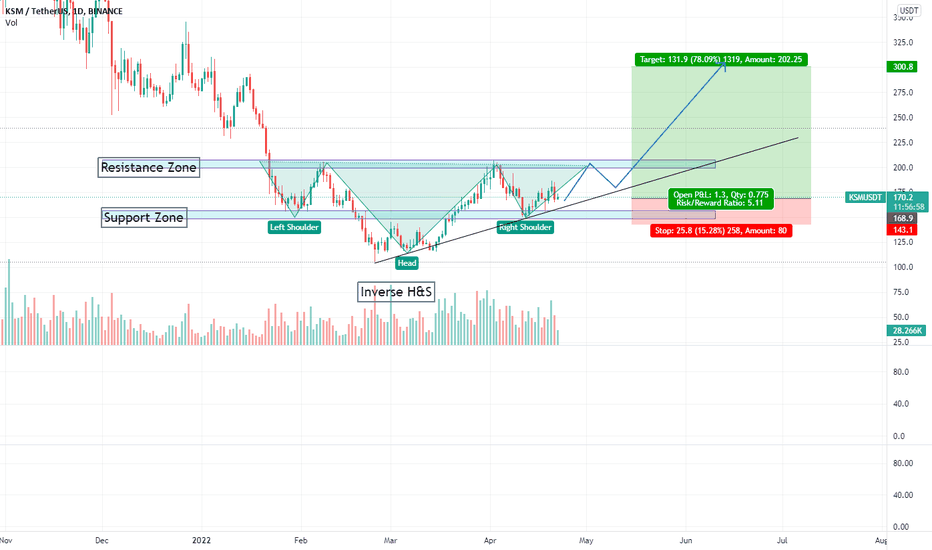
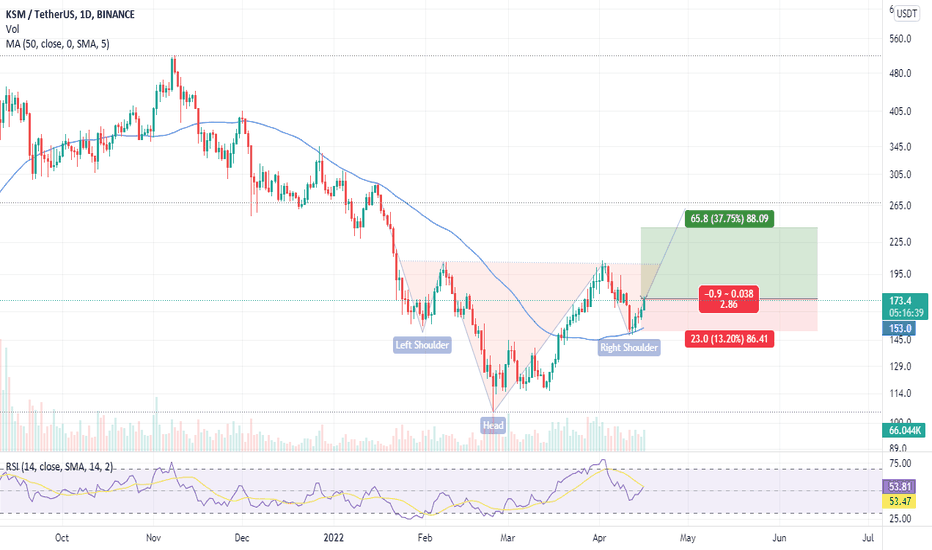
Price has jumped off of Support zone and trying to reach the next resistance zone forming an Inverse H&S pattern.
IF price breaks Resistance Zone(AKA neck line), this rally could lead price to 300$ zone.
Note: Bullish view got invalidate if price breaks below support zone(150 $).
Like, Follow, Share & Comment.
Thanks For Reading.
-RC
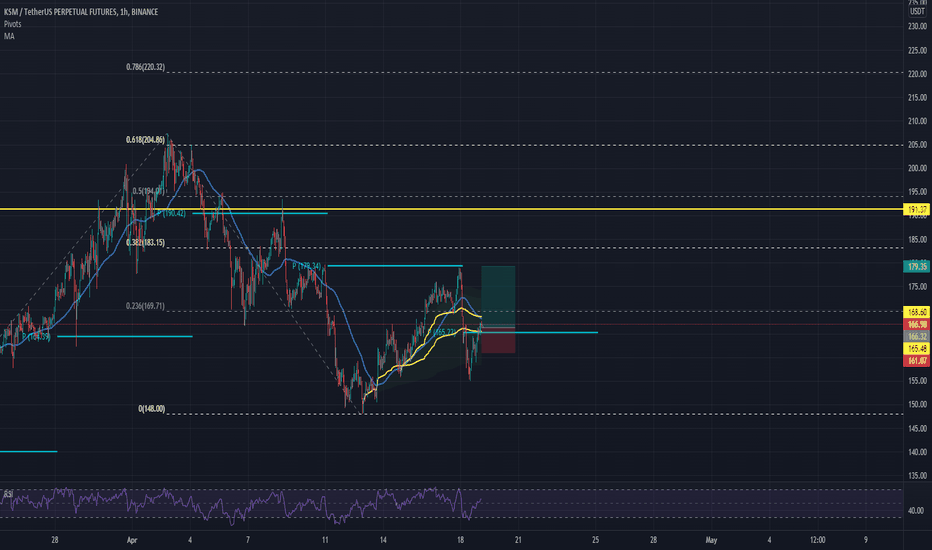
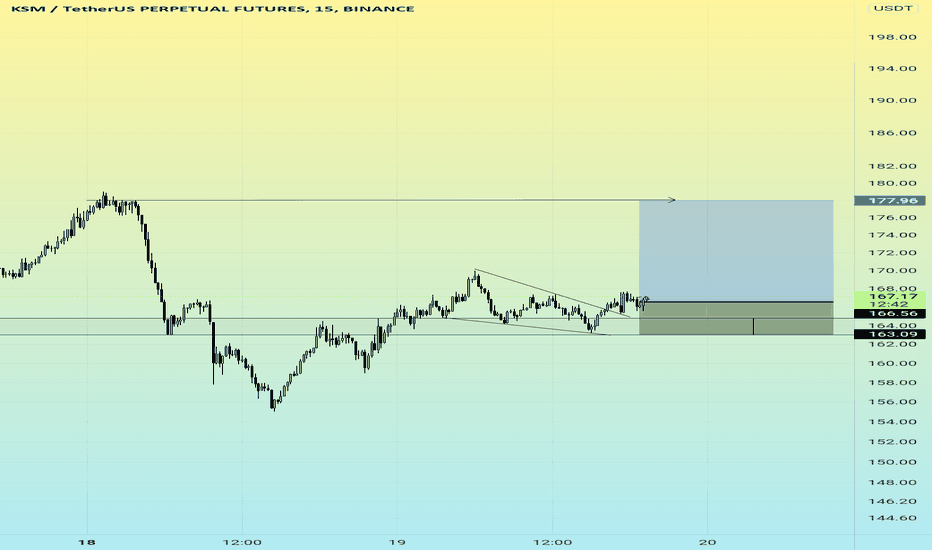
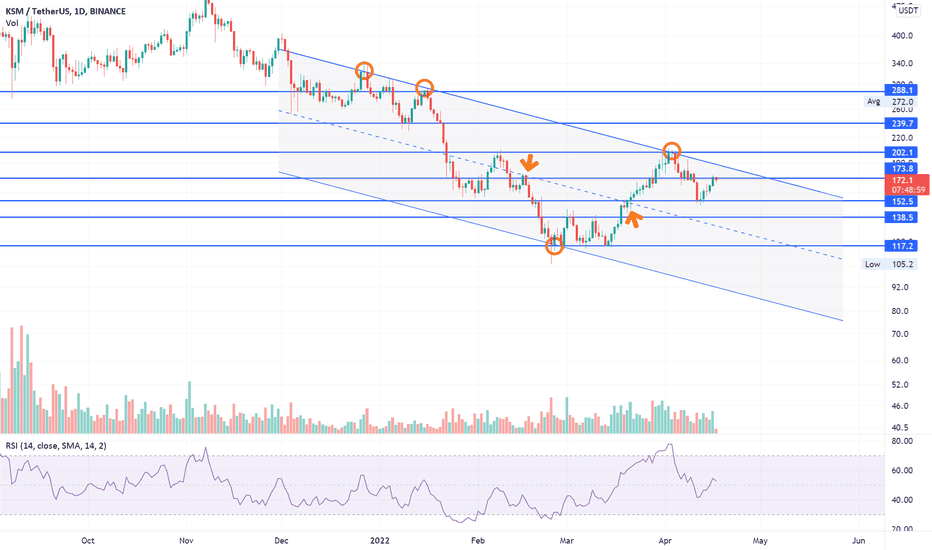
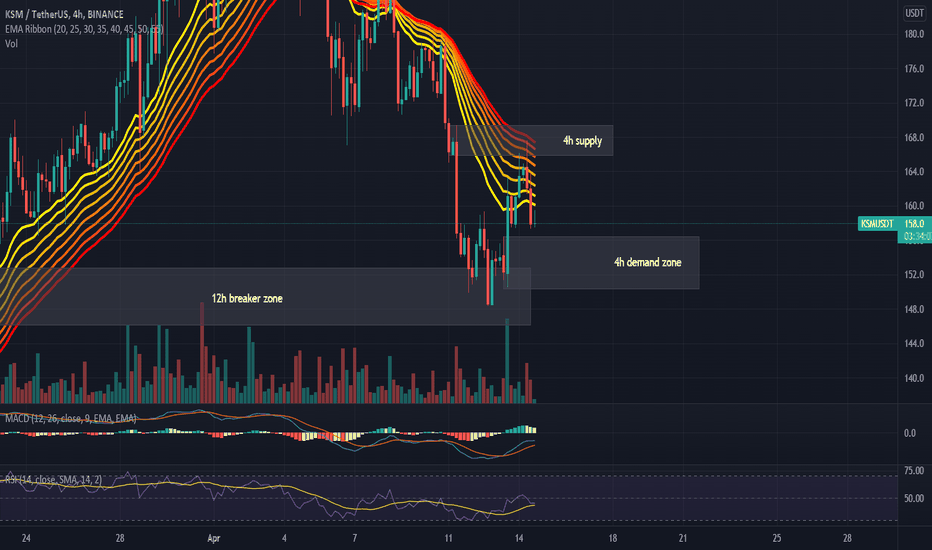
KSM resistance and trendline breakoutKusama broke the resistance trendline and retested it, and is now approaching the 4h resistance zone
If it closes the 1D candle above the 180 level, we can consider a nice LONG order with 200 as the target
my stop loss will be around 167 if this scenario is confirmed
let me know what you think about this ↓
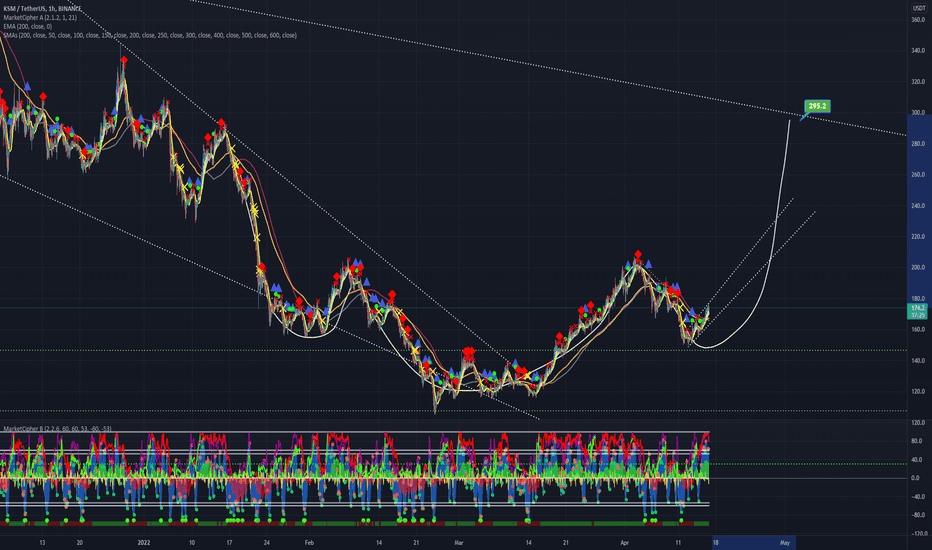
KSM/USDT MAX RETURN POTENTIALUsing Market Cipher, 200 sma and 200 ema 1HR chart. Inverse Head and Shoulders pattern in play, drawn on the wicks in chart. If validated, Max return potential in 15 days looking to be a return to $270-$280 range and a potential 72% return potential from here. Take profit range gathered from top of macro downtrend channel, support/resistance zone at the beginning of the pattern, and bounce from optimal buy area green dotted lines support. Long to top of channel, if broken to the upside, (which is possible in the Month of May, indicated by past May liftoffs), return to position past $300
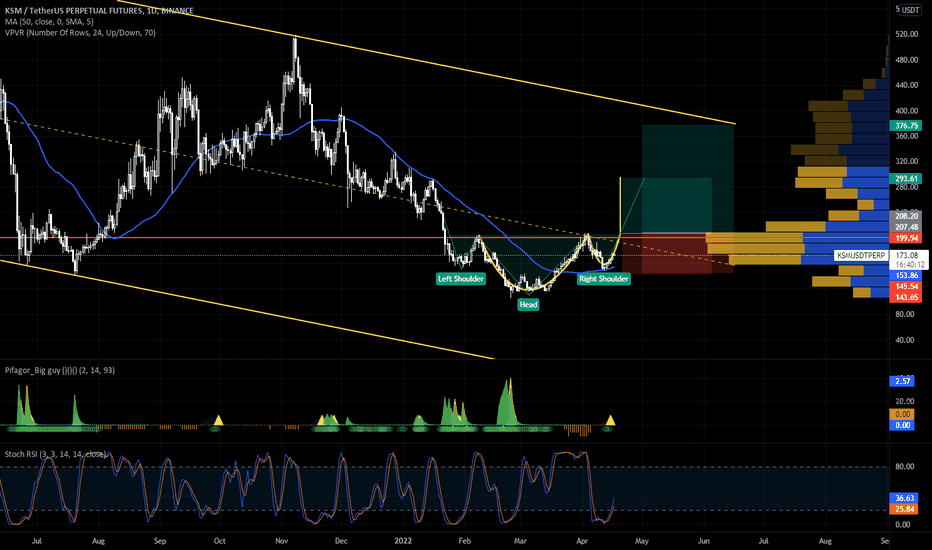
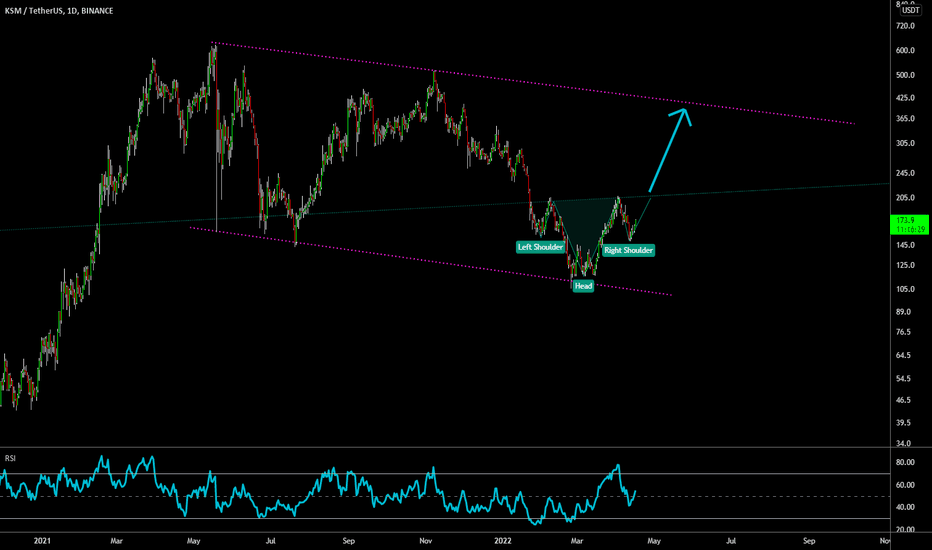
🔥 KSM Inverse Head & Shoulders: More Upside PotentialKSM has been slowly but surely forming a big inverse H&S pattern over the last couple of months. These patterns are classically bullish reversal patterns, so a bullish continuation after the pattern is completed is likely.
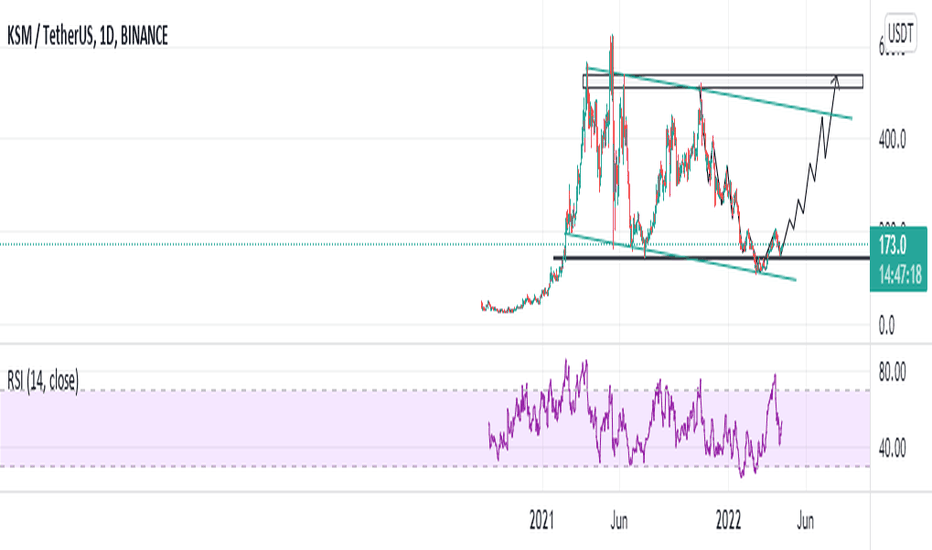
As seen on the chart, KSM is also trading in a massive bull-flag pattern. Long-term bullish target is the top of said pattern.
Happy trading!
