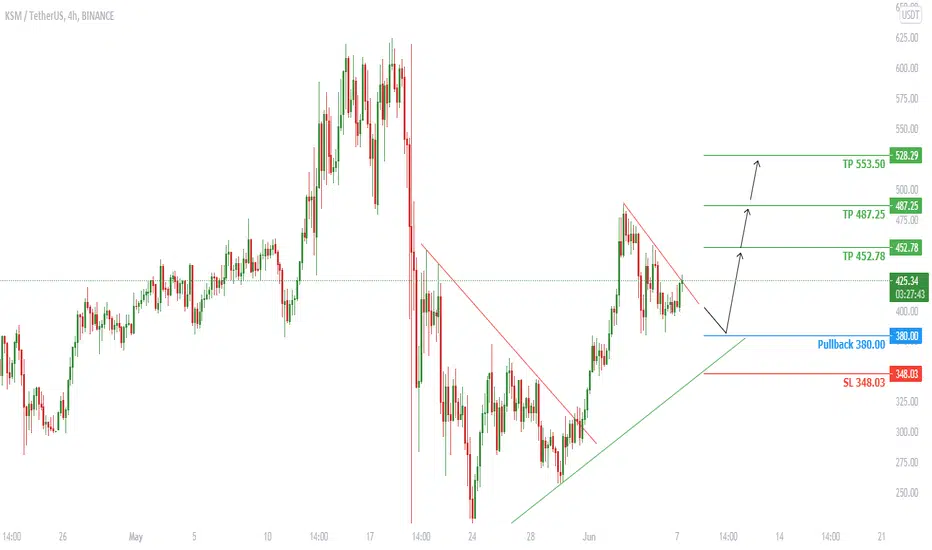
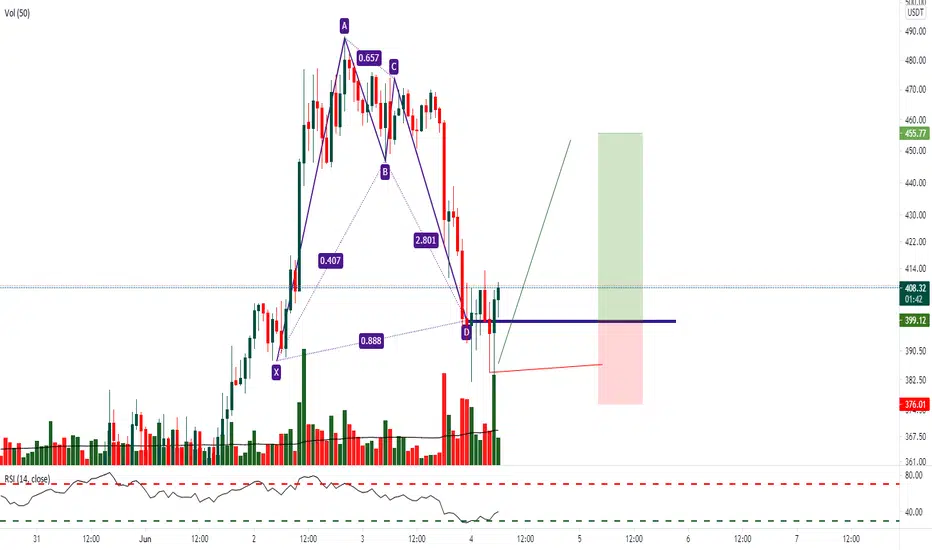
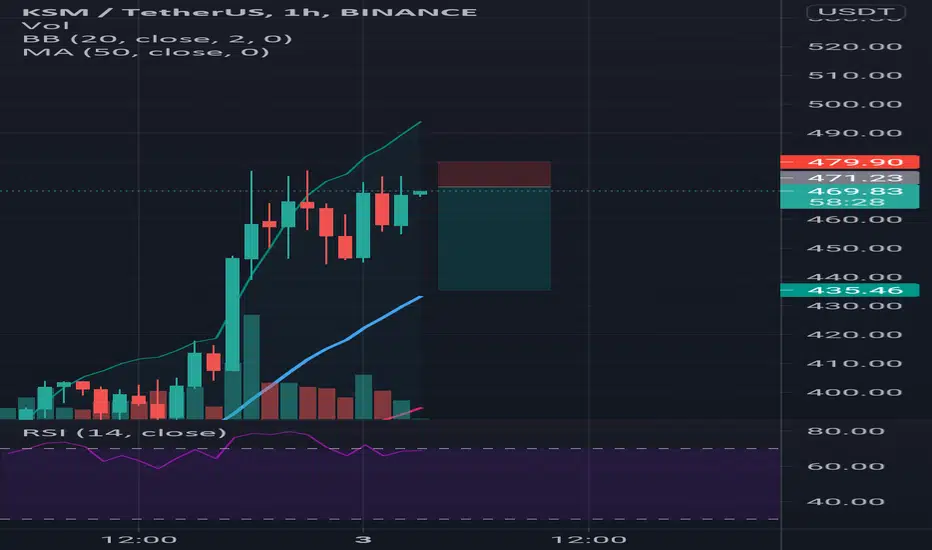
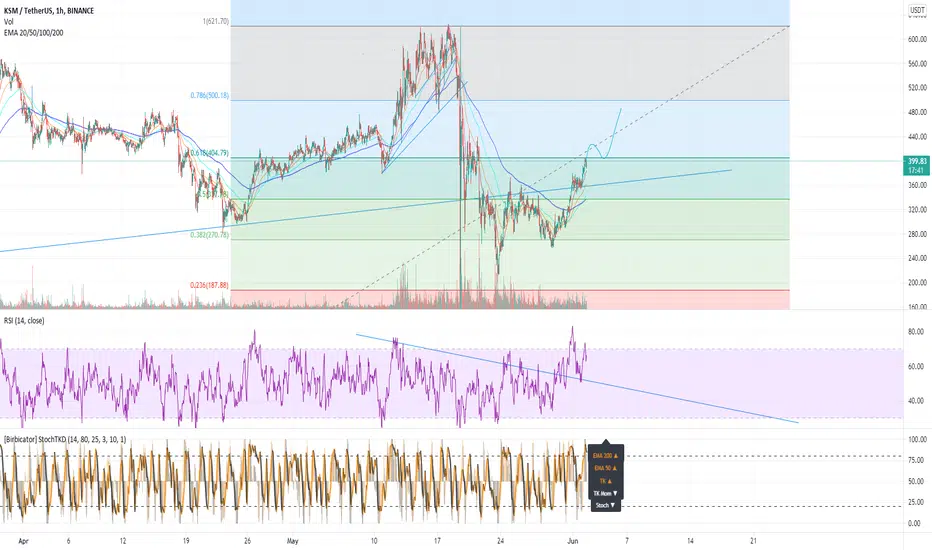
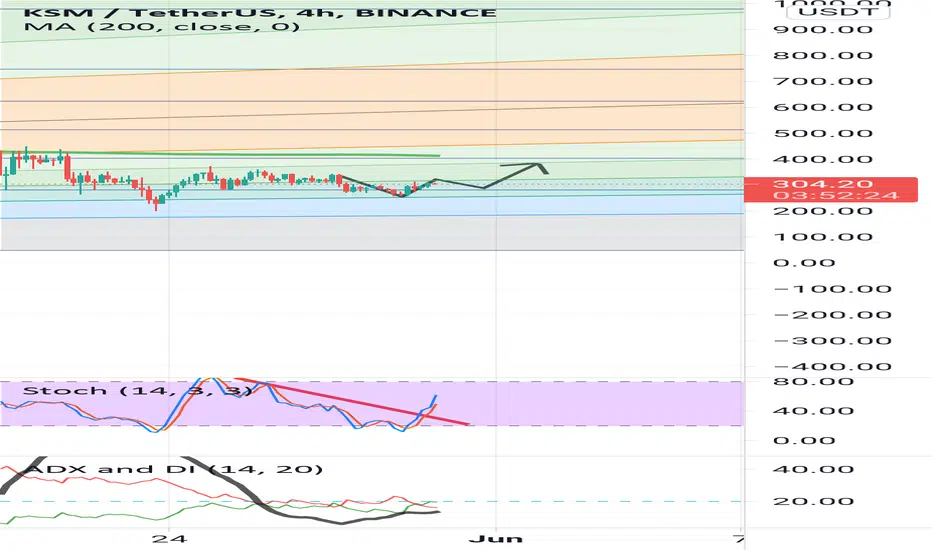
KSMUSDT Technical AnalysisKSMUSDT is in an uptrend and at 397.79 the Support area we have got a big Green candle which shows the Bulls have stepped in, however we might see a temporary Pullback at 380.00 but it's highly possible that the price goes up again after to Pullback to 452.78
SL @ 348.03
TP1 @ 452.78
TP2 @ 487.25
TP3 @ 553.50
KSMUSDT.P trade ideas
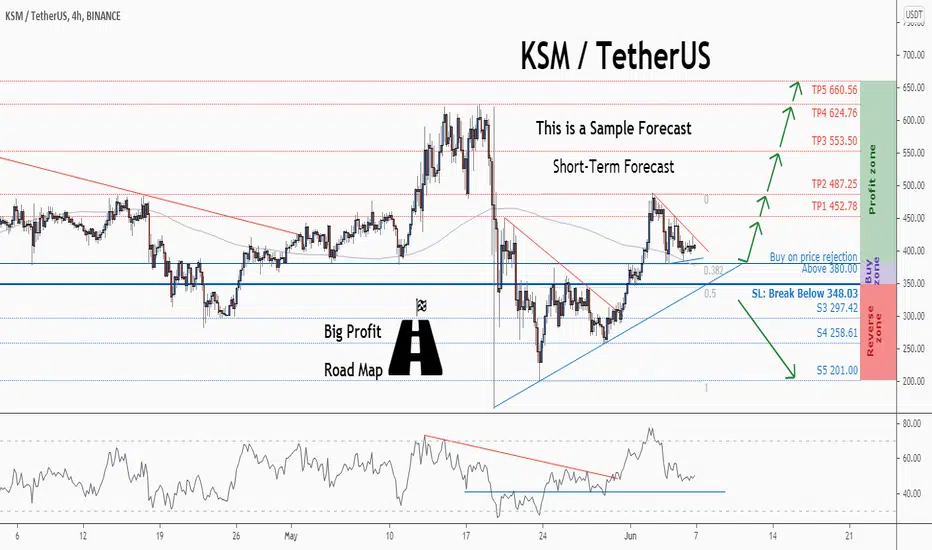
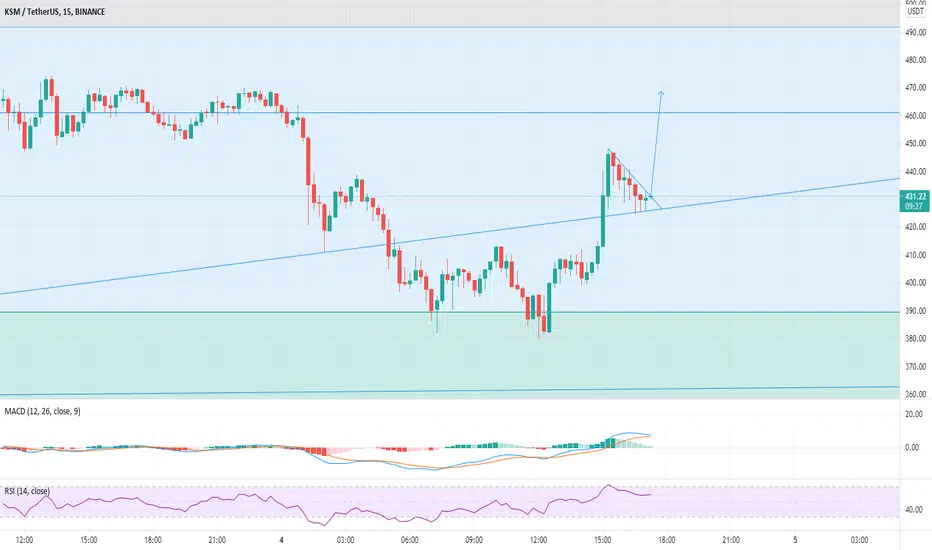
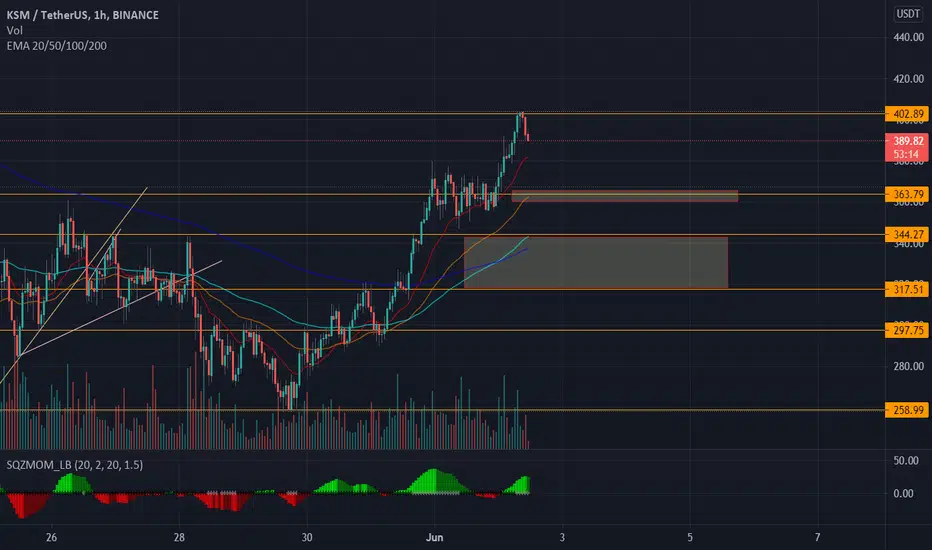
💡Don't miss the great buy opportunity in KSMUSD @kusamanetwork
Trading suggestion:
". There is a possibility of temporary retracement to the suggested support line (380.00).
. if so, traders can set orders based on Price Action and expect to reach short-term targets."
Technical analysis:
. KSMUSDT is in a range bound, and the beginning of an uptrend is expected.
. The price is above the 21-Day WEMA, which acts as a dynamic support.
. The RSI is at 50
Take Profits:
TP1= @ 452.78
TP2= @ 487.25
TP3= @ 553.50
TP4= @ 624.76
TP5= @ 660.56
SL= Break below S2
❤️ If you find this helpful and want more FREE forecasts in TradingView
. . . . . Please show your support back,
. . . . . . . . Hit the 👍 LIKE button,
. . . . . . . . . . Drop some feedback below in the comment!
❤️ Your Support is very much 🙏 appreciated!❤️
💎 Want us to help you become a better Forex / Crypto trader?
Now, It's your turn!
Be sure to leave a comment; let us know how you see this opportunity and forecast.
Trade well, ❤️
ForecastCity English Support Team ❤️
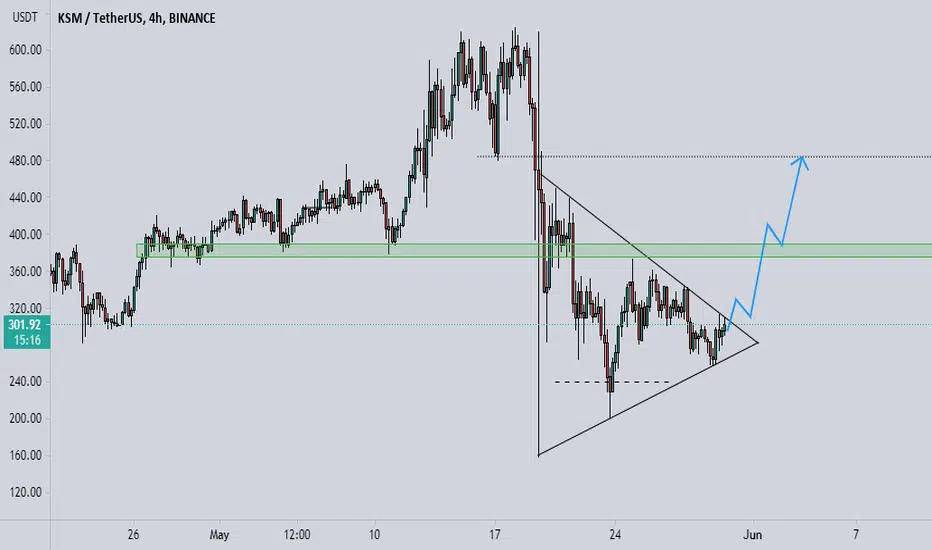
Kusama looks extremely bullish, if only BTC does not dumpWe have a W pattern (blue lines) that can also be viewed as a cup and handle (yellow lines)
If BTC don't dump and KSM breaks out of the yellow triangle the price target is at the ATH !
Fundamentally this coin deserves much bigger market cap, i am sure it will be more profitable than ADA and DOT, long term easy x10
If unfortunately BTC dumps a good price to buy KSM is at around the 200 D EMA level @ $267 that acted as a support.
Wish you the best, take care.

💡Don't miss the great buy opportunity in KSMUSDT @kusamanetwork
Trading suggestion:
". There is a possibility of temporary retracement to the suggested support line (380.00).
. if so, traders can set orders based on Price Action and expect to reach short-term targets."
Technical analysis:
. KSMUSDT is in a range bound, and the beginning of an uptrend is expected.
. The price is above the 21-Day WEMA, which acts as a dynamic support.
. The RSI is at 50
Take Profits:
TP1= @ 452.78
TP2= @ 487.25
TP3= @ 553.50
TP4= @ 624.76
TP5= @ 660.56
SL= Break below S2
❤️ If you find this helpful and want more FREE forecasts in TradingView
. . . . . Please show your support back,
. . . . . . . . Hit the 👍 LIKE button,
. . . . . . . . . . Drop some feedback below in the comment!
❤️ Your Support is very much 🙏 appreciated! ❤️
💎 Want us to help you become a better Forex / Crypto trader ?
Now, It's your turn !
Be sure to leave a comment; let us know how you see this opportunity and forecast.
Trade well, ❤️
ForecastCity English Support Team ❤️

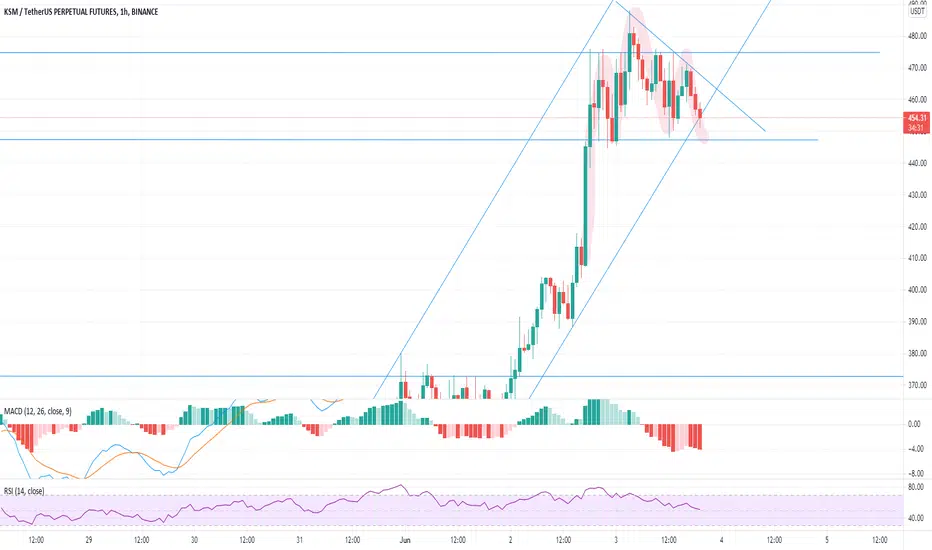
KSM dropI am expecting KSM to drop due the descending triangle pattern that has been formed during the last days.
Make sure to put a stop lose and see what is going to happen in the next days.
KSMUSDTBULLISH BAT
price need to follow Green Trend line & hit target
If price Breaks Red Trend line is where EXIT before SL hits
POTENTIAL BUY
Time to put some risk back on? Let's see this bird fly!DISCLAIMER: Trading Forex/Cryptocurrency involves risk and you may lose more money than you started with! These posts are not to be taken as financial advice and I offer NO guarantee that any of these ideas will result in profit. Also, trade ideas may change, depending on ever-changing market conditions. You are trading at your own risk and past performance is NOT indicative of future results. Please, know how much you are willing to risk on EVERY trade that you take and be SMART!
Simplify your trading. Always measure your risk and be okay with being wrong ; ) Wait patiently and get the price that you want. Use the market. Don't let the market use you!

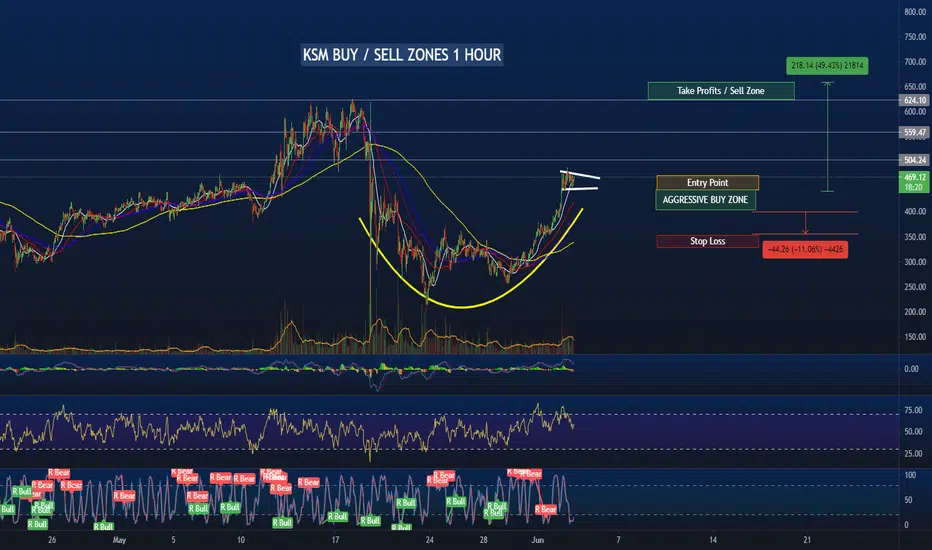
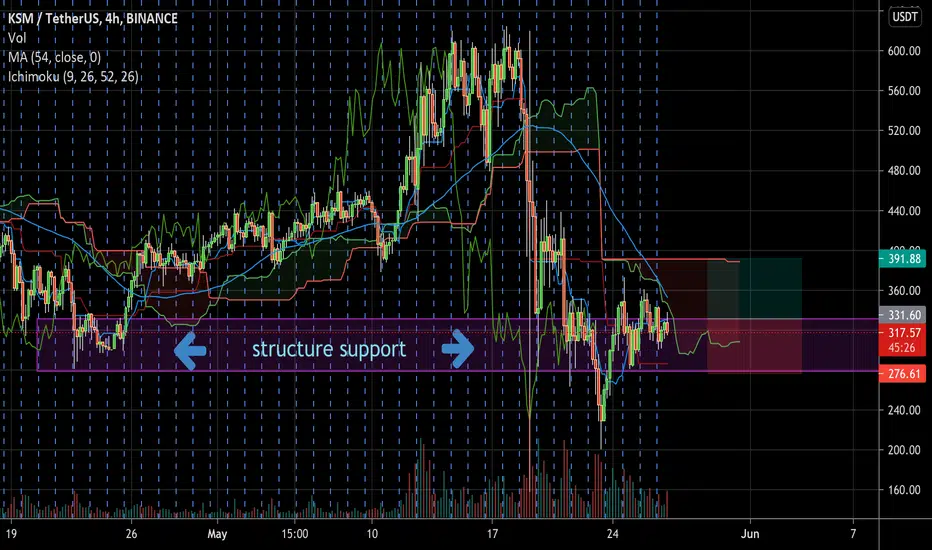
KSM BUY / SELL ZONES 1 HOURKSM BUY / SELL ZONES 1 HOUR check the end of the post for more calls etc.
Potential KSM trade 4HRJust trade the market dont be a bag holder.
1.618 and 2 for conservative and safer targets (what i'll be doing).
All of this depends on BTC....
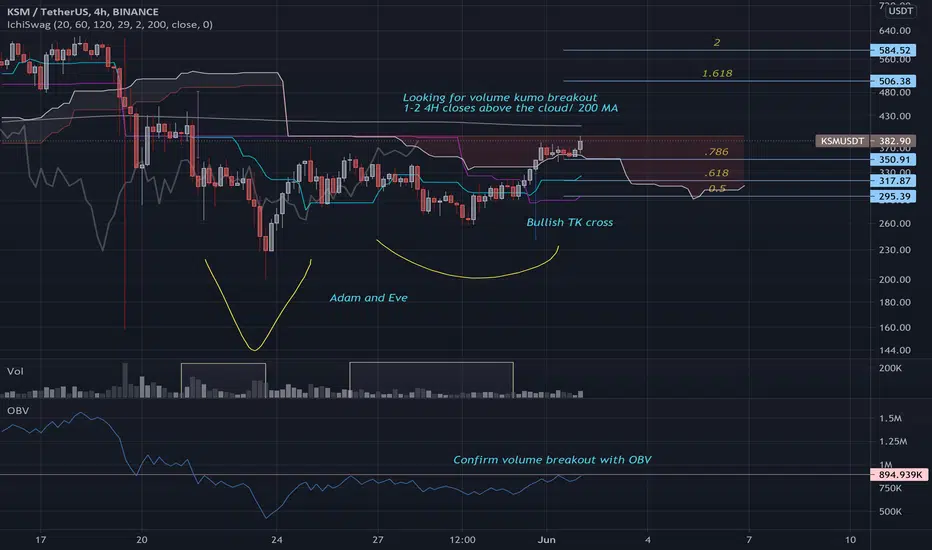
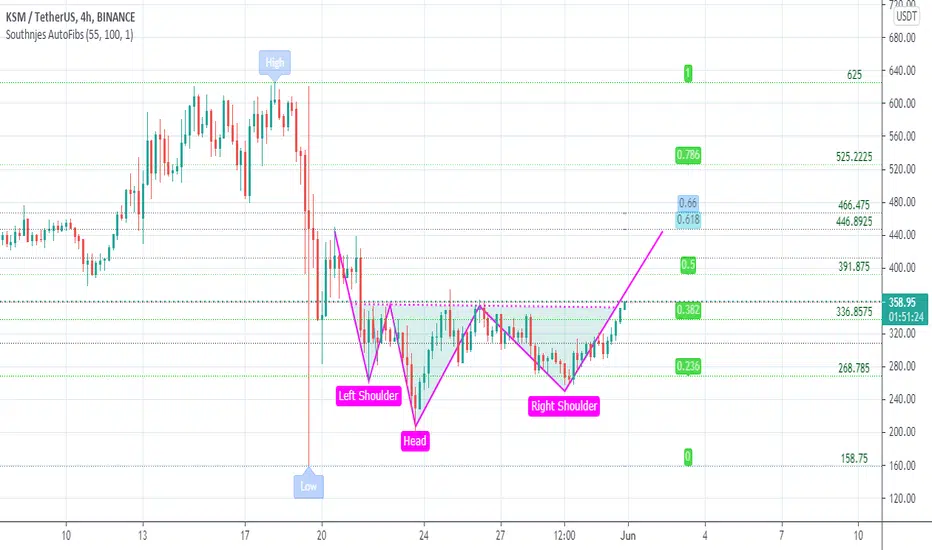
A possible Adam-EveHi traders,
The green areas are the resistance areas. You see the adam-eve formation. Under normal conditions, the target would be as higher as the depth of the formation. However, the volatility in BTC will not allow us to wait for the target. So,
Always TP at resistances.
Stay safe and healthy ^^.
KSM shortKsm if facing overhead resistance at 618 Fibonacci level, a confirmed breakdown could lead us to approx $338
KSM longKsm is facing overhead resistance at 618 fibonacci level, a confimed breakout above 404.5 could lead us to $500.
KSM dropHello guys, I hope you are all right.
I am expecting a drop for KSM in the next few days that will pull it back to 360 or even 340 if the sellers are going crazy.
I would suggest you to do not buy any Altcoins right now due the small adjustment that is going to happen in the next few days.
ksmusdtThis is my personal view of this currency - also the market has high risks. If you do not know anything about these risks, I do not advise you to enter or exit any deals - and you bear responsibility for that -
Please support the idea by clicking the like button and expressing your opinion in the comment box
Leave a comment that is helpful or encouraging. Let's master the markets together
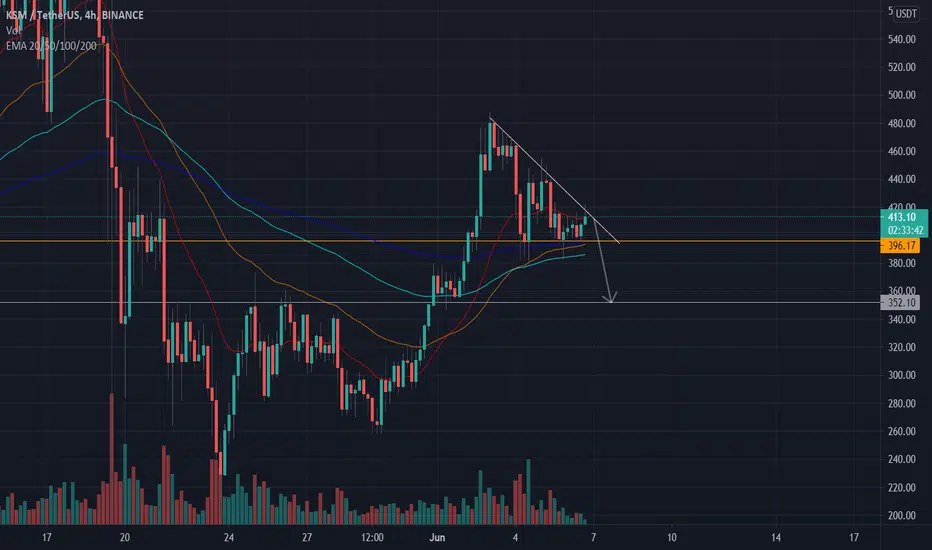
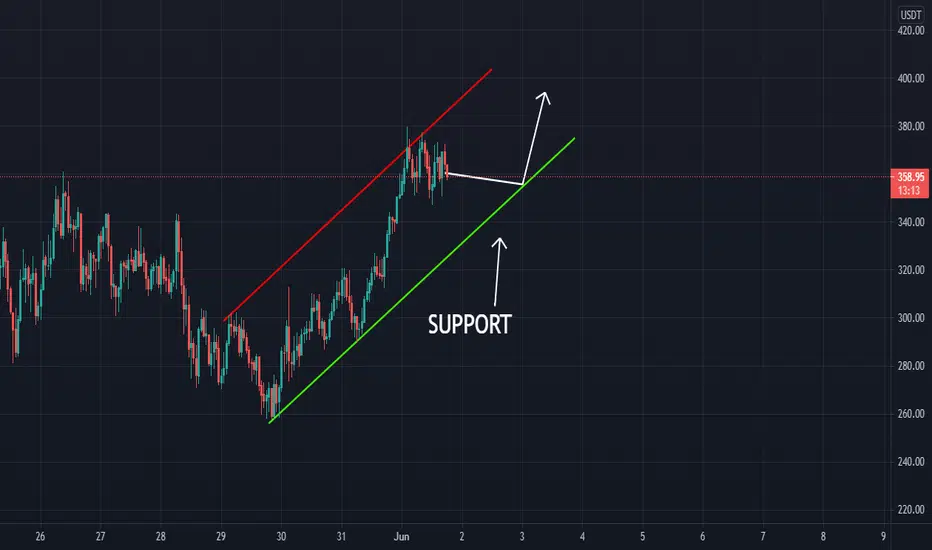
KSMUSDT - LONG SETUPKSM is in a short term downtrend... but is consolidating in this wedge formation if we see a break above the descending trendline the continuation to the upside will follow.
KSM interesting 4 hour chart look left
red candle opportunity to get a position
tp
360
tp
390
use daily FV
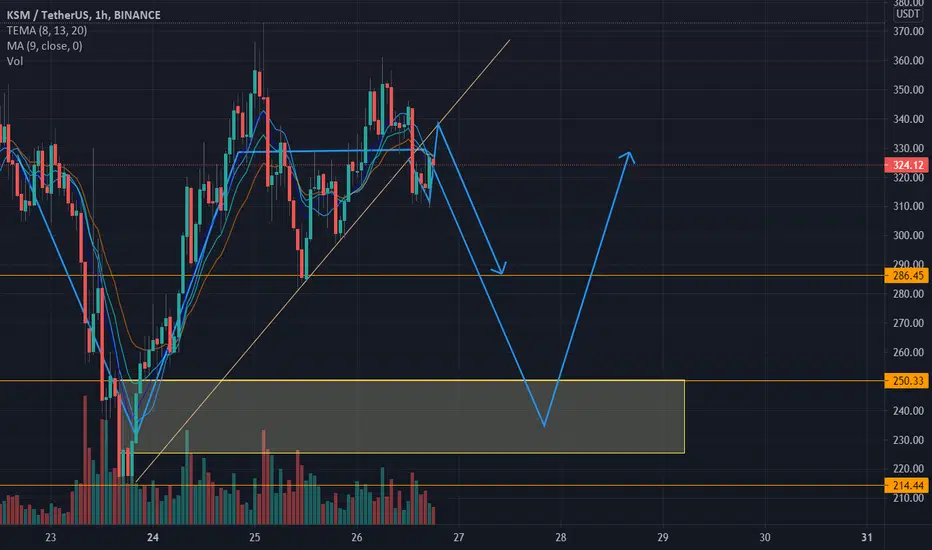
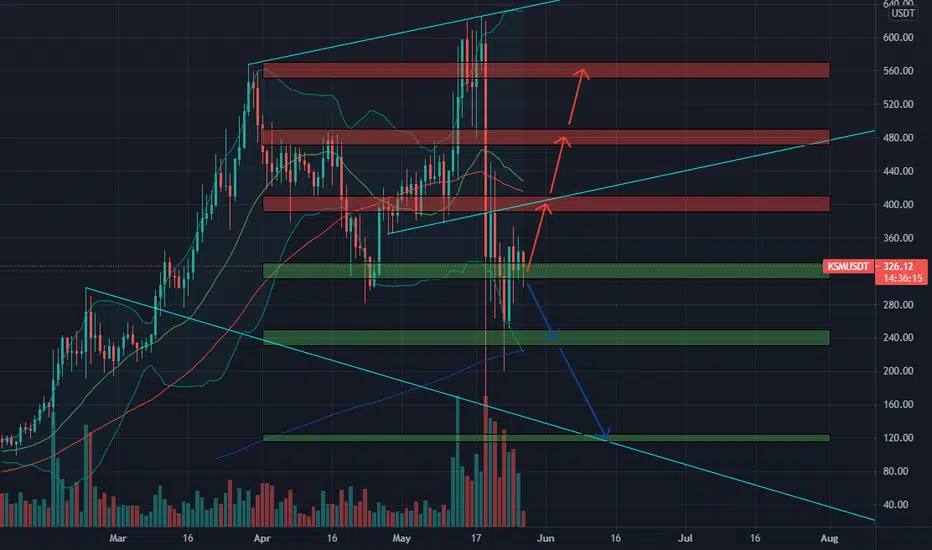
🆓Kusama (KSM) May-27 #KSM $KSMKSM has conquered the 320$ zone and is heading to 400$, 480$, and 560$ zone. But if it loses this 320$ zone again, it will have a big decline to 240$ or even 120$ zone in June
📈BUY
-Buy: 310-330$. SL if B
-Buy: 390-410$ if A. SL if B
📉SELL
-Sell: 390-410$. SL if A
-Sell: 470-490$. SL if A
-Sell: 550-570$. SL if A
♻️BACK-UP
-Sell: 310-330$ if B. SL if A
-Buy: 230-250$ if A. SL if B
-Sell: 230-250$ if B. SL if A
-Buy: 115-125$. SL if B
❓Details
🕯Timeframe : 1 Day
📈Red Arrow : Main Direction as BUY and SELL section
📉Blue Arrow : Back-Up Direction as BACK-UP section
🟩Green zone : Support zone as BUY section
🟥Red zone : Resistance zone as SELL section
🅰️A : The Close price of candlestick is Above the zone
🅱️B : The Close price of candlestick is Below the zone
KSM future profitHaving a look to the different charts we can see how BTC is having a bad time trying to overcome the trading line and keep its way to 42k. If BTC drops the alts drop. That is why looking at KSM I can see some free profit as soon as it touches the support I marked on the chart. After it reaches the first support we can buy, setting a stop loss just under that line trying to avoid any potential lose if KSM decides to drop to the next support following the bigger pattern. For any questions feel free to ask !