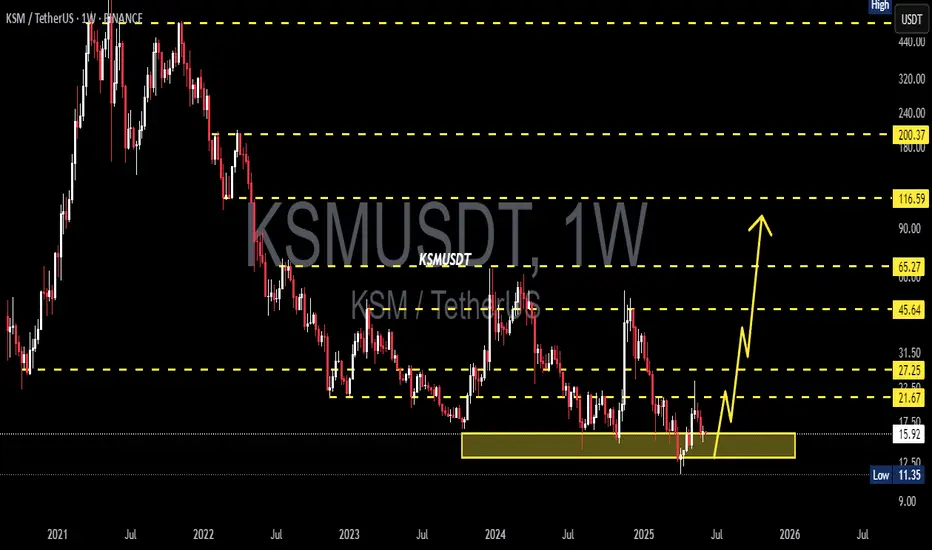
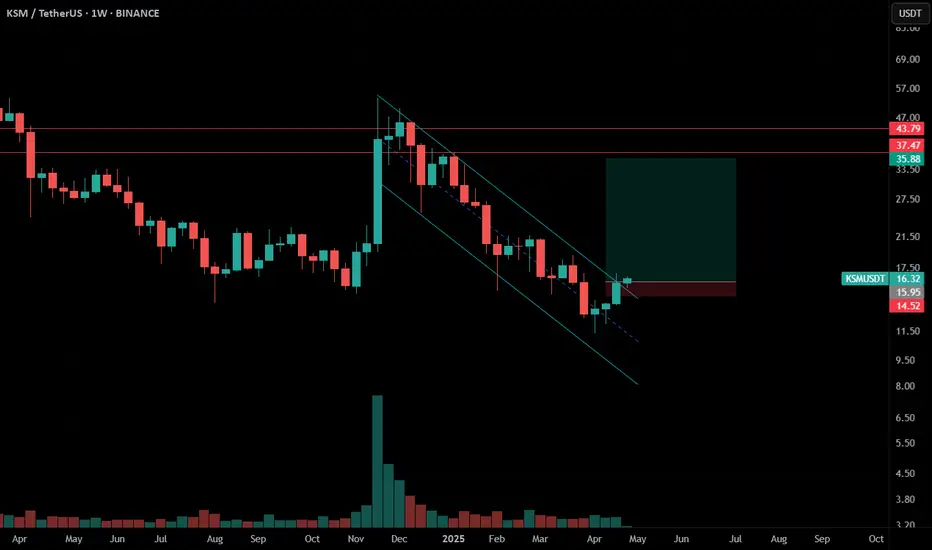
KSMUSDT 1W AnalysisKSM ~ 1W Analysis
#KSM Buy back gradually from here if you still have confidence in this coin with a short term target of 20%+ from here.
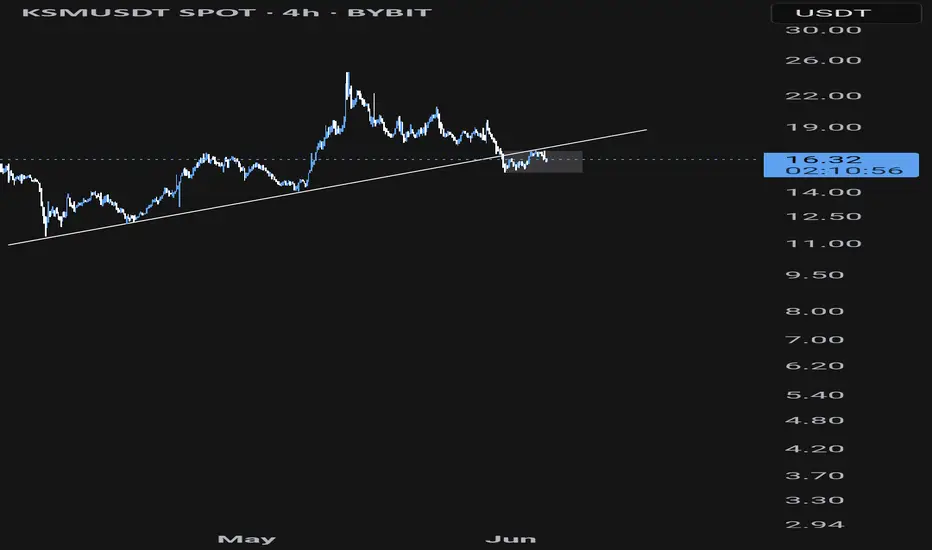
KSM/USDT Market OutlookKSM/USDT Market Outlook
KSM/USDT has confirmed a breakdown below the $16.40 level and is now consolidating within the $15.00 – $16.00 range.
We recommend waiting for a decisive move out of this zone
• A breakout above $16.00 may open up a long opportunity.
• A breakdown below $15.00 would likely
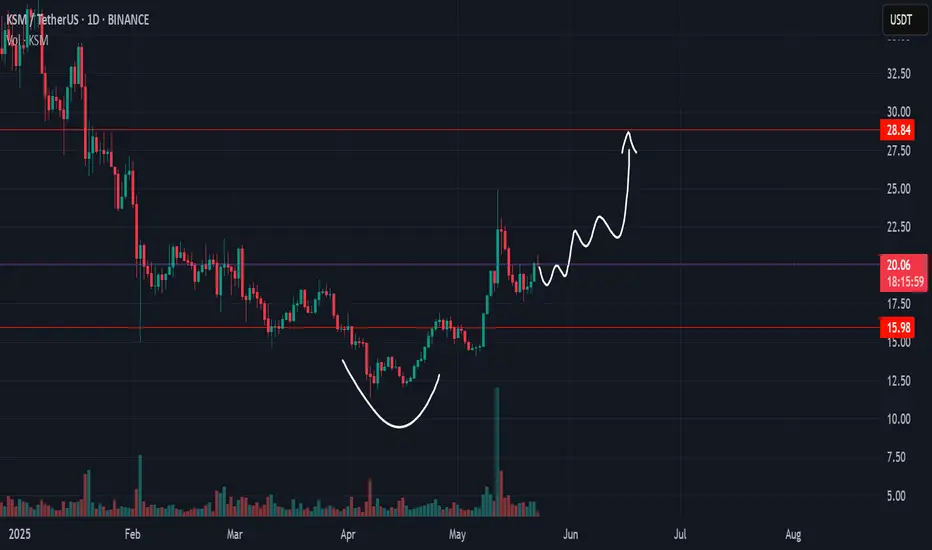
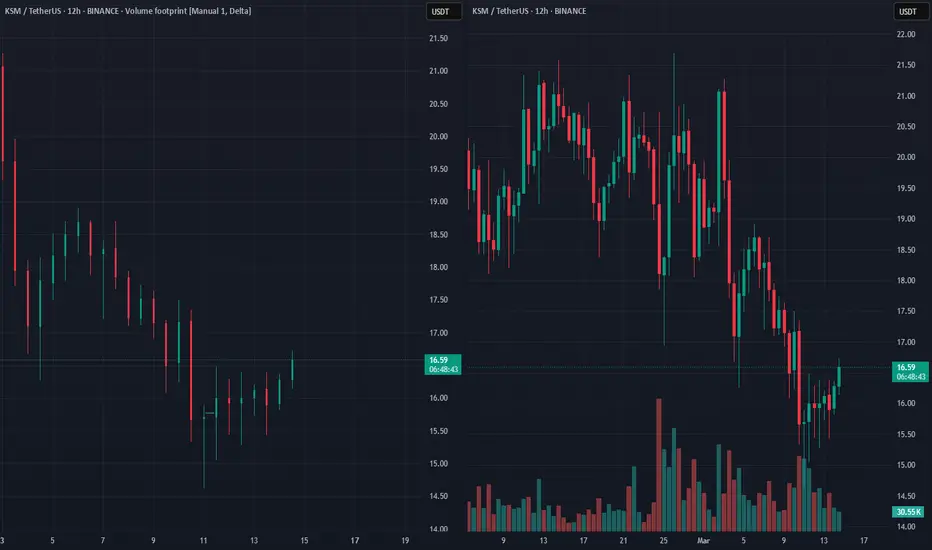
KSM Shakeout RetailKSM doing fakeout under $15 and back to the range above $15
THen now create higher low, i think $28 is easy target
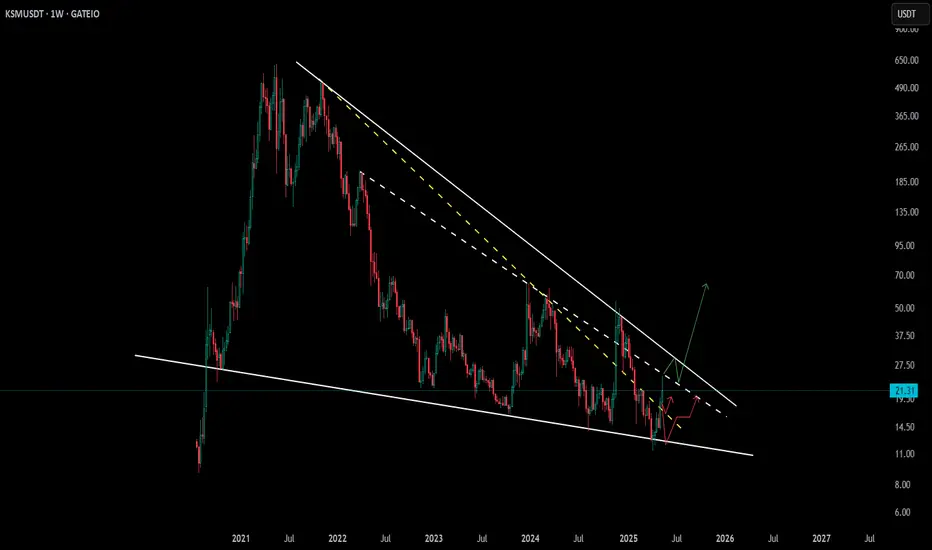
KSM Weekly Setup – Breakout Building or More Chop Ahead?🔥 KSM – Breakout or Retest?
🕰️ Weekly Chart: Still holding within a falling wedge—a bullish structure with breakout potential. 👀
📅 Daily Chart: Recently broke out of an ascending channel and is now retesting the support zone.
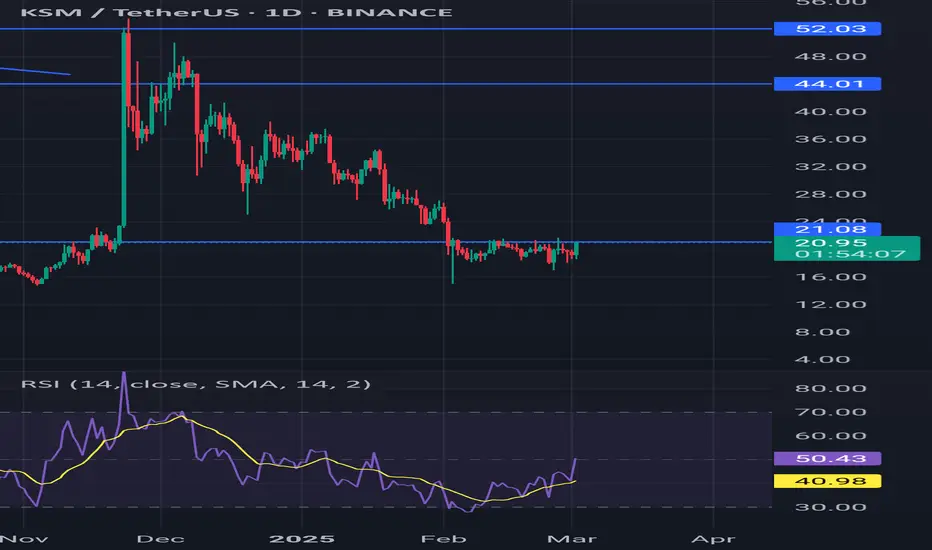
📍 Key Support: 19.8 – 21.17
📍 Resistance Zone: 23.3 – 26.9
⚡ A solid bo
ksm break out ksm is promising. I'll try a long posıtıon. if market let it, we will see some green candles
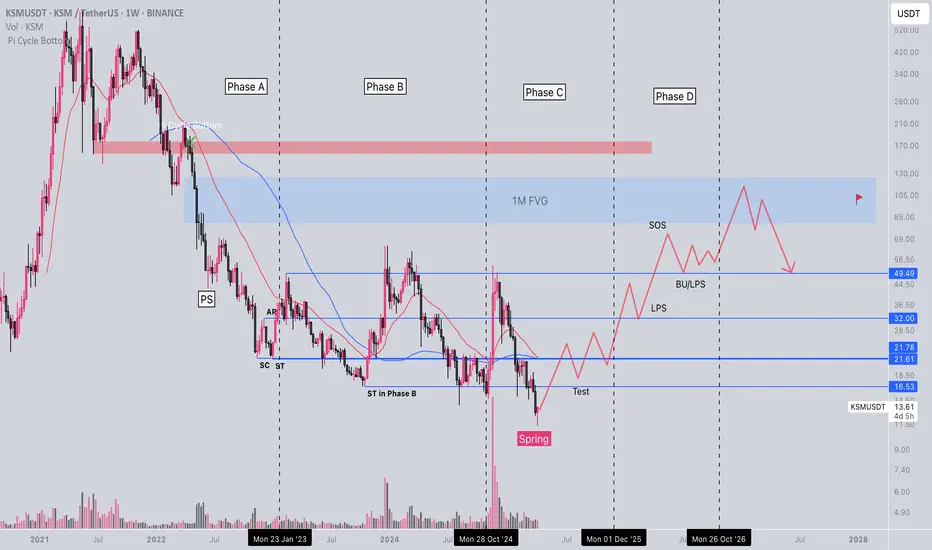
KSM in a Accumulation Wyckoff EventKSM is ready to be bought.
Context:
PS—preliminary support, where substantial buying begins to provide pronounced support after a prolonged down-move. Volume increases and price spread widens, signaling that the down-move may be approaching its end.
SC—selling climax, the point at which widening
KSM Scalp BUY PositionBeen on the Desk Today for Long.
Longing this here under 17.150 for a scalp toward 17.600 and 17.800.
stop loss 17.020.
Note: Not a Financial Advise.

KSMUSDT 1WKSM ~ 1W Analysis
#KSM Buy gradually from here with a short -term target of at least 20%+. This is the lowest support for now.
SPOT KSM LONG 14.03.2025Pinning after abnormal purchases.
💰I enter at the market price.
I'll let you know when I record it manually.
‼️Risk per trade: 1% of the allocated funds for spot trading.
Thank you!
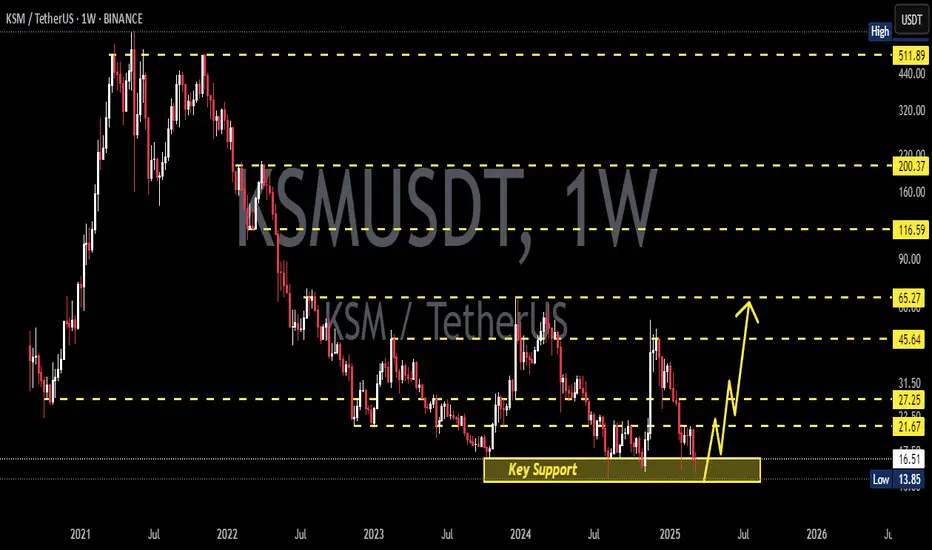
Ksm ready to fly Obviously, the entire market turn bullish
Ksm trying to break the resistance line
The resistant line is so weak, for the past 2 weeks ksm try to break it six times
This a strong signal that we going to see the 40$ target 🎯
Monday is the first day of the market
Good luck
See all ideas
Summarizing what the indicators are suggesting.
Oscillators
Neutral
SellBuy
Strong sellStrong buy
Strong sellSellNeutralBuyStrong buy
Oscillators
Neutral
SellBuy
Strong sellStrong buy
Strong sellSellNeutralBuyStrong buy
Summary
Neutral
SellBuy
Strong sellStrong buy
Strong sellSellNeutralBuyStrong buy
Summary
Neutral
SellBuy
Strong sellStrong buy
Strong sellSellNeutralBuyStrong buy
Summary
Neutral
SellBuy
Strong sellStrong buy
Strong sellSellNeutralBuyStrong buy
Moving Averages
Neutral
SellBuy
Strong sellStrong buy
Strong sellSellNeutralBuyStrong buy
Moving Averages
Neutral
SellBuy
Strong sellStrong buy
Strong sellSellNeutralBuyStrong buy
Displays a symbol's price movements over previous years to identify recurring trends.