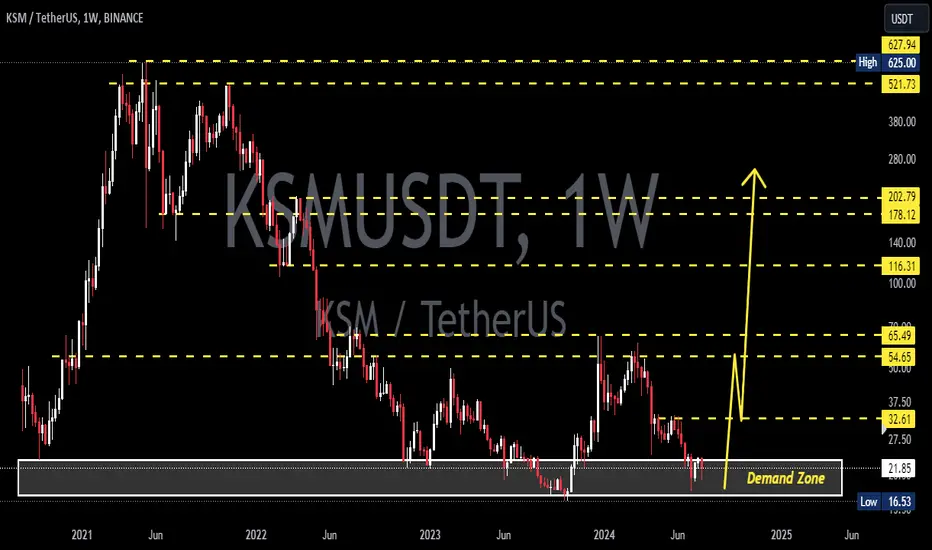
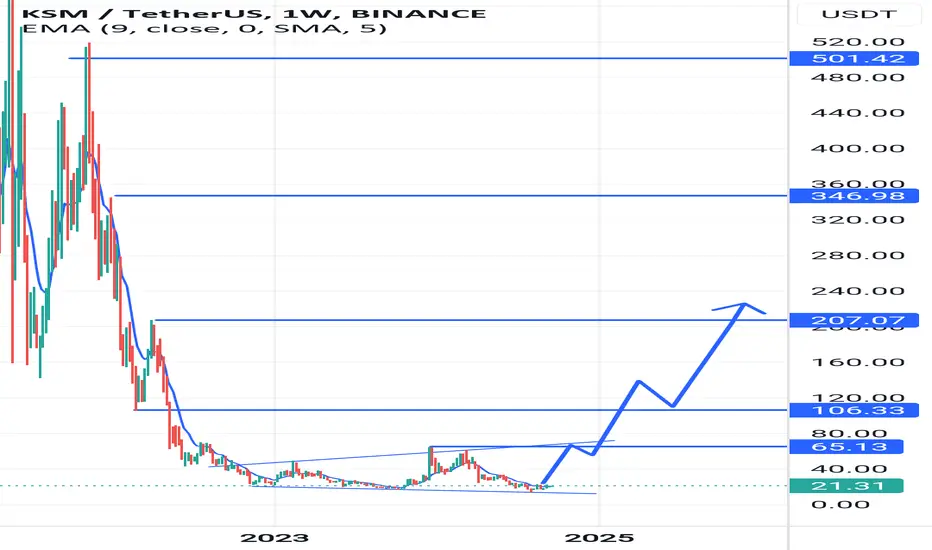
Kusama vs Tether | The Bottom? Let Me Explain...In early August 2024 Kusama (KSMUSDT) hit its lowest price since August 2020, four years ago. Plain and simple; regardless of what happens next, this pair has potential for growth.
The low that was hit in August 2024 went below (lower) than the low that was hit in October 2023, which preceded the recovery year minor bullish wave. This means that all gains from this wave were completely removed.
If you compare this pair to Solana, or Binance Coin, or Toncoin; to name a few, you can see a huge difference.
Look at Tron, right now... Go ahead, I'll wait.
Set up the weekly timeframe and zoom-out.
What do you see?
➖ TRXUSDT is trading near its All-Time High.
Now look at Kusama and set up the weekly timeframe, what do you see?
It just hit the lowest price in four years recently and it is trading right above a strong 2023 support.
It doesn't matter what will happen next, consider this as a successful trader/buyer; one is trading pretty high and the other is pretty low.
For my people, for my followers, for my readers, for my supporters, I tend to choose those trading low for bullish potential.
Those high, I recommend for selling (SHORT).
Those low, like this one, I recommend my people to buy or go LONG.
With this simple method; buy low, sell high; we can achieve an extremely high level of success.
That's because we are keeping it simple and simple is best.
➖ If prices drop some more, think long-term.
➖ If you buy at the top and prices drop, you can might be in for a long, long wait.
I am just sharing my experience with you and I hope you find this information useful... You don't have to learn it, to use it or apply it, I will continue to do the charts and numbers for you. But knowledge is power, and knowing this gives you the behind the scenes of what I do.
It is my pleasure to share my experience with you.
Thanks a lot for your continued support.
Everyday, I am learning more and more.
"Day by day in every way, I am becoming more successful."
Repeat this affirmation daily, it will remove subconscious blocks that might be preventing you from getting ahead.
"Day by day in every way, I am becoming more successful."
Thank you for reading.
Namaste.
KSMUSDT.PS trade ideas

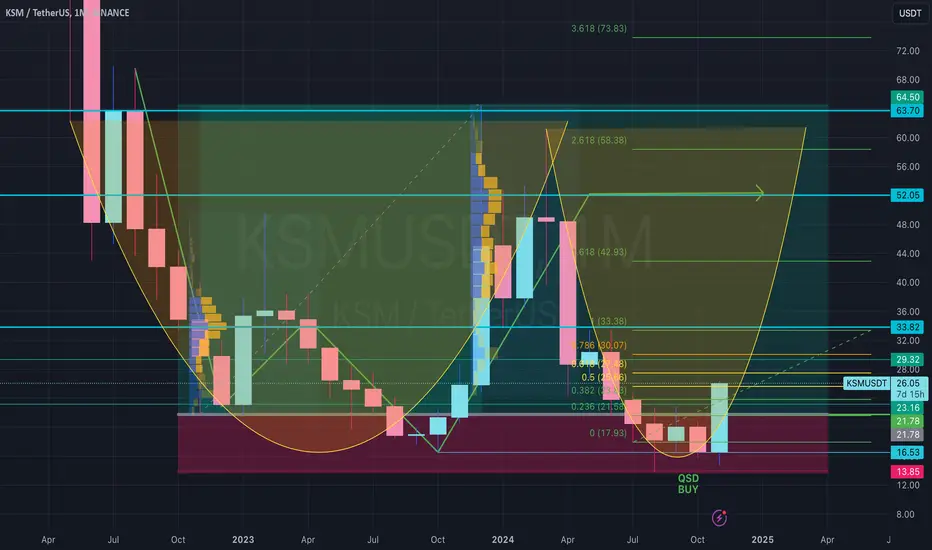
KSMUSDT feels like Its just the Beginning, Great Buying Setup Another QSD Bounce in Play at the moment
but we all know this one
how quickly it moved up last cycle
A hidden GEM, no-one is talking about
Again a Range trade for now
but also may be a very good entry for the 3 digit zone
Like have a look at my analysis of RAYUSDT, it did 0.24->0.42 then 2.4->4.2 now we wait 24->42
Some thing like that possible here
Based on QS setup
We have a perfect slice from 32->52 VAH for Left shoulder and the last HH made.
But there is also our fav slice zone that extends beyond this range
which is a slice from 22->62 ( last wick tops ) with a SL of 007
and as its a QSD and not Just QS we expect HH wrt previous wick highs @62
So if we manage to take keep and secure this entry and Big Brother BTC is kind with us
The sky is open for us
Next trades
62->92->102 CnH BO Targets
110->220
and then our 220->620 Range
Are we Ready
BOOM !!!!!!
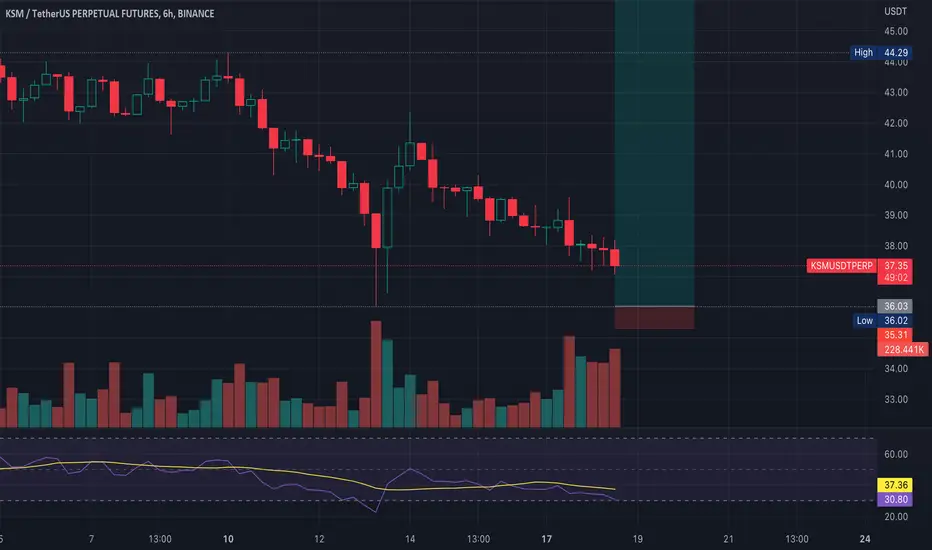
KSMUSDTPIf there was a race amongst the alts for who fills their October CPI dip wicks from last week, KSM could easily lay claim to the finish banner easily. I expect a total mitigation of that wick, where a 6hr support and a demand zone is nestled, and a hopeful burst of energy towards June 2022's high around $89. I expect this to be a swing that would surely have its twists along the way.
We'll see how long it takes to play out.
KSM\USDT 1D chartThe price is moving through the accumulation Chanel. It’s the 4th day of consolidation . Targets 28$, 32$, 51$
Is Kusama KSM Able To Reach ATH in 2025?Hello, Skyrexians!
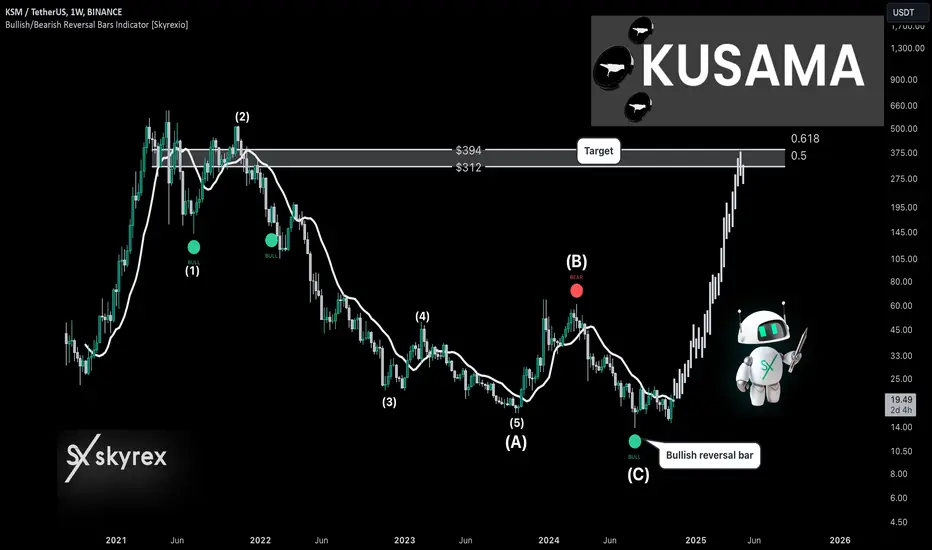
We continue analyze different altcoins for the potential altseason. Today it's time for BINANCE:KSMUSDT . We are sure that you have already forgot this coin, but in our opinion it has a great chance to show significant gains in 2025.
Let's take a look at the weekly time frame. We can see that bear market was severe for Kusama and it has broken the previous bull run bottom. It means that this asset has very low probability to hit ATH, but 0.618 Fibonacci zone between $312 and $394 can be potentially reached. For sure, this coin is in global downtrend, so risk of investment in it is much higher than in uptrend coins.
We can see that corrective zigzag ABC could be already finished. Wave A was impulsive, consists of 5 waves, wave B was a zigzag which was stopped by the red dot on Bullish/Bearish Reversal Bar Indicator . Now we can see the green dot which is very strong long signal, so reversal is likely happening right now.
Best regards,
Skyrexio Team
___________________________________________________________
Please, boost this article and subscribe our page if you like analysis!
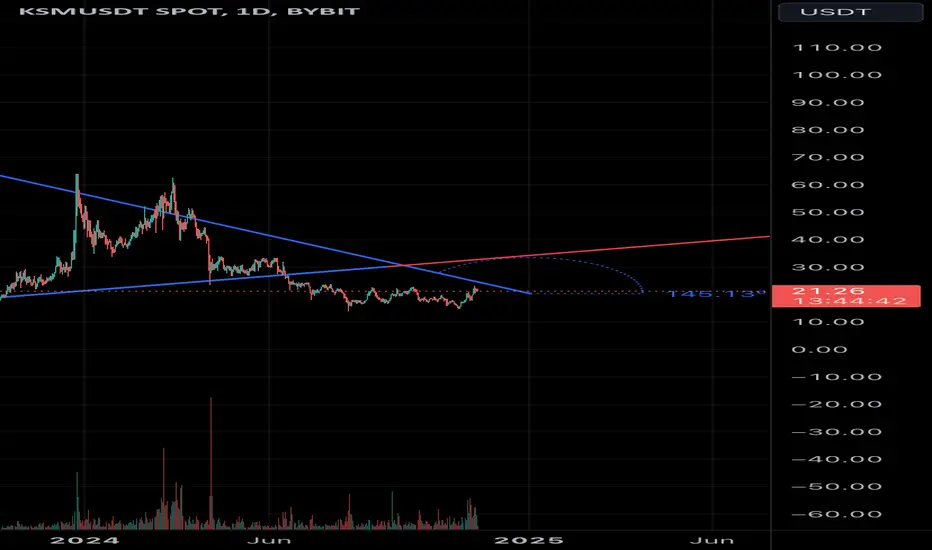
Kusama Taget 24$ ,28$, 32$ Kusama KSM /usdt is consolidating at the channel , Support 18,60$ worked nice and the price above 23$ would skyrocket the price at the second Chanel at the price of 32$.
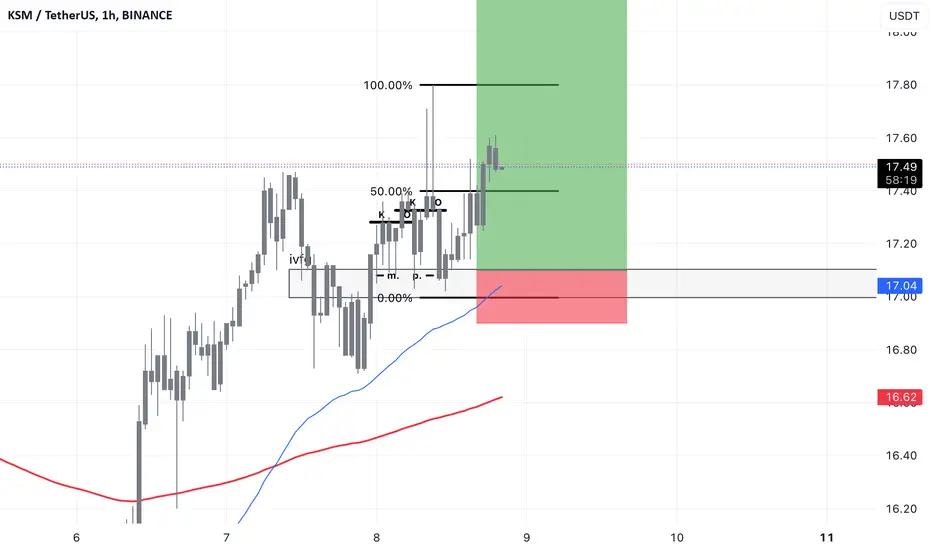
IVFG - long KSM (FOMO)slightly affected by usd news
no holiday
Inverse FVG
Kill the open twice with manipulation
traded back to inv fvg range for entry
potential 2nd reentry LONG KSMUSDTKSM USDT show new FVG in refined timeframe
same principle,,FVG,kill open twice with manipulation

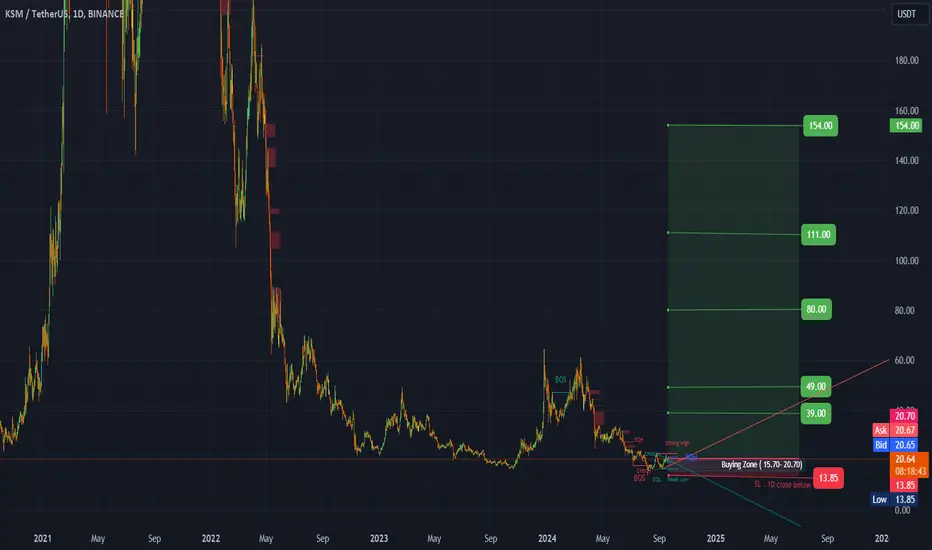
#KSM (SPOT) entry range (15.70- 20.70) T.(154) SL(13.85)BINANCE:KSMUSDT
entry range (15.70- 20.70)
Target1 (39)- Target2 (49)- Target3 (80)-Target4 (111)-Target5 (154)
SL .1D close below (13.85)
**NOTES***
1* this coin is very heavy, it may take long time to achieve the targets and the targets is for the BULL RUN
2* collect the coin slowly in the entry range ( do not all in one time in one price )
**** #Manta ,#OMNI, #DYM, #AI, #IO, #XAI , #ACE #NFP #RAD #WLD #ORDI #BLUR #SUI #Voxel #AEVO #VITE #APE #RDNT #FLUX #NMR #VANRY #TRB #HBAR #DGB #XEC #ERN #ALT #IO #ACA #HIVE #ASTR #ARDR #PIXEL #LTO #AERGO #SCRT #ATA #HOOK #FLOW #KSM ****
KSMUSDTKSM ~ 1W
#KSM This is the lowest support Block on the 1W Time Frame.
If you still have Conviction on this coin,. You can make purchases from here. at least for a profit of at least 20%++

KSMUSDTKSM ~ 1W
#KSM This is the lowest support Block on the 1W Time Frame.
If you still have Conviction on this coin,. You can make purchases from here. at least for a profit of at least 20%++

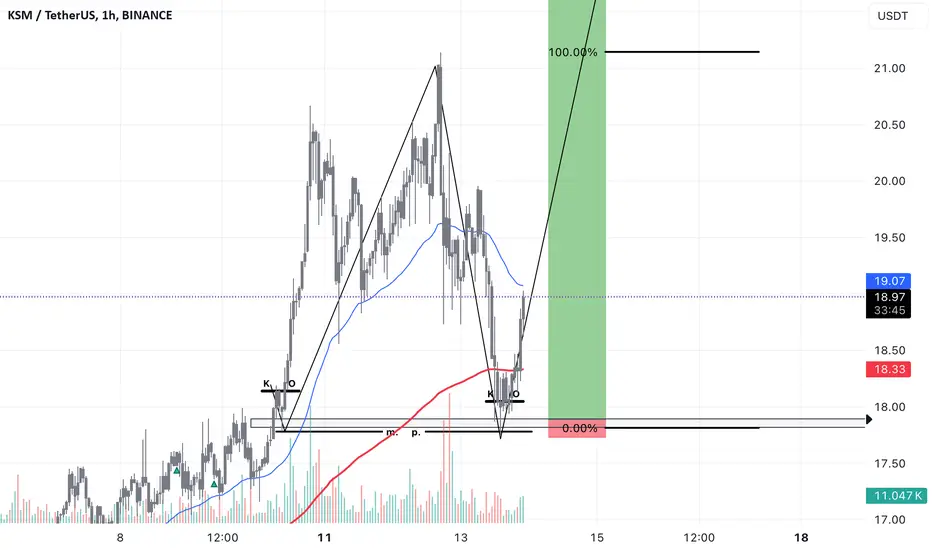
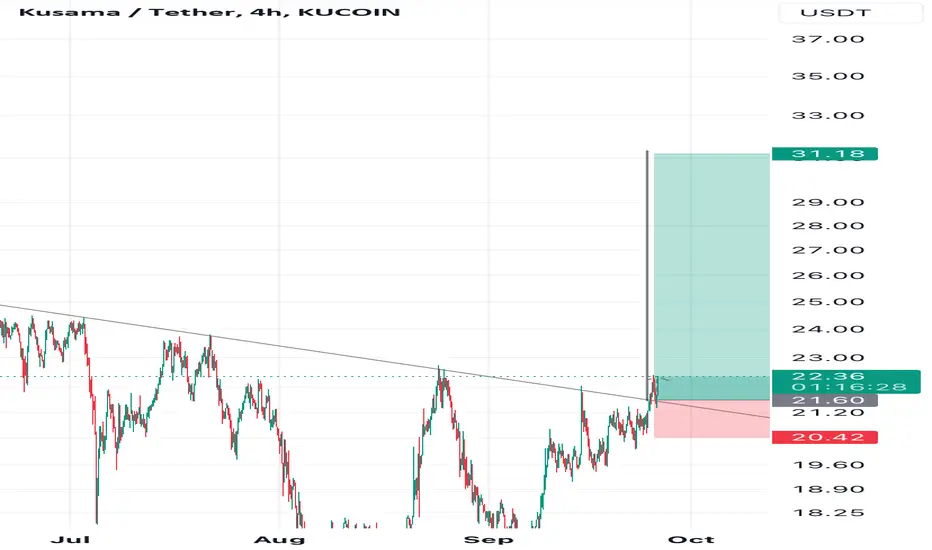
Potential Bullish Pattern- Entry: $18.00
- Stop Loss: $16.50
- Take Profit Levels: $20.00, $22.50, $25.00
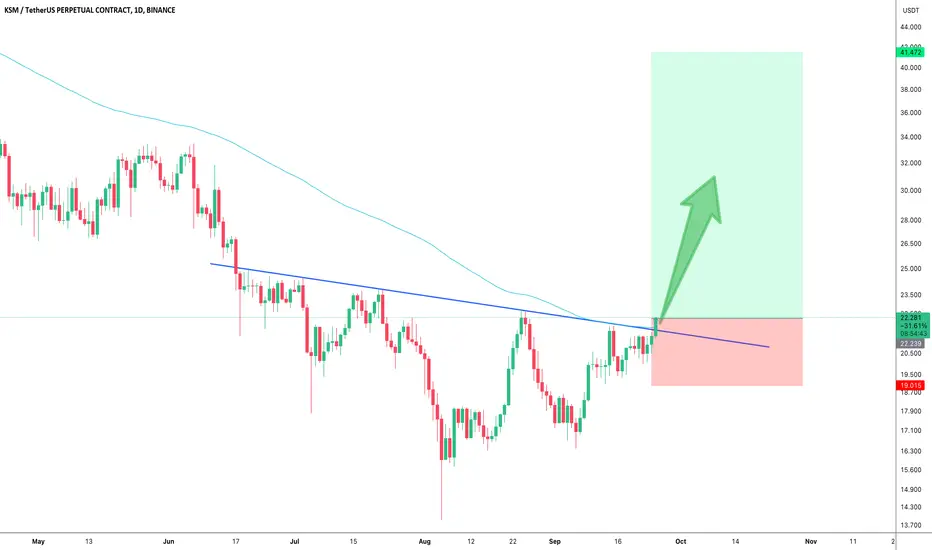
KSM set to explode KSM has finally broken the head and shoulder pattern and it’s ready to explode to the upside.
KSMUSDT Reversing from the BottomKSMUSDT technical analysis update
KSM's price has broken the resistance line and formed a bullish head and shoulders pattern. It is now breaking the neckline resistance and has crossed above the 100 EMA on the daily chart. We can expect a strong bullish move in the coming days.
Regards
Hexa
KsmusdtGolden chip
For 2025 bull run
KSMUSDT
5x 10x 25x Choose Your Own 🎯
Stop 13$ necessary
Only for spot traders
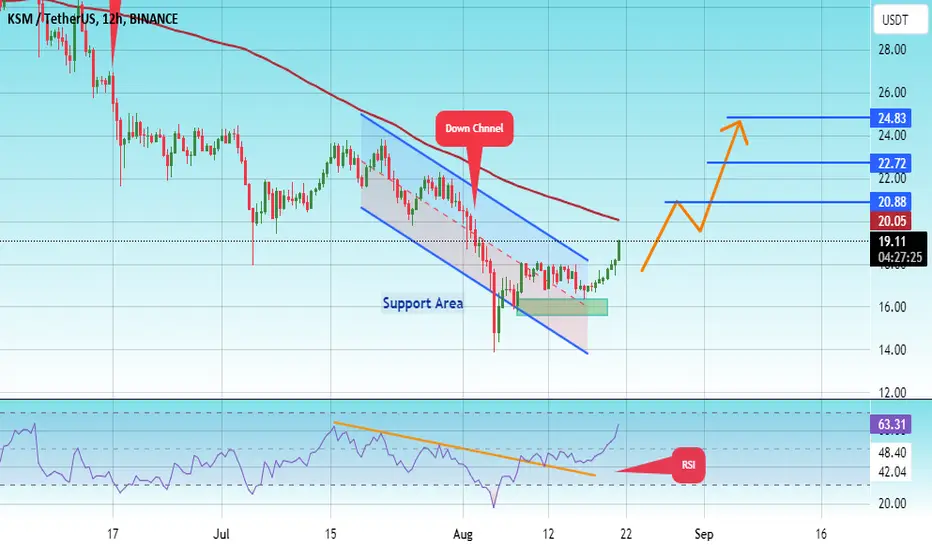
#KSM/USDT#KSM
The price is moving in a descending channel on the 12-hour frame and is sticking to it very well and is expected to break it upwards
We have a bounce from a major support area in green at 16.00
We have a downtrend on the RSI indicator that was broken upwards which supports the rise
We have a trend to stabilize above the 100 moving average which supports the rise
Entry price 18.00
First target 20.88
Second target 22.72
Third target 24.83
Breakout Alert: KSM Surges as Falling Wedge Pattern Shatters!🚨 NYSE:KSM is breaking out of a Falling Wedge pattern on the 1D chart, which is typically a bullish reversal signal.
📈 Entry Point: $20.00 to $22.00
🎯 Targets:
$26.93
$33.75
$49.80
$64.13
🔄 Trading Options: NYSE:KSM is available for trading in both spot and futures markets. You can purchase it on the spot market, or if you prefer to go long on futures, consider setting a stop-loss at $18.00.
📊 About NYSE:KSM :
KSM (Kusama) is a scalable, multichain network for radical innovation in the blockchain space. It serves as a testing ground for Polkadot, offering developers the opportunity to experiment and fine-tune their projects before deploying them on Polkadot’s main network.
📢 DYOR, NFA

Kusama | Altcoins Market Dynamics Pt 2 (Accumulation Phase Exp.)Did you read Theta Token's trade idea? "Altcoins Market Dynamics."
Here is the big difference between Theta Token and Kusama; the dynamic is the same, a major bullish wave followed by a strong correction. The huge difference is that THETAUSDT found support around the price level it traded at in January 2024 while KSMUSDT hit a lower low at around the same price level it traded in October 2023.
➢ While one left room open for much lower, the other one corrected the entire bullish move beyond 100%.
The later has less risk, more room for growth; the former becomes more tricky right now, riskier to trade. Both are good from a short-term bullish perspective, but the dynamics can have strong variations for the long-term.
Now, we are still in August and have four months left before the major 2025 bull-market starts. We can expect a classic accumulation phase soon.
➢ Here is what can happen, Kusama, and other cryptocurrency trading pairs, can produce a bullish wave lasting 1-2 months and then correct back-down to produce a higher low and several months of "sideways," activating the accumulation zone. This sideways action would happen around the price range that I pointed out in the "Pre-2025 Bull-Market Series." That is all I have to say.
We will experience a bullish wave, then one final drop ending in a higher low/lower low, depending on the pair, then the accumulation phase leading to, finally, the start of the biggest bull-market in the history of Cryptocurrency —2025.
Thank you for reading.
Your support is truly appreciated.
Namaste.
#KSMUSDT on The Edge of Breakout From Falling Wedge | Watch OutYello, Paradisers! Could #Kusama be on the brink of a major breakout? Let's take a look at the latest analysis of the #KSMUSDT:
💎#KSM is currently hinting at a bullish continuation from a critical support zone at $16.38. We’ve been watching #Kusama closely as it follows a falling wedge pattern, and now it's gearing up to break above the descending resistance line. Internal resistance at $26.55 is the next target for $KSM.
💎If #KSMUSDT holds strong at this level, we could be on the verge of a significant bullish rally, echoing previous trends. A breakout above the key resistance at $26.55 might set the stage for a run toward the next resistance zones and beyond.
💎However, caution is essential. If the momentum falters at this critical support, we might witness a rebound from the lower support area around $13.55–$14.76.
💎Stay sharp and keep a close eye on #KSM price action. A daily close below the demand area could invalidate the bullish scenario and open the door to further declines.
Stay focused, patient, and disciplined Paradisers.
MyCryptoParadise
iFeel the success🌴

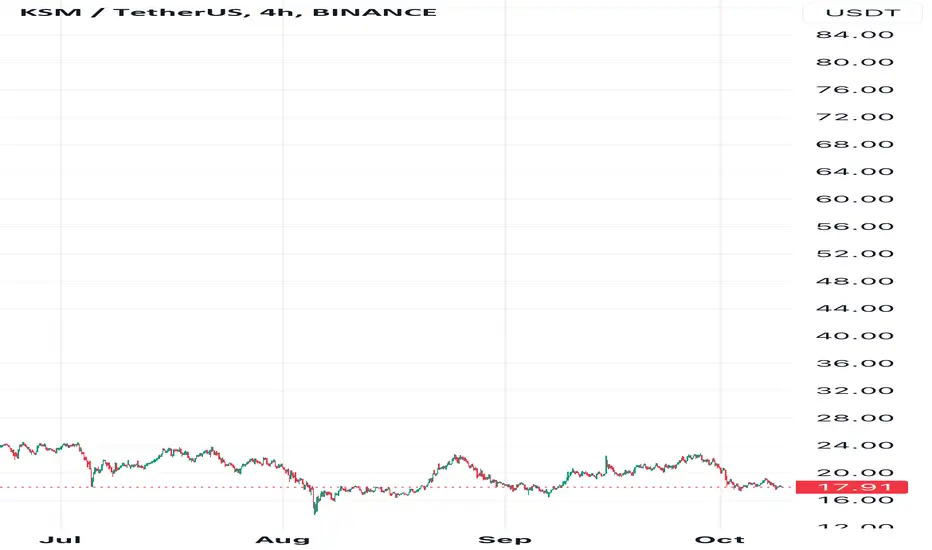
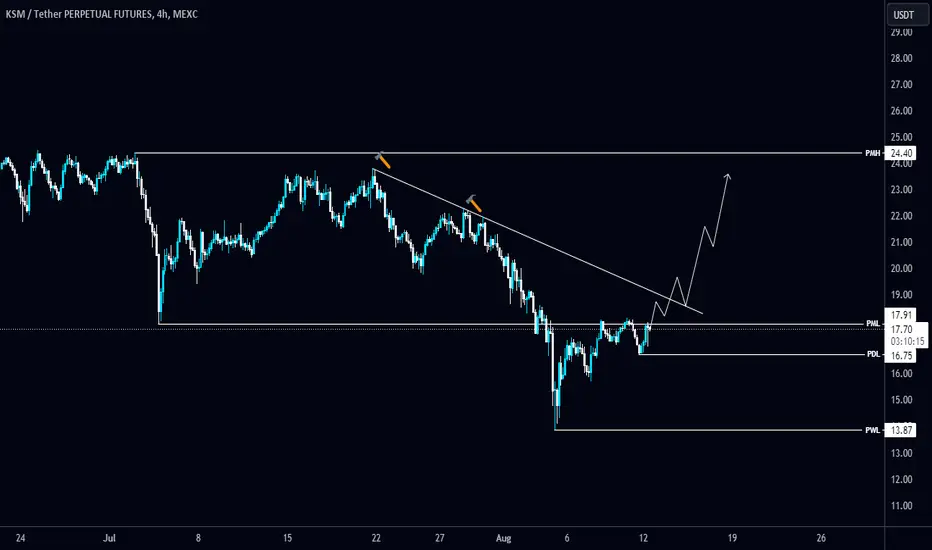
#KSM/USDT is heading towards the Diagonal Trendline in 4-Hour TF#KSM/USDT is heading towards the Diagonal Trendline in 4-Hour TF!
#KSMUSDT needs to clear the trendline to turn bullish. NYSE:KSM local resistance level is PML $17.90. The next local support level is PDL $16.75.
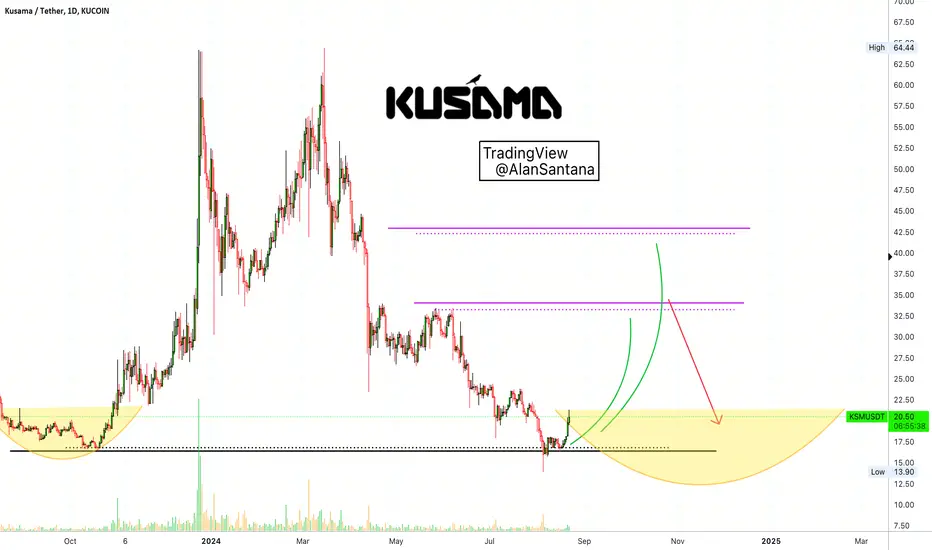
KSMUSDT Analysis: Potential Reversal or Further Decline?✨ Welcome to my channel. Here, we analyze a new crypto project or Forex pair every day.
📅 Let's dive into today's analysis, focusing on the KSMUSDT pair in the crypto market.
🗂 About the Project: Kusama (KSM) is an experimental blockchain platform designed to provide a proving ground for new technologies. It serves as a sister network to Polkadot, allowing developers to build and deploy decentralized applications (dApps) quickly and with lower risk.
📅 Weekly Timeframe Analysis
In this timeframe, KSMUSDT has experienced notable fluctuations. The price reached a significant peak before entering a correction phase. Currently, KSM is trading around the $21.18 level, with a key support at $17.38. A stabilization above $24.35 could signal a bullish trend, potentially targeting $37.42 and $55.99. However, a failure to hold above $17.38 might lead to further declines, with the next major support at $14.50.
📅 Daily Timeframe Analysis
On the daily chart, KSMUSDT has shown a bearish trend with the price consolidating around $20.44. The key resistance levels are at $24.23 and $27.00. A break above these levels could indicate a shift to a bullish trend. On the downside, a break below the $16.72 level might lead to further bearish movement. The RSI currently stands around 43.95, suggesting potential bearish momentum.
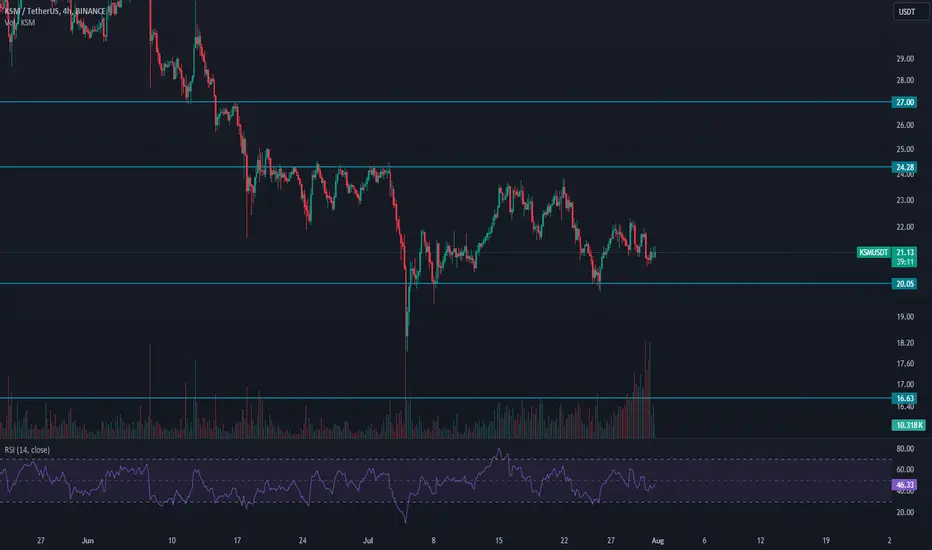
📅 4-Hour Timeframe Analysis
In the 4-hour timeframe, KSMUSDT is consolidating near the support at $20.05. A drop below this level could signal further declines towards $16.63. Conversely, a move above $21.20 could indicate a short-term bullish reversal, targeting resistance at $24.28. The RSI is around 47.61, indicating a neutral to bearish sentiment.
📊 RSI Oscillator
The RSI is currently ranging between 37.54 and 47.61 on different timeframes. Breaking these levels could provide confirmation for opening positions. However, always use these levels in conjunction with candle patterns and volume analysis to find the best entry and exit points.
📉 Given the current bearish signals in the daily and 4-hour timeframes, alongside the potential trend change in the weekly timeframe, I am inclined to open a short position. However, this is based on my trading strategy. Each trader should base their decisions on their strategies and risk management plans.
⚠️ Please note that this is not financial advice. I'm simply introducing this project to you, and remember always to do your own research.
🫶 If you found this analysis helpful and want to support me, please boost this analysis. Feel free to leave a comment or suggest a coin you'd like me to analyze next.
KSMUSDT 1WKSM ~ 1W
#KSM Revisiting the Demand Zone. This Support Block is the best price to start accumulation again. with a short term target of at least 20%+