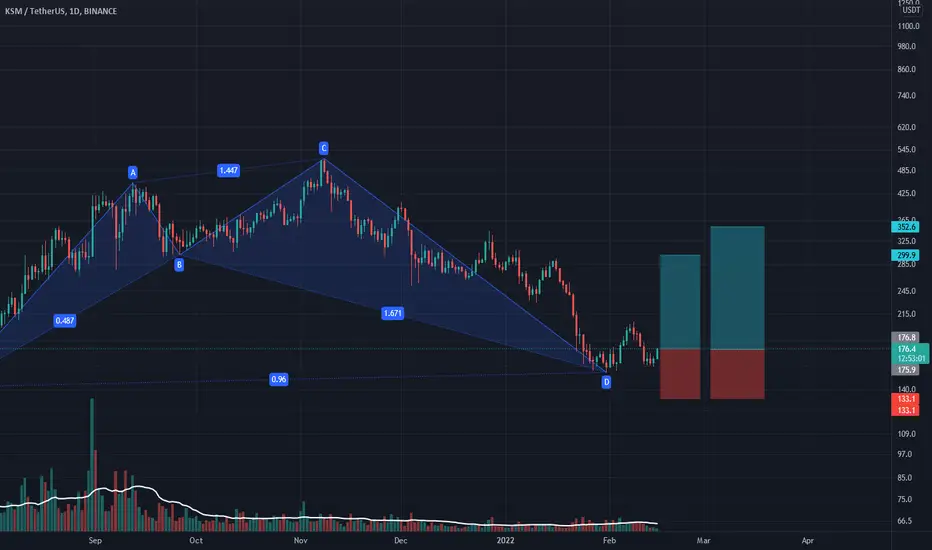
KSM/USDT-1D-BINANCE (Bullish Shark)This is not a financial advice. Always do your own research and always put stoploss in your trade (SL) :) If you want more detailed info
how to study and read charts or just need help with some coin, just write to me here a comment, i will try to answer to everybody...
i can help you :) all for free, don't worry, BE HAPPY!
KSMUSDT trade ideas
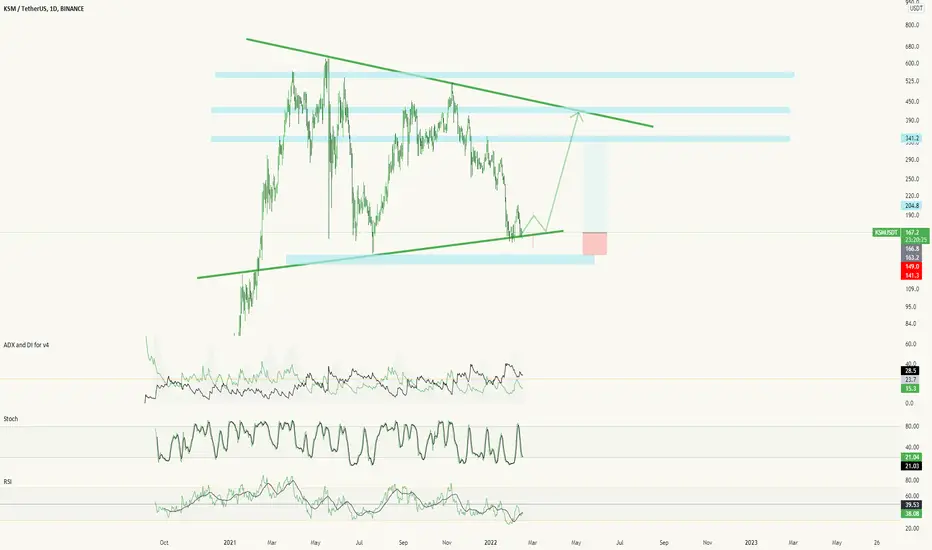
Excellent reward coefficient in KSMHello dear friends
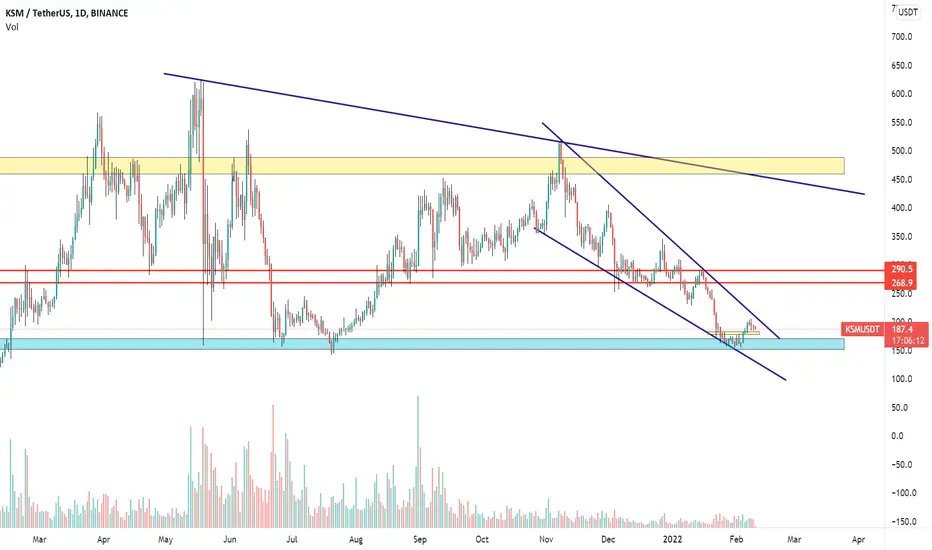
What the chart tells me is that the price is involved in large fluctuations in a non-parallel channel. So what can we do to make a profit ???
It is enough to enter the deal in the ceilings and floors after getting the return confirmation and stay with it until the specified ceiling and floor. This chart model is one of the least risky charts.
******Appropriate entry points for supports and resistances according to the chart*******
If you like this idea, Please Follow me and do not forget that your likes and comments are very important
Thanks dear friends.
Be generous and rich.
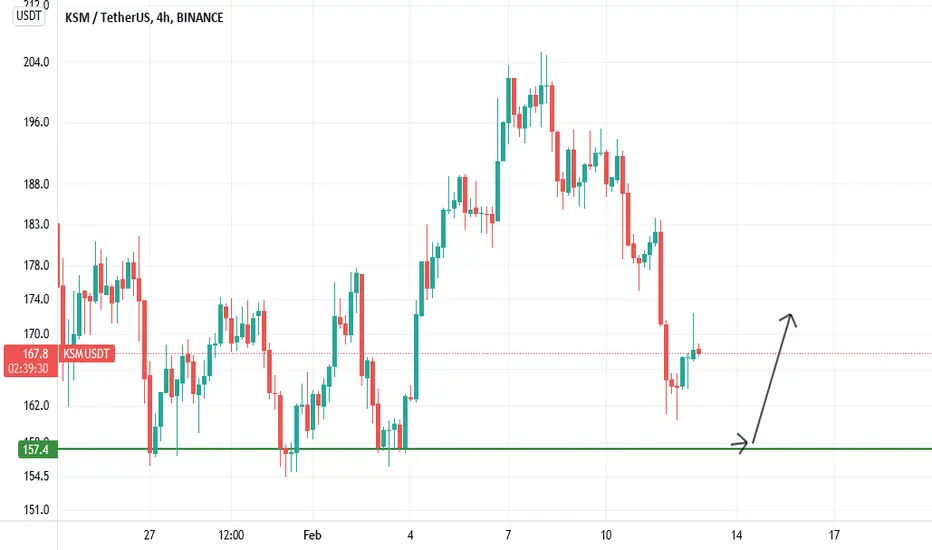
wait for bullish days in near futurejust look at the support zone and the just buy
We have seen a strong downward trend in recent days that will continue until we reach the weekly support area, and then we should expect to see a great rally.
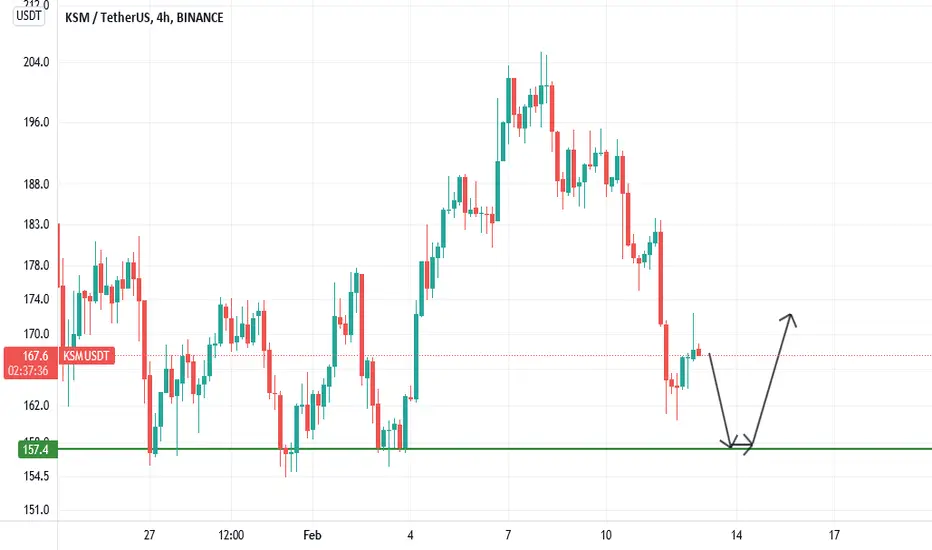
bearish for few hoursjust look at the support zone and the just buy
We have seen a strong downward trend in recent days that will continue until we reach the weekly support area, and then we should expect to see a great rally.
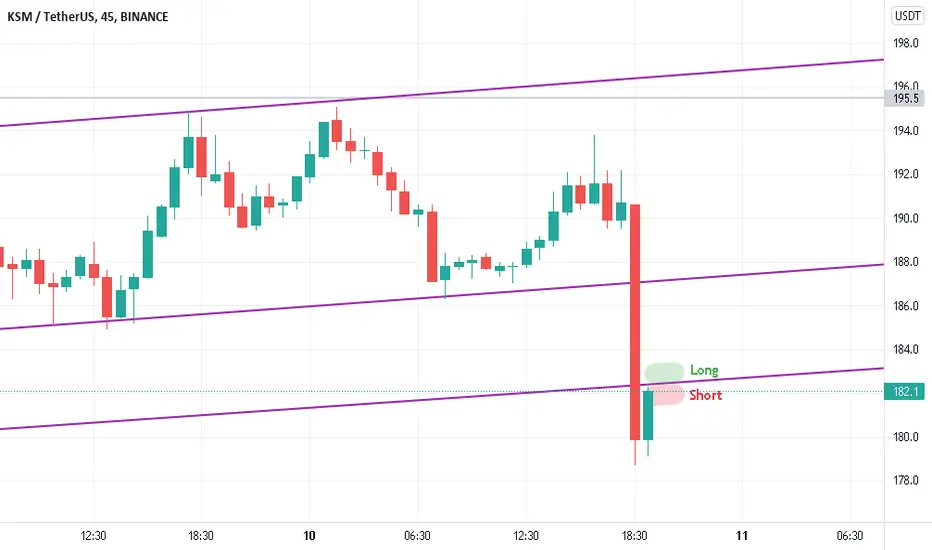
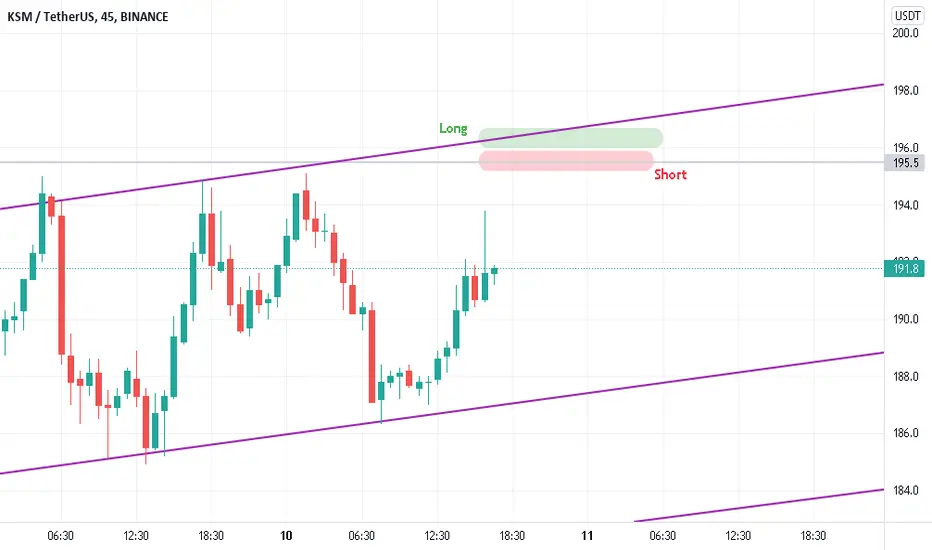
KSM/USDTKSM 45m Binance Chart create Head & Shoulder Pattern sentiment says Short But bee ready for Both scenarios
KSM seems consolidation done!!!The alt has been continuously sqeezing in a falling wedge structure!
Entering inside the pattern is risky as well as rewarding!
The accumulation base is around $179-$184!
Keep a 10% sl and look for high high levels!
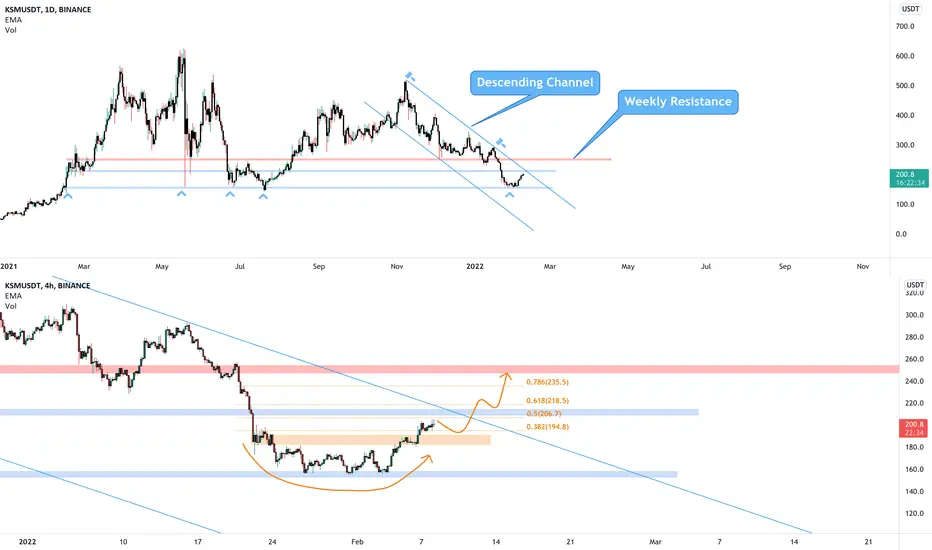
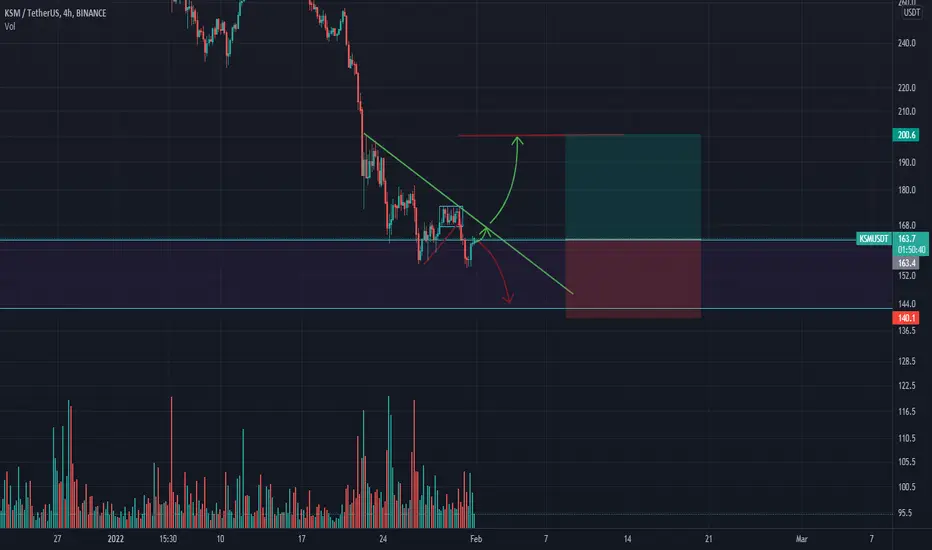
KSMUSDT is testing the daily resistanceThe market created a round bottom exactly on our support around 158$.
As you can see on the upper chart, the price bounced several times in that area, which means that this support is very strong.
On 4h timeframe, we can see a round bottom and a breakout from the 4h resistance, and now the price is testing the 0.5 Fibonacci level on the 206$
How to approach?
The price needs to have another breakout from the descending channel and retest the daily resistance as new support. IF the price is going to satisfy our rules, we could see a retest of the weekly resistance around 255$
–––––
Follow the Shrimp 🦐
Keep in mind.
🟣 Purple structure -> Monthly structure.
🔴 Red structure -> Weekly structure.
🔵 Blue structure -> Daily structure.
🟡 Yellow structure -> 4h structure.
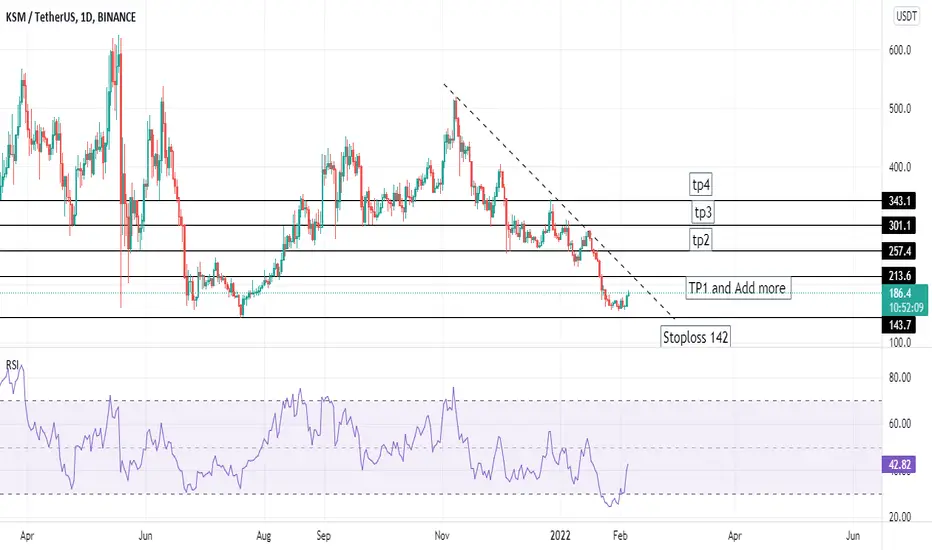
KSMUSDT Bulls everywhereBuy at current level of 170-186
Stoploss 142
TP1 213 Add more to portfolio
TP2 257
TP3 305
TP4 346
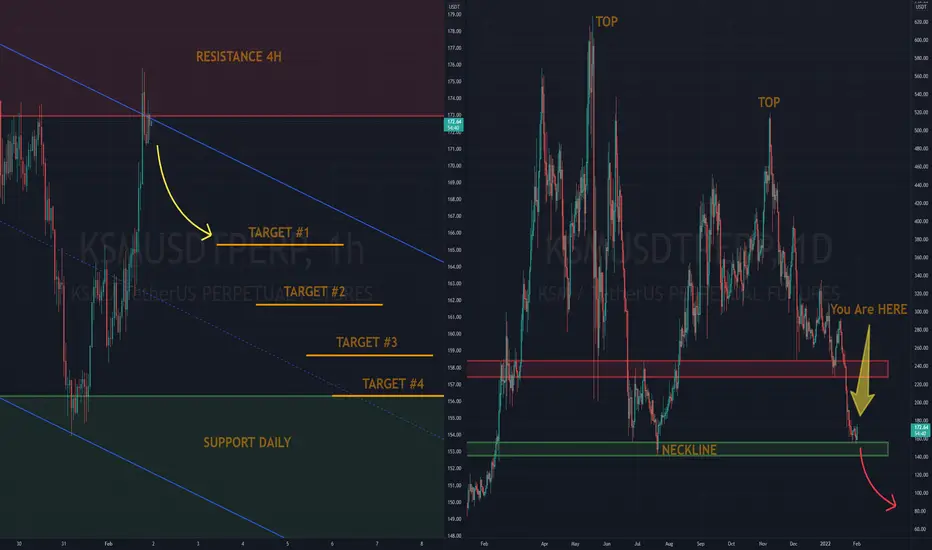
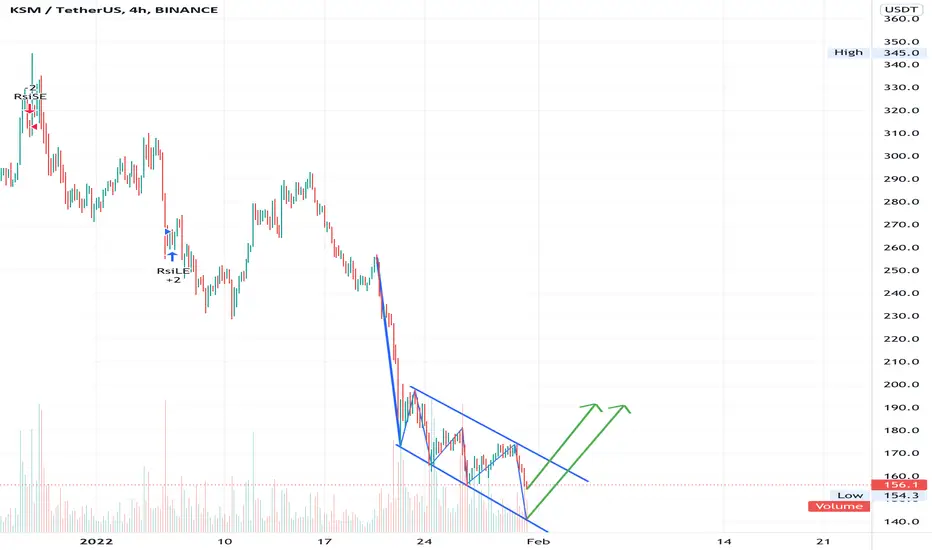
KSM Big SupportKSM is testing the Neckline of a massive Double Top from a year ago, which makes it a very strong Support channel.
A few targets within the weak descending channel:
Target #1 = 165
Target #2 = 161
Target #3 = 158
Target #4 = 156
SUPPORT DAILY = 156 to 141
Once KSM reaches the Support Daily/Neckline, watch out for turbulence. I'll consider entering after it breaks down the Neckline. If this thesis holds, KSM will be in freefall.
This is my Thesis, targets are purely hypothetical based on my analysis.
This is NOT Investment and/or Trading Advice.
Happy Trades!
❤️ If you enjoy my ideas , Please like/comment , It means a lot, Thank You! ❤️
HUOBI:KSMUSDT
BINANCE:KSMUSDT
FTX:KSMPERP
BYBIT:KSMUSDT
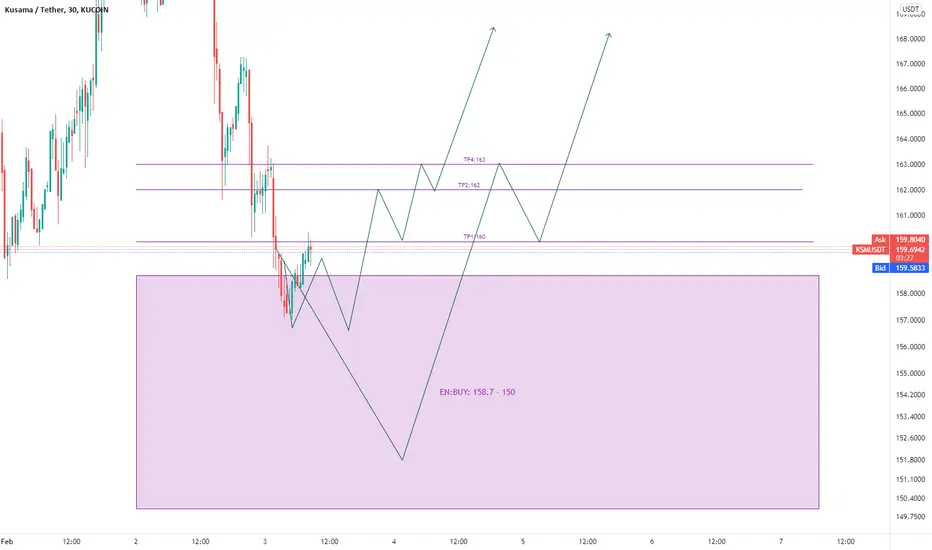
KSM/USDTKSM/USDT
Buy, LONG
Leverage: 3x_5x_7x
TIME SHORT
Entry price: 158.7-143
Targets for Buy:
TP 1 :160
TP 2 : 161.2
TP 3 : 162
TP 4 : 162.8
Stop LOSS:140
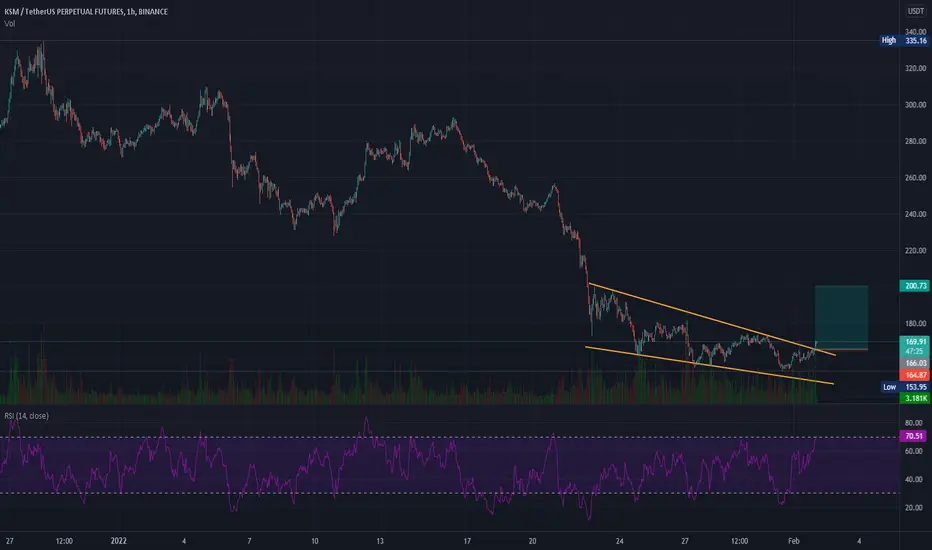
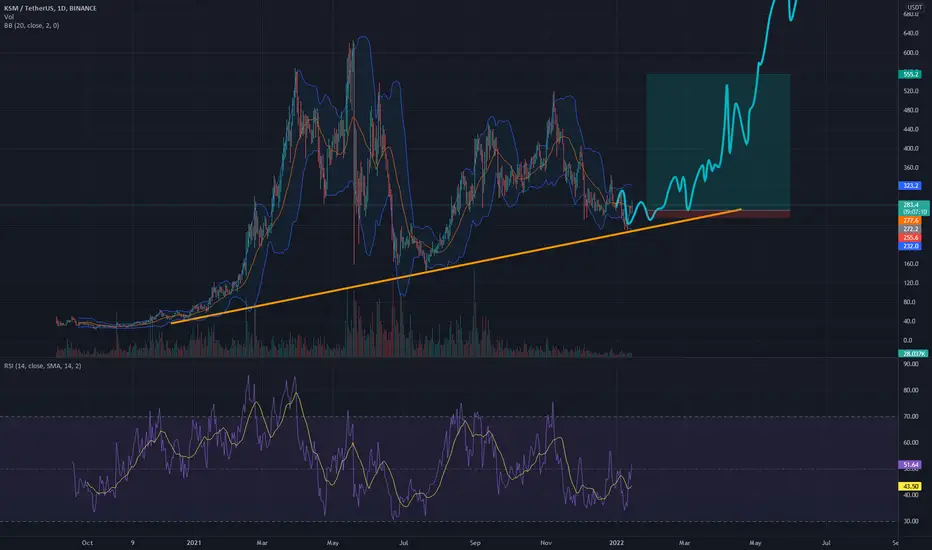
KSM, keep an eye on this trend line.A trend line can be identified on the KSM chart. At the moment it is resistance. In case of squeezing and breakout, there could be a good buying opportunity. I would also like to note that there is high volume on the bottom, which is a positive signal.
Write in the comments all your questions and instruments analysis of which you want to see.
Friends, push the like button, write a comment, and share with your mates - that would be the best THANK YOU.
P.S. I personally will open entry if the price will show it according to my strategy.
Always make your analysis before a trade.

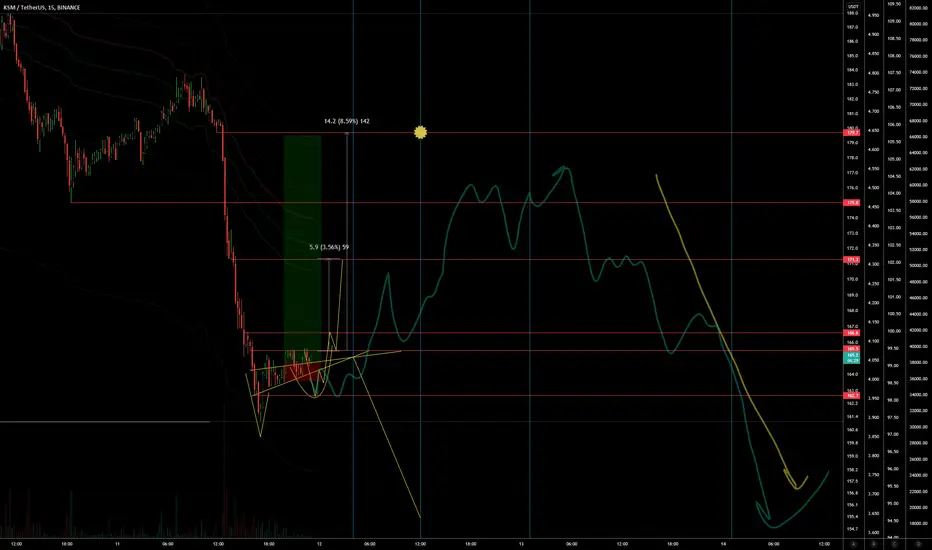
KSMUSDTTwo scenarios facing the KSMUSDT
.................
This is an analysis, look at it from a predictive perspective
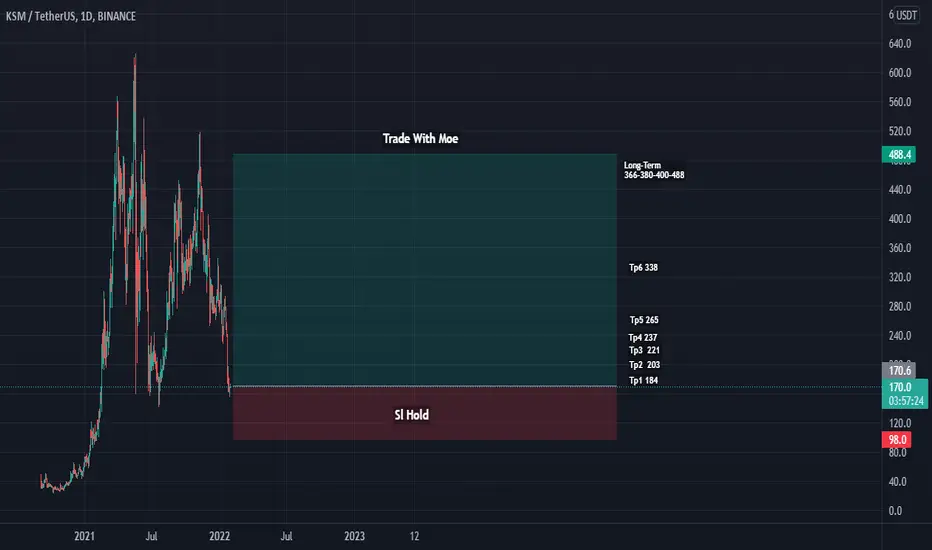
Kusama FutureCoin: Kusama
Type of signal : Spot
Entry Price : 144$-173$
Price now : 170$
Goals:
Tp1 184$
Tp2 203$
Tp3 221$
Tp4 237$
Tp5 265$
Tp6 338$
Long-Term
366$-380$-400$-488$
SL Hold
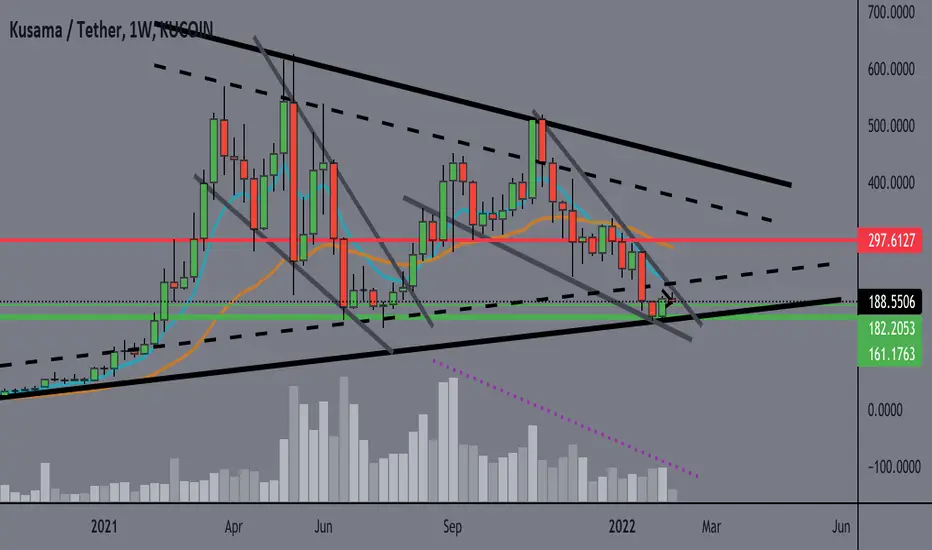
Kusama (KSM) formed big bullish Shark for upto 322% rallyHi dear friends, hope you are well and welcome to the new trade setup of Kusama ( KSM ) coin.
During the previous market crash, KSM formed a bullish Shark pattern, which I shared as below:
Now during the current drop, on the weekly time frame chart, KSM has formed a bullish harmonic Shark pattern for a big bullish reversal move.

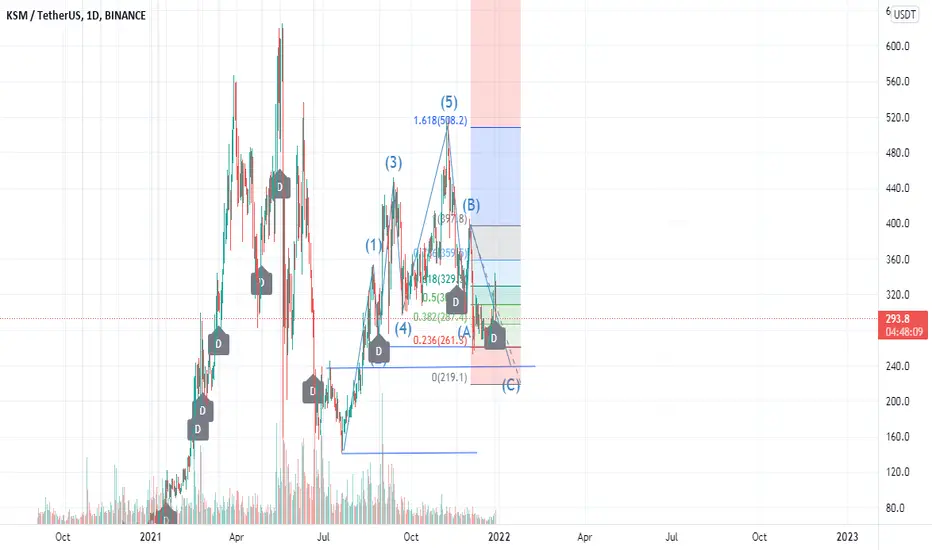
KSMUSDT Wave Analysis (GLOBAL VISION)Hello friends.
Please support my work by clicking the LIKE button👍 (If you liked).Thank you!
Everything on the chart.
The zone of confirmation or cancellation of this or that scenario, fixing or not fixing above the 250$ zone,
if we fix, then we will follow the yellow scenario,
if not, we can complicate our correction to a double zigzag (wxy) and then we will fall to the 100$ area, where we will need to buy.
Entry: market and lower
MAIN TARGET ZONE AT THE END OF BULL RUN: 750-1000$
Stop: (depending of ur risk). ALWAYS follow ur RM .
Risk is justified.
Good luck everyone!
Follow me on TRADINGView, if you don't want to miss my next analysis or signals.
It's not financial advice.
Dont Forget, always make your own research before to trade my ideas!
Open to any questions and suggestions.

Kusama - long term tradeI am optimistic on the market in this area, not because this coin gave me profits in the past, but the daily graph is an solid uptrend, despite overall dark atmosphere at the moment... I Love the project, I like what I see on socials and definitely it's my top3 pair in next bull run. Very low Volume, watch out it's going to a bumpy ride!
My strategy: I'm going big on every trade consequently putting very tight stop loss so I can execute that setup again with better numbers instead of being stuck with red bags. Sometimes I might catch stoplosses 2, 4, 6 times before reaching TP.
Kusama showing a Bullish setupKusama looks ready to break up, bullish above resistance.
Also MACD showing signs of reversal, keep an eye on the resistance.
