KSMUSDT trade ideas
KSMUSDTKSM Trendline break above the resistance trendline. The current price action is retesting the recent support.
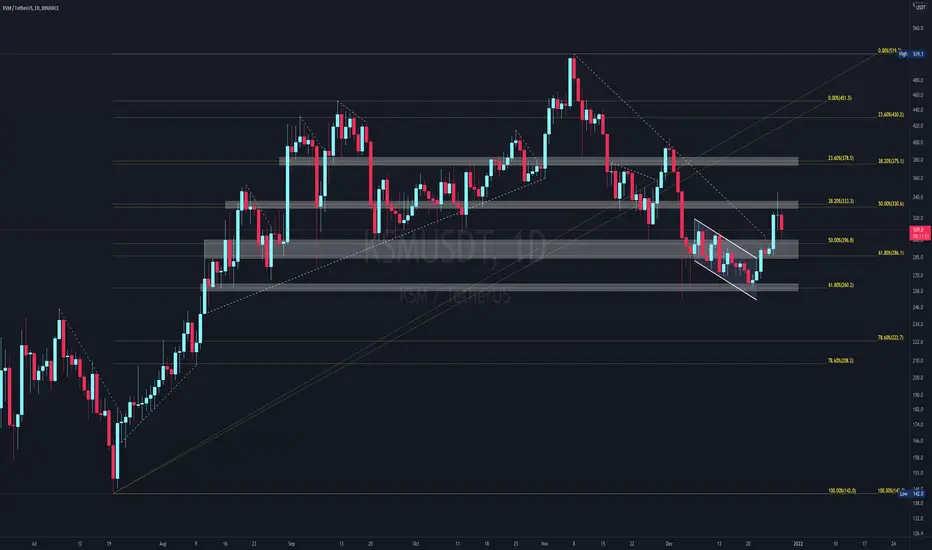
KSM USDT |+80% Potential Profits#KSM-USDT
Entre from 260 to 250✅
The recommended capital is no more than 5%
Total Risk is 1% from the wallet
Targets:
- 287 USDT
- 330 USDT (sell at least 50% on this Huge Resistance may stop bulls from climping up more)
- 298 USDT
- 277 USDT(assign very small amount for this target)
Stop-loss:
Close Weekly candle under 212
🌹Don't trade without risk/capital management and Stay Safe 🌹
🌹 Thank you 🌹
See available trades to enter on Related Idea section

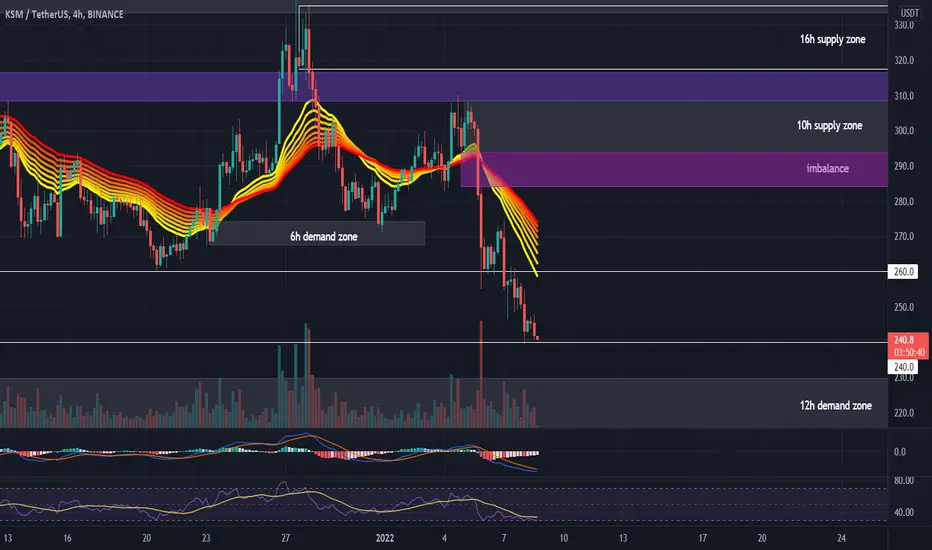
#KSMUSDT 4H Chart
Price bounced perfectly from the 12h demand zone at $230 as predicted and is currently getting rejected from the resistance at $240. MACD is still bullish however both RSI and EMA ribbon are bearish. We still don't have any bullish confirmation yet, we shall wait until it breaks above the previous high at $253 then we would aim for the major 16h supply at $320 even though we may see some rejection on the first supply zone around $300.
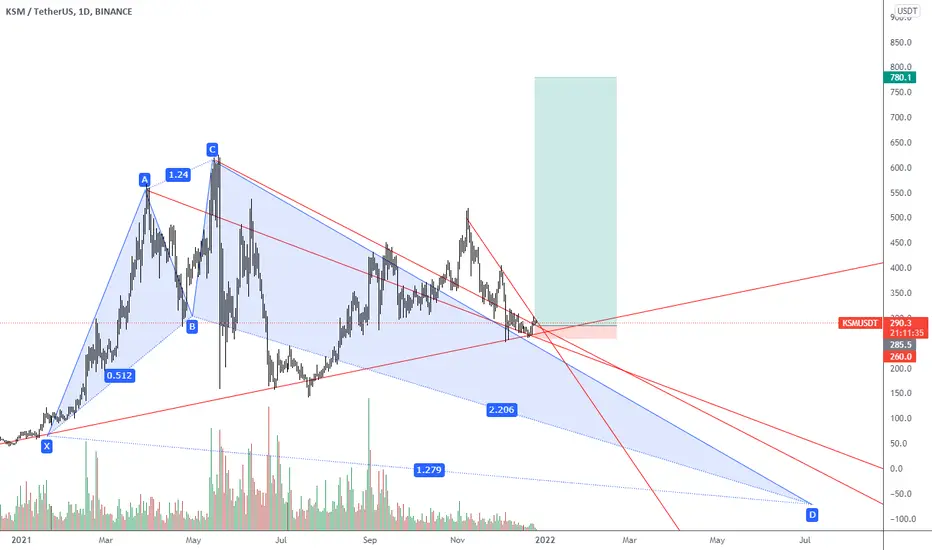
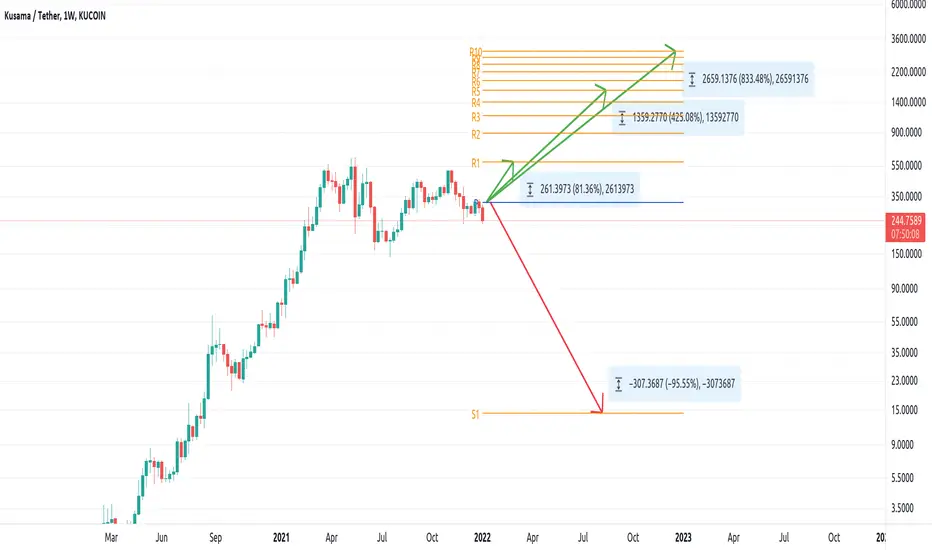
Pivot Yearly predictions for $KSM using hidden pivotsThis is a very basic trading idea published as part of my Crypto maket analysis for 2022.
It demonstrates the earning potential, predicted by Traditional Yearly Pivots.
On top of that, it uses my Hidden Pivots Indicator that is plotting additional levels of pivots from the R6-R10 and Support Pivots (If calculation allows it, as in many cases it won't) from S6-S10.
The Indicator plots automatically on each time frame.
You can have a look at it here:
And a deeper explanation of it here:
medium.com
In the case of $KSMUSD, you can see the four scenarios on the chart:
1.Likely in case of bear year - Downside to the S1.
2. Likely in case of bull year - Upside to the R1.
3. Likely on as very bullish cycle - Upside to the R5.
4. Likely on a bananas rocket to the moon year - Upside R10 and beyond.
For the whole long read and analysis on the pivot side of the crypto market 2022, see here:
rotzeod.medium.com
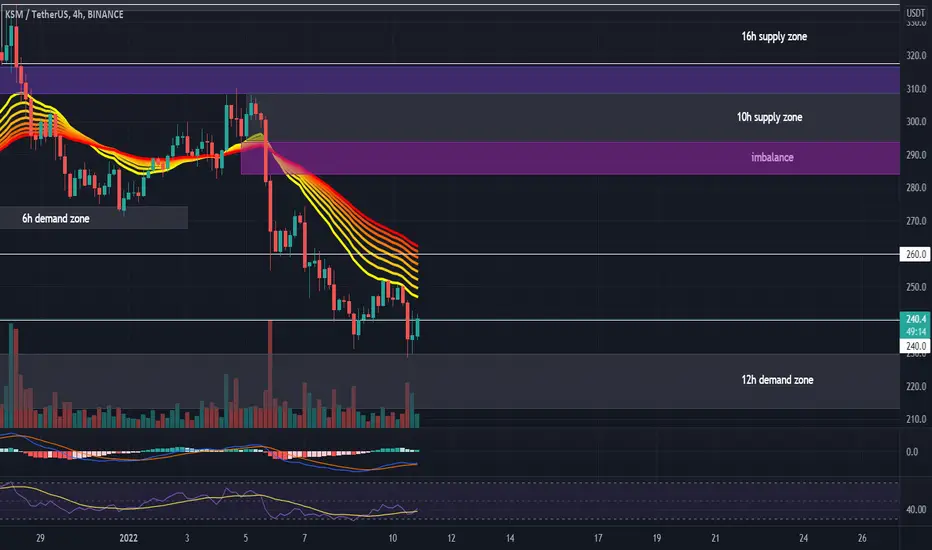
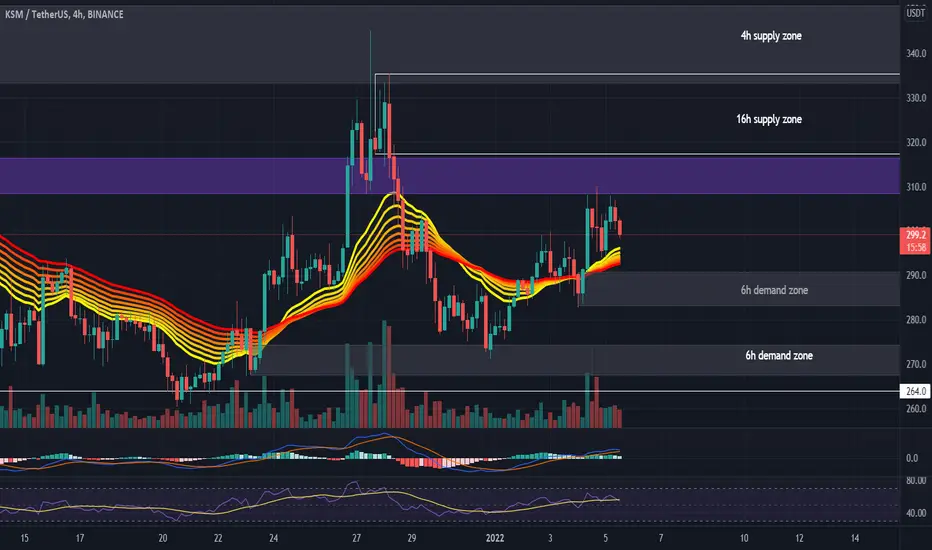
#KSMUSDT 4H Chart
Price recently broke below the support at $260 and is currently retesting the support at $240. MACD is showing bearish weakness, RSI is oversold and EMAs are bearish. Price should bounce from here aiming for the 10h supply also filling the imbalance below it as a short term target, however if it breaks below this support area then we would expect a bullish reversal from the major 12h demand zone at $230.
#KSMUSDT 4H Chart
After bouncing from the 6h demand zone at $272, price ranged in an uptrend and it is currently getting rejected from the resistance area at $310. MACD is showing bullish weakness, RSI is bought and EMAs are not clear. Price should test the 6h demand zone at $290 and bounce from there aiming for the 16h supply zone at $320 as a short term target.
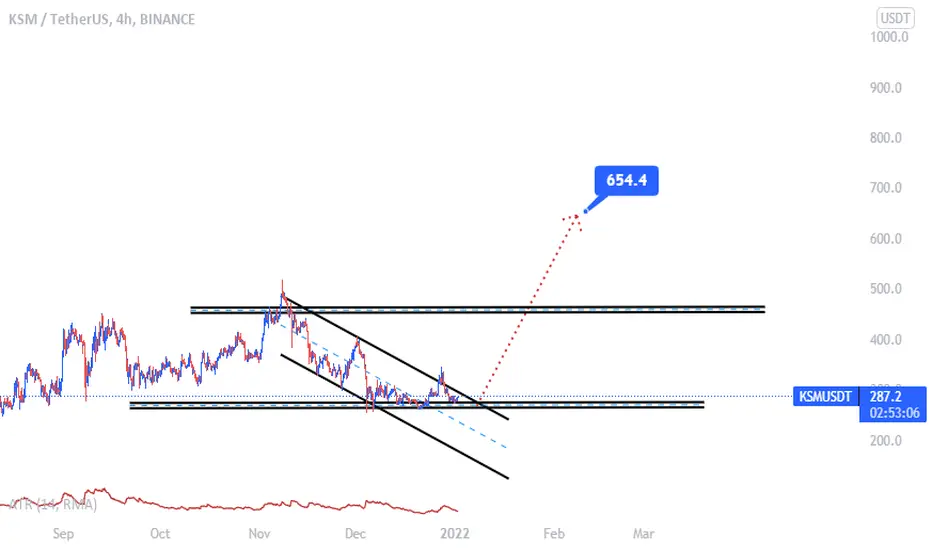
KSM is about to end his trending down soonI think KSM is about to end his trending down soon.
In short times KSM in a descending channel.
In long times KSM is in button line of his ascending channel.
I think maybe it is best time to buy KSM because KSM has no way to go except UP
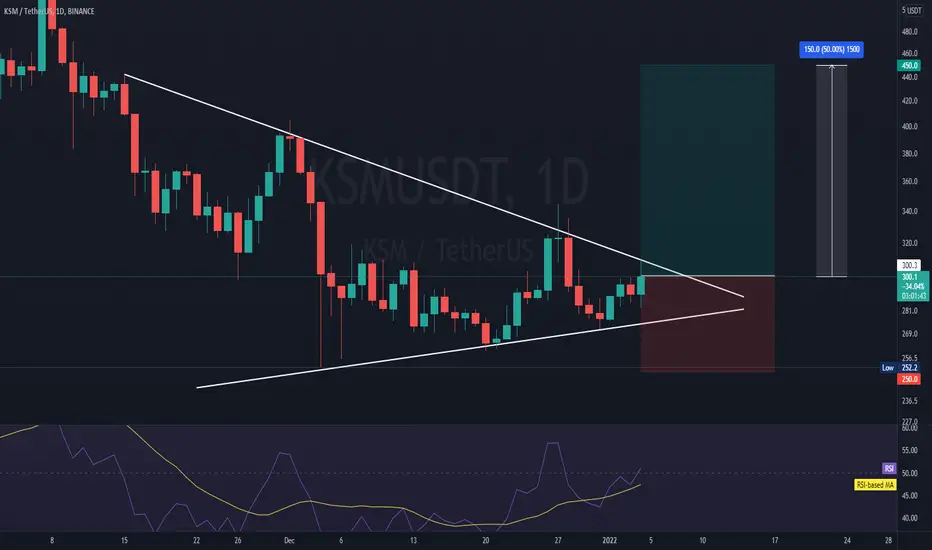
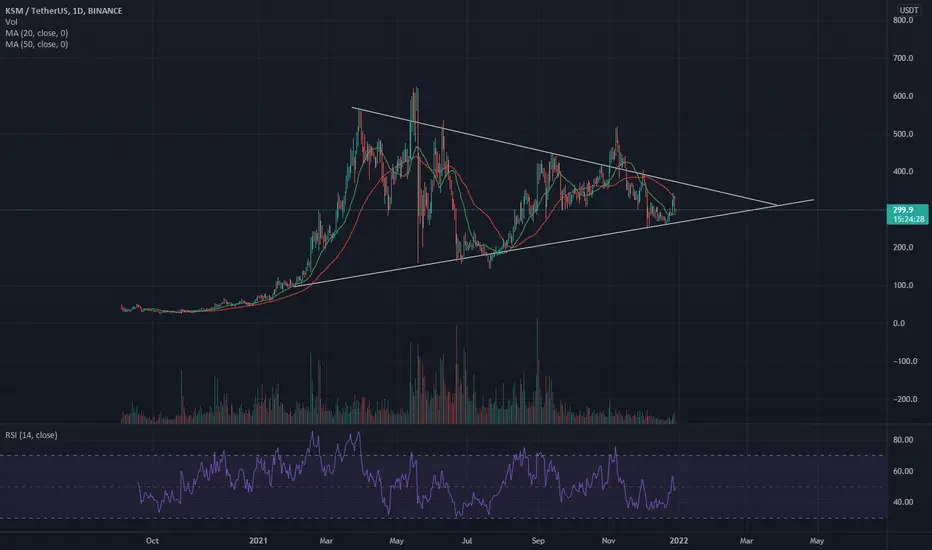
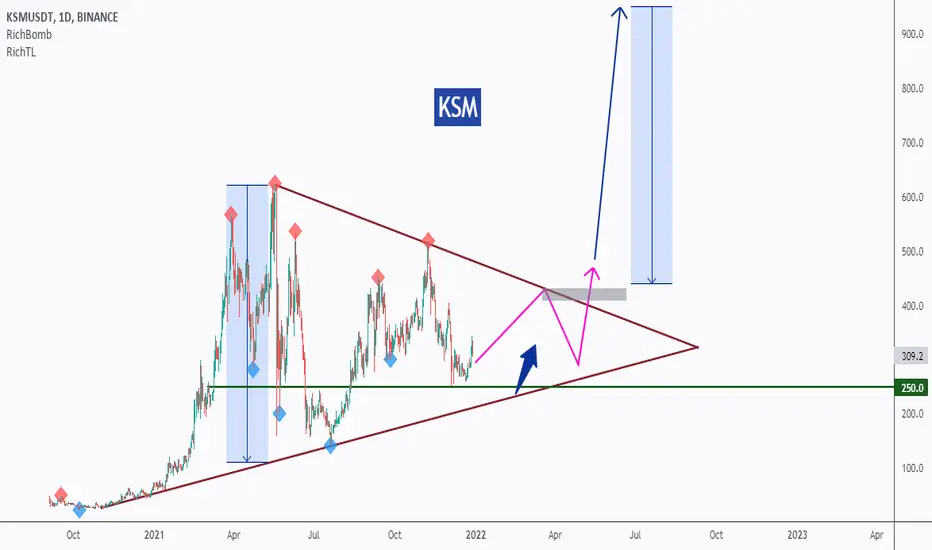
KSM Long HereKSM Sitting in the Symmetrical Triangle
RSI Moving ABOVE Based MA
Expecting a push and break above the falling resistance trendline
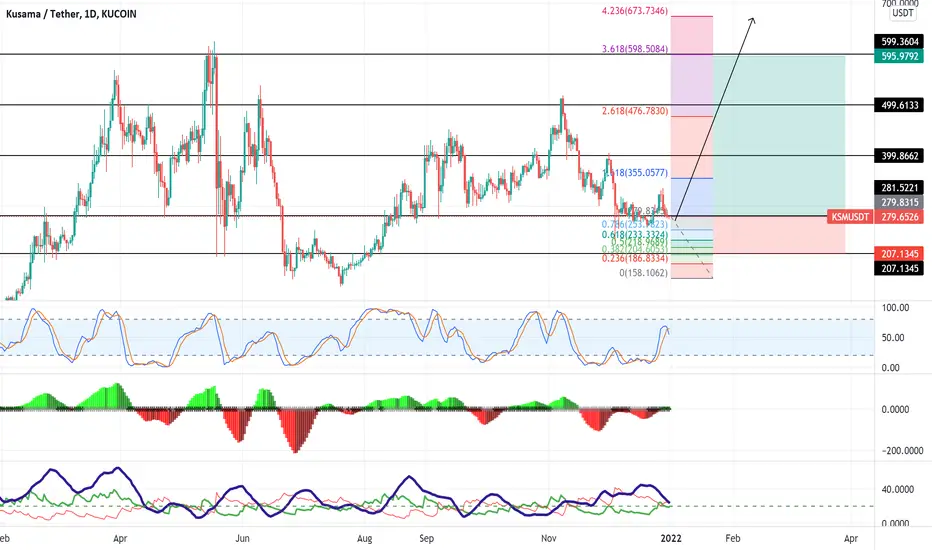
KSM BIG POTENTIALHello traders, how we can see Kusama in the bottom. We have big potential over 100%. DYOR
Happy new year.
ksmusdtlong term analysis , when ksm willl break this enormous triangle we'll take a long position
no financial advice
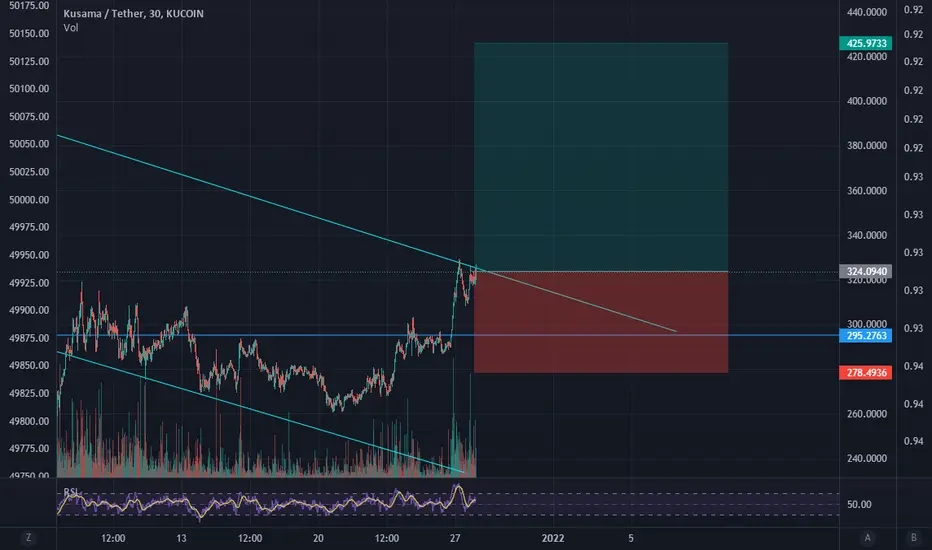
ksm triangleksm forming triangle which is going to breakout
buy
50% 296
50% 265
tp1: 320
tp2: 370
sl:hold midterm
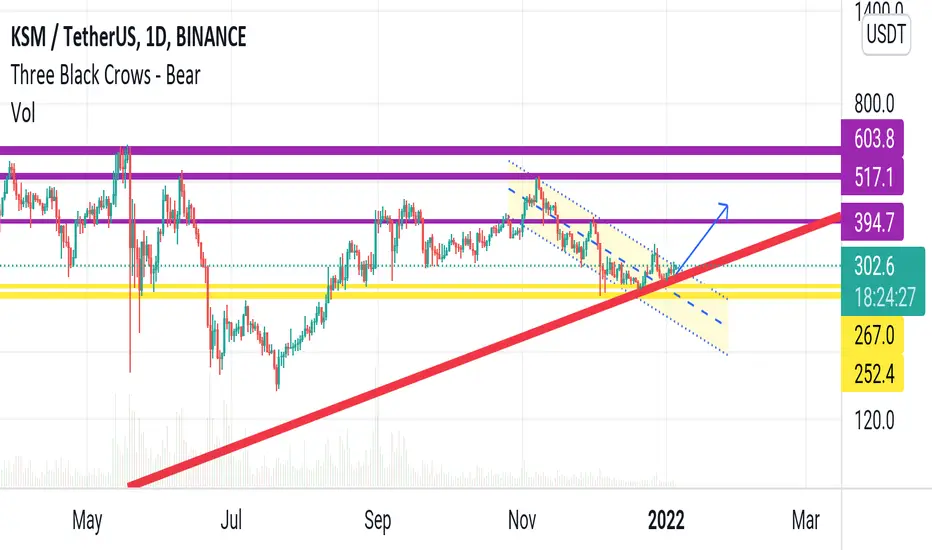
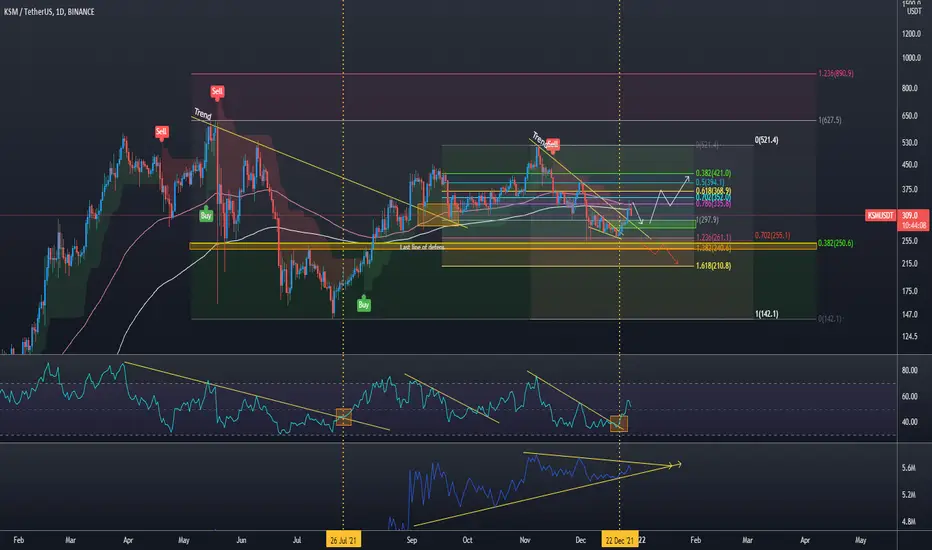
KSMUSDT DailyPlotting Fibs Retracement Exercise
4 Confluences area of Fib Retracement
23.60% & 38.20%
38.20% & 50%
50% & 61.80%
61.80%
Breakout from the descending parallel channel
Breakpit from the downward trend line
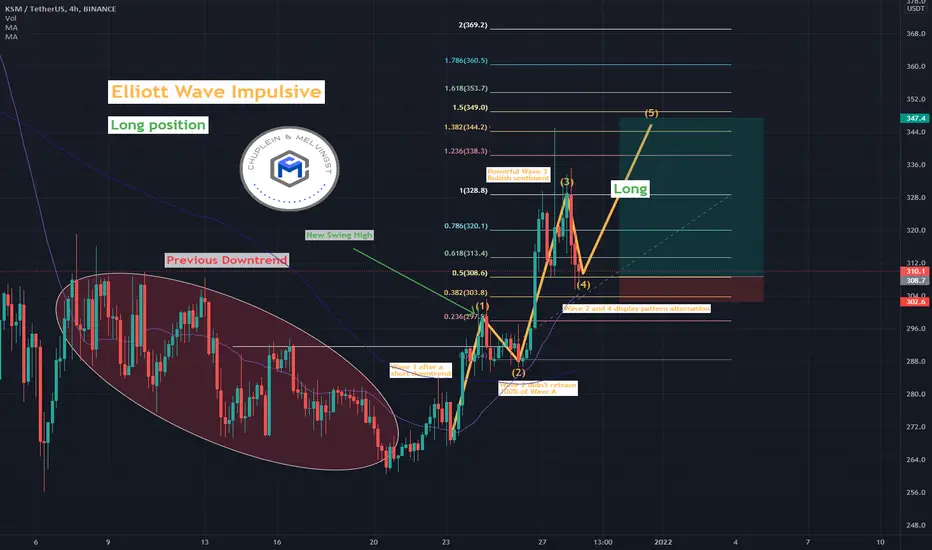
LONG KSMUSDT | LONG KSM / USDT | Elliott Wave ImpulsiveThis can be an opportunity to take advantage of the last wave of the impulsive Elliott Wave Pattern.
Entry Price: 308.7
Target Profit: 347.7
Stop Loss: 302.6
Ratio Risk / Reward ≃ 6.30
Potential Profit: 12.54%
This could be a good opportunity associated with a margin position as the ratio risk/reward is good.
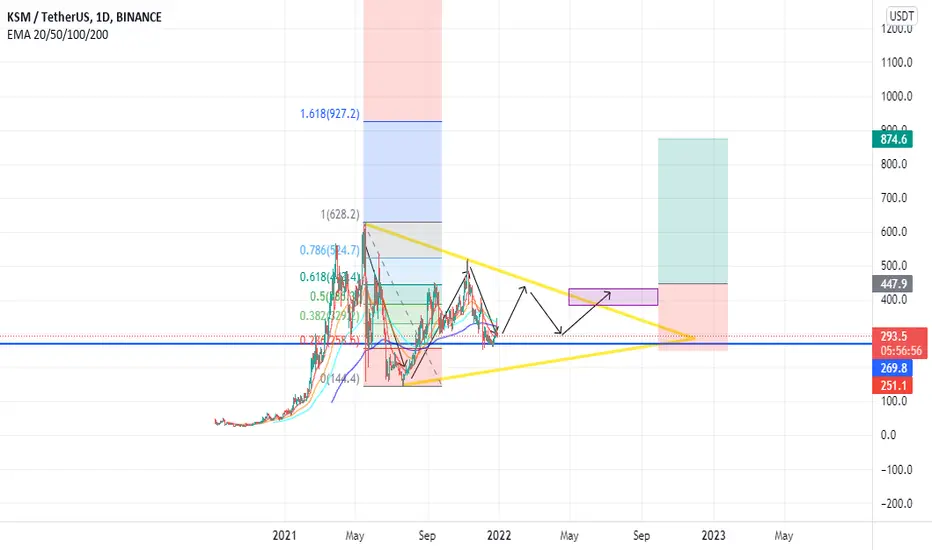
KSM - Long-term & Short-term RoadMap!Hello everyone, if you like the idea, do not forget to support with a like and follow.
Long-Term:
KSM is trading inside this giant symmetrical triangle in brown.
As per my trading style, I will be waiting for a third swing to form around the upper brown trendline to consider it valid then buy on its break upward. (projection in purple)
Short-Term:
As KSM approaches the lower bound/brown trendline, I will be looking for buy setups on lower timeframes. Any bullish reversal setup like a double bottom, trendline break, and so on...
Always follow your trading plan regarding entry, risk management, and trade management.
Good luck!
All Strategies Are Good; If Managed Properly!
~Rich
KSM/USDTKSM has flipped the RSI trend on the daily chart. However, the price is still unable to break 100 Daily EMA. This gives us nice #BuyTheDip. BTC is looking shaky still in the range between 20 -50 weekly EMA. Therefore watch out for stop hunt no need to rush slowly dca.
On balance volume give's a hint once btc cool of i see KSM doing well
Expected retrace 280 – 297
Key 250$ must hold!

KSMusdt Kusama is a public blockchain network that is running the exact same codebase as Polkadot. It is aimed to be a canary build for the Polkadot network which is an experimental and development environment for new features that...
KSMUSDT is testing the resistance 🦐KSMUSDT is testing the resistance after the price had a breakout from the descending channel.
IF the price is going to have a breakout, According to Plancton's strategy (check our Academy ), we can set a nice order
–––––
Follow the Shrimp 🦐
Keep in mind.
🟣 Purple structure -> Monthly structure.
🔴 Red structure -> Weekly structure.
🔵 Blue structure -> Daily structure.
🟡 Yellow structure -> 4h structure.
⚫️ Black structure -> <4h structure.

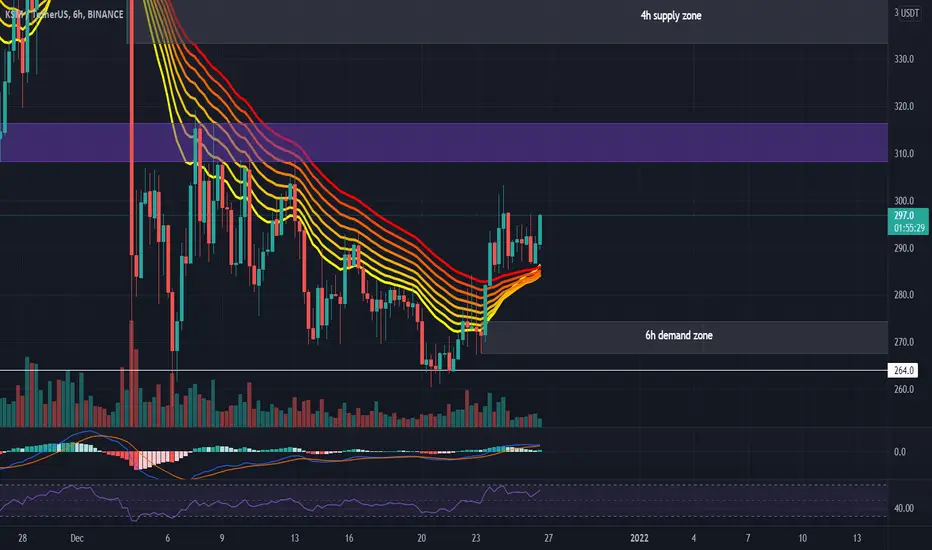
#KSMUSDT 6H Chart
Price recently bounced from the support at $264 and left a 6h demand zone at $274 which is still untested. MACD is still in a bullish territory, RSI is bought and EMAs are turning bullish. i expect price to come back down towards the 6h demand where it should bounce from aiming for the 4h supply at $333.
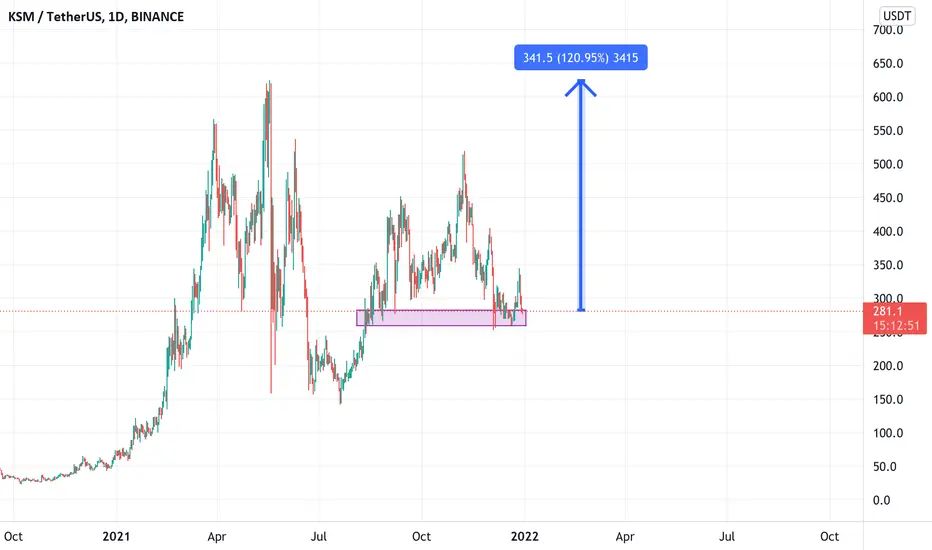
$KSM Idea going into Q1My thoughts on KSM going into 2022. The fundamentals are looking very nice to allow this to happen.