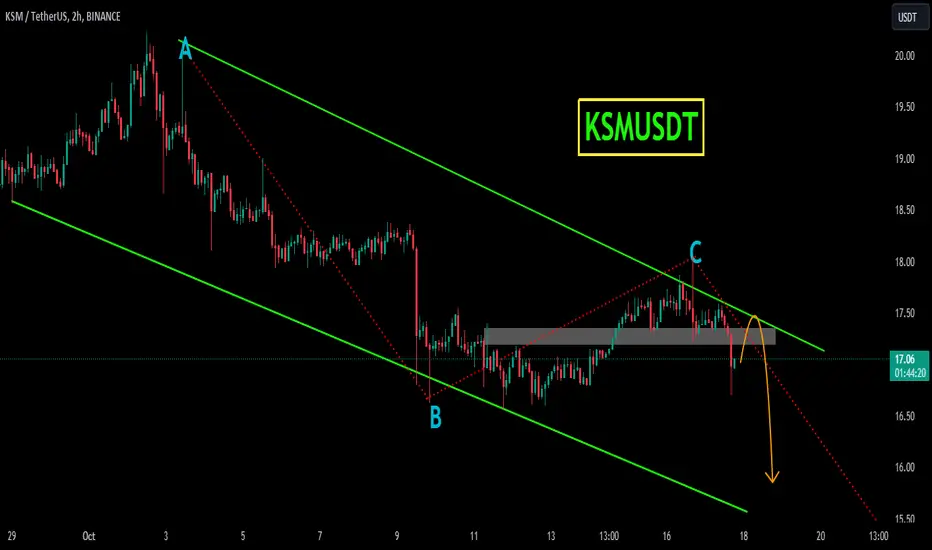
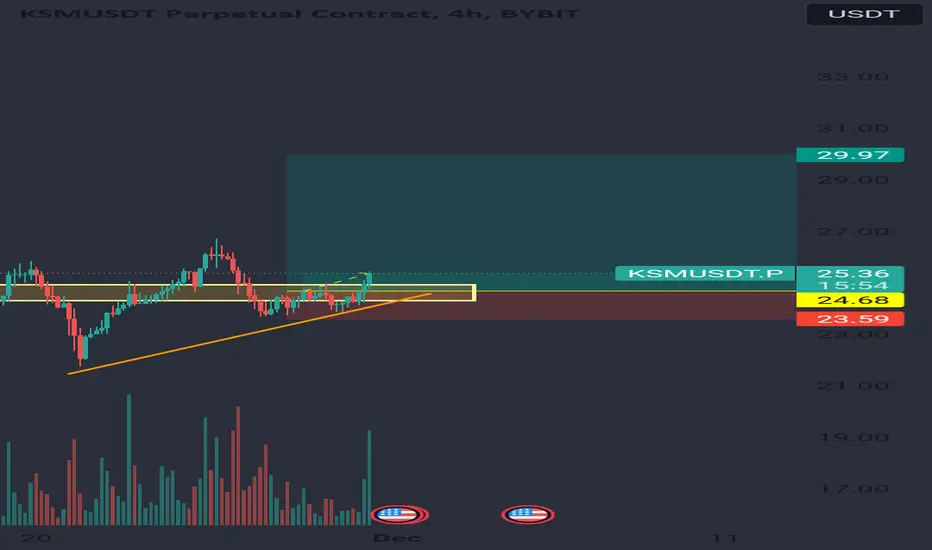
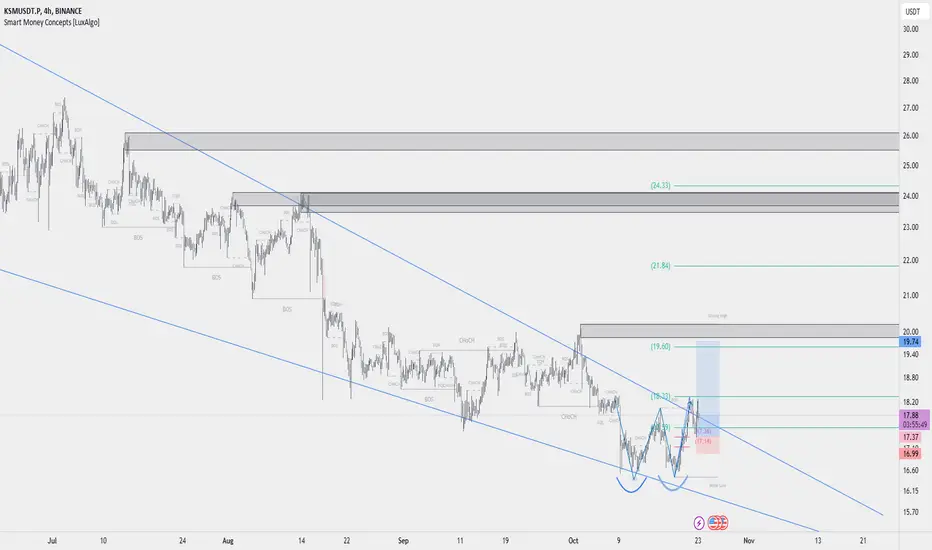
KSM Possible ShortGiving it a try as per the chart there are lower low in between the trend.
Pair: KSMusdt
Entering into short from 26.60
SL 25.90(fixed)
TP 24.8
TP 23
Risk Type: Medium
Note: Not a Financial Advice.
KSMUSDT trade ideas
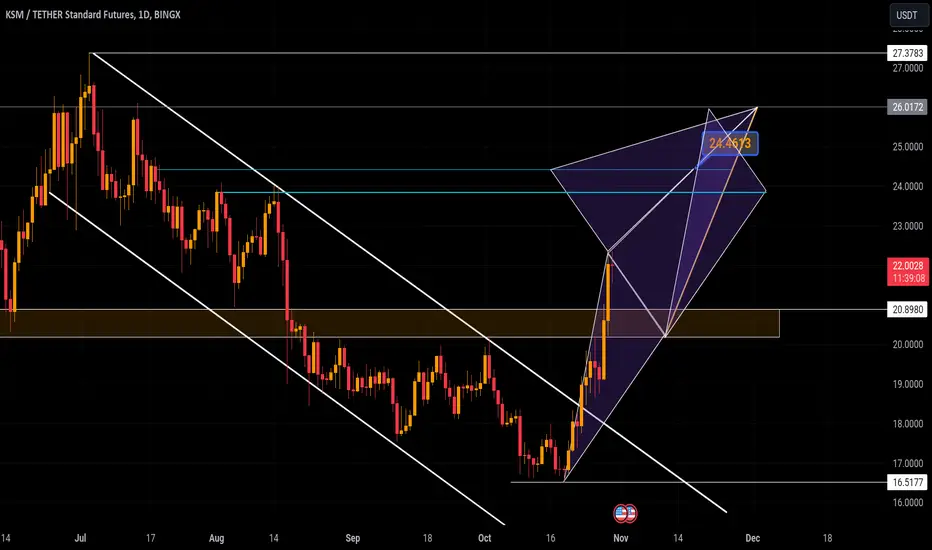
LONG KSM. Pullback to resistance in the triangle. Bound for new levels as the DOT testnet. Volume kicks in and will continue to gain traction as the next BTC halving comes closer and closer.
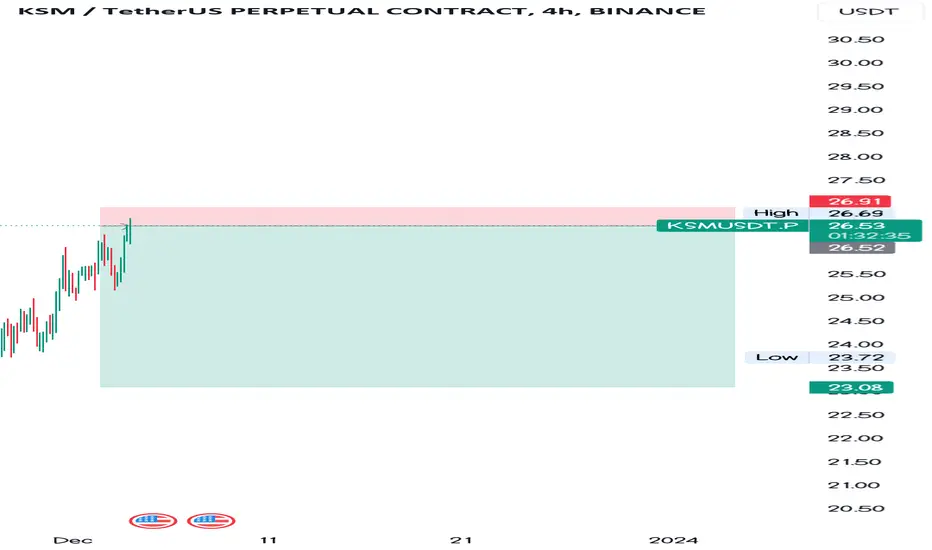
🚨 Trade Alert: KSM/USDT (3-5x)🚨 New Trade Alert 🚨
✅ KSM/USDT (3-5x)
📉 LONG Entry Zone: 24.1 - 25.15
⛔️ SL: 23.60
🔒 Breakeven Move: When it moves close to TP2
🎯 Take Profit:
Short Term: 25.41 - 25.7 - 26.1 - 26.6 - 27.2
Mid Term: 27.8 - 28.3 - 28.8 - 29.5 - 30
📝 Ensure you set entry orders to balance the trade's entry and aim to secure 30% of profits within the first two targets. Once profits are gained, adjust the stop orders to match the entry points or break-even levels.
⚠️ Disclaimer: Historical earnings cannot assure future outcomes. Is there a potential for risk? Certainly. The entire financial market is susceptible to uncertainties; any underlying factor or abrupt shift in market sentiment could overturn the current market trends and lead to losses. Refrain from undertaking undue risks that might jeopardize your financial stability. You are under no obligation to engage in this trade; kindly avoid the trade if you disagree with the trade analysis.
GIS TRADING®
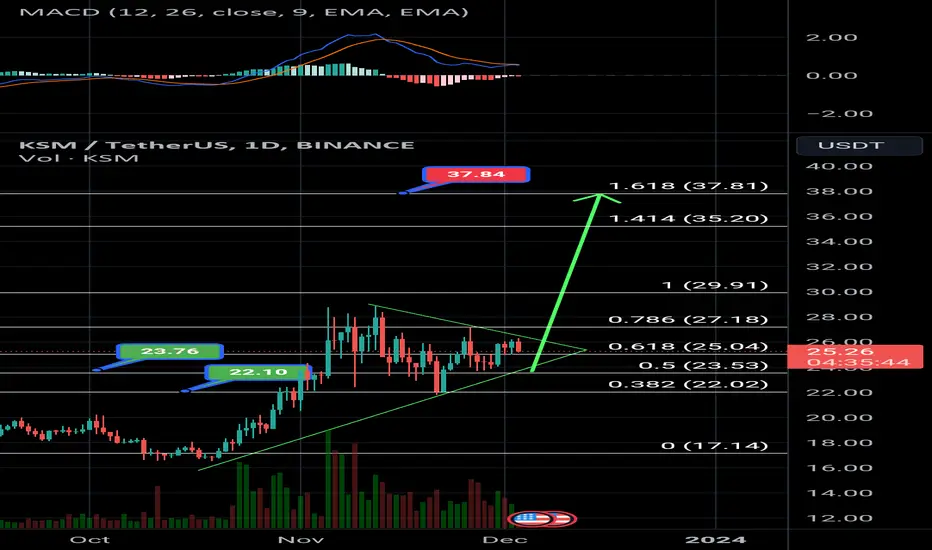
Pu- pu- PUMP IT UP! KSM #LONG Kindly Suggesting Monayyyy#LONG
• 👉 Leverage: 5x ISOLATED
• ⎿ Target 5 : 30 101.2%
• ⎿ Target 4 : 28.8 77.15%
• ⎿ Target 3 : 27.8 57.1%
• ⎿ Target 2 : 26.6 33.05%
• ⎿ Target 1 : 25.7 15.05%
• ⎿ Entry : 24.95 - 100%
• 🚫 Stop: 23.6 (-27.05%)
We provide these for free in hopes you decide to automate for passive income with us!
KSM/USDT - Kusama: TrendLine Touch◳◱ On the $KSM/ CRYPTOCAP:USDT chart, the Trendline Touch pattern suggests an upcoming trend shift. Traders might observe resistance around 28.15 | 31.03 | 36.52 and support near 22.66 | 20.05 | 14.56. Entering trades at 23.13 could be strategic, aiming for the next resistance level.
◰◲ General info :
▣ Name: Kusama
▣ Rank: 184
▣ Exchanges: Binance, Kucoin, Bybit, Huobipro, Gateio, Mexc
▣ Category/Sector: Infrastructure - Smart Contract Platforms
▣ Overview: Kusama is an early, experimental version of Polkadot that exists as an independent network. It intends to act as a sandbox for developers, allowing teams to deploy and test pre-release versions of their projects before launching them on Polkadot's mainnet. Kusama will also serve as a testbed for Parity Technologies leading up to the mainnet launch of Polkadot. Like its sister chain, Kusama uses a native token, KSM, to power computation and give holders the ability to participate in securing the network and voting on upgrade proposals.
◰◲ Technical Metrics :
▣ Mrkt Price: 23.13 ₮
▣ 24HVol: 3,086,263.265 ₮
▣ 24H Chng: -4.619%
▣ 7-Days Chng: -11.78%
▣ 1-Month Chng: 21.95%
▣ 3-Months Chng: 20.35%
◲◰ Pivot Points - Levels :
◥ Resistance: 28.15 | 31.03 | 36.52
◢ Support: 22.66 | 20.05 | 14.56
◱◳ Indicators recommendation :
▣ Oscillators: NEUTRAL
▣ Moving Averages: STRONG_SELL
◰◲ Technical Indicators Summary : SELL
◲◰ Sharpe Ratios :
▣ Last 30D: 3.38
▣ Last 90D: 1.28
▣ Last 1-Y: 0.25
▣ Last 3-Y: 0.44
◲◰ Volatility :
▣ Last 30D: 0.97
▣ Last 90D: 0.67
▣ Last 1-Y: 0.72
▣ Last 3-Y: 1.18
◳◰ Market Sentiment Index :
▣ News sentiment score is N/A
▣ Twitter sentiment score is 0.64 - Bullish
▣ Reddit sentiment score is 0.71 - Bullish
▣ In-depth KSMUSDT technical analysis on Tradingview TA page
▣ What do you think of this analysis? Share your insights and let's discuss in the comments below. Your like, follow and support would be greatly appreciated!
◲ Disclaimer
Please note that the information and publications provided are for informational purposes only and should not be construed as financial, investment, trading, or any other type of advice or recommendation. We encourage you to conduct your own research and consult with a qualified professional before making any financial decisions. The use of the information provided is solely at your own risk.
▣ Welcome to the home of charting big: TradingView
Benefit from a ton of financial analysis features, instruments and data. Have a look around, and if you do choose to go with an upgraded plan, you'll get up to $30.
Discover it here - affiliate link -

ksmIf it crosses the red box with full strength, it can have good goals and growth. By changing the level of the chart, higher goals are shown.
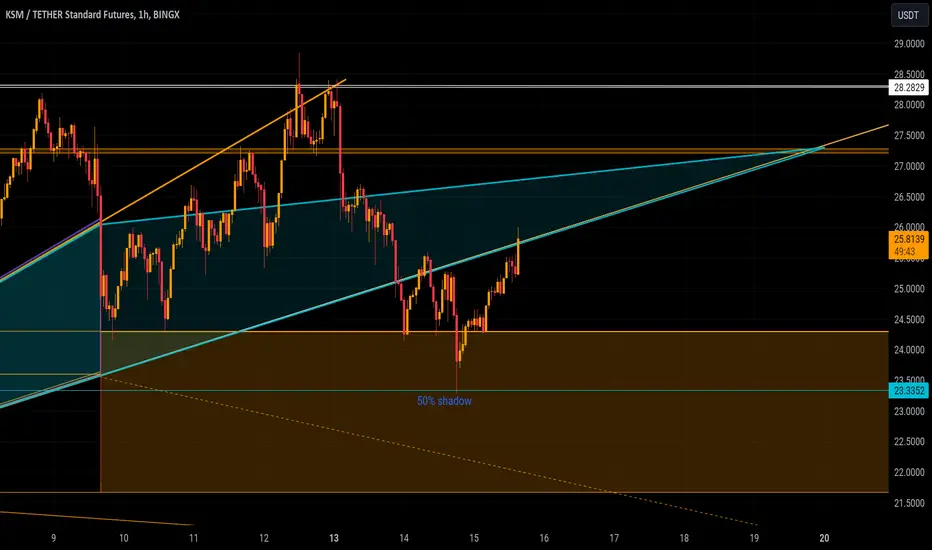
Update Ksmusdt in 1H, trigger Mr" saaed khakestar"50% shadow in 1H ,this beautiful action & exactly touches. Probability in 15M or 5M touch point.
Ksm in 4 HWe thereare here a 50% long shadow ,for 22 $ and that is Philip level and we will can a scalp that situation probably .base this analysis is trigger action
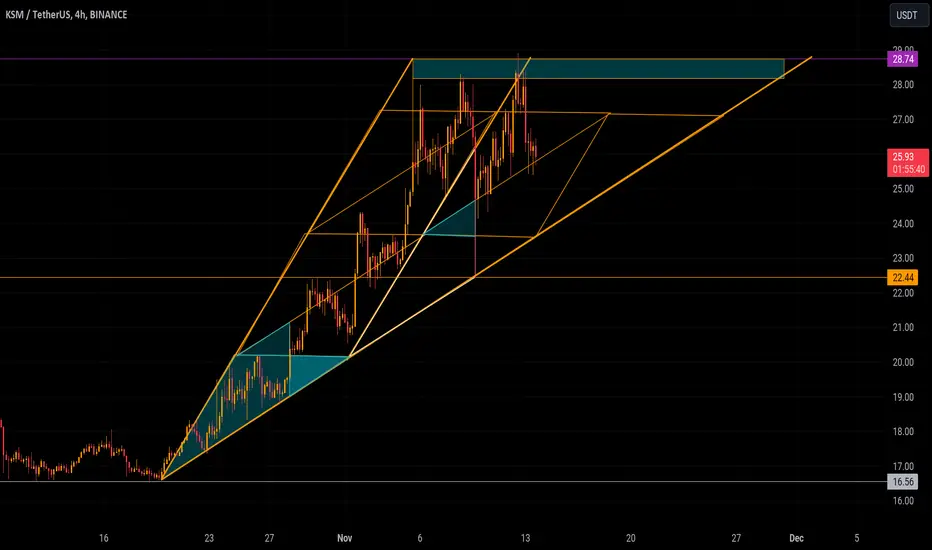
KSM ANALYSIS (4H)According to the investigation and analysis we have had on KSM, we have noticed the diamond diametric pattern.
It seems that the E wave itself has become a diametric that we are now in the G wave. The green area is a low-risk area for buying.
If you want to reduce the risk, wait and get a bullish trigger from the candles and then enter the trade.
Be sure to perform capital management and risk control because technical analysis is not certain and is a probabilistic analysis.

KSM 1w chart looks solid... KSM breakout the most powerful area, the POC, and it may retest and from there it could be a great entry area
We have a shark pattern and it brakout the trend as well
All the best insha Allah!
🚀Kusama : Is a Breakout on the Horizon?🚀Kusama (KSM), often referred to as the experimental cousin of Polkadot, is currently catching the attention of traders and investors. While the cryptocurrency market is no stranger to price volatility, Kusama's recent price action has sparked excitement and anticipation for a potential breakout.
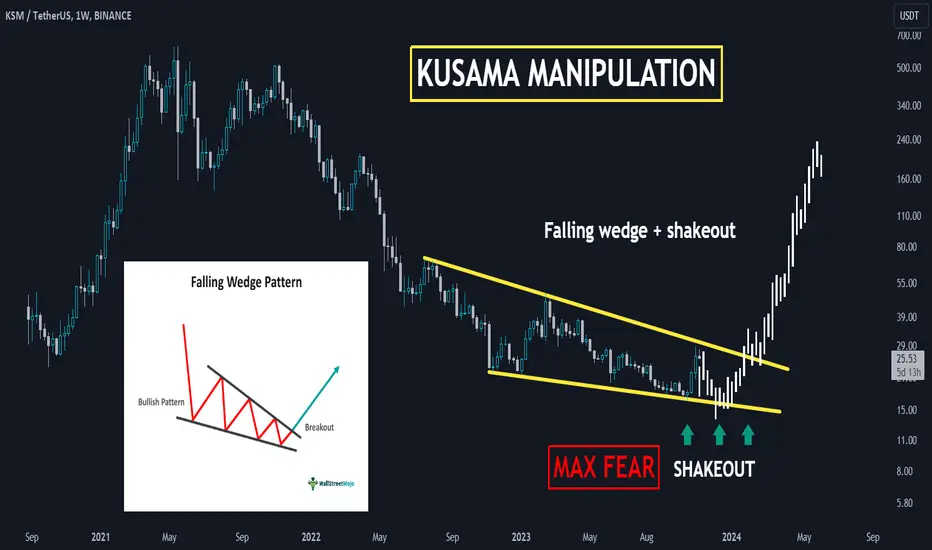
Shakeout Strategy: The Art of Market Manipulation
In the world of trading, market manipulation often plays a significant role. One strategy employed by market participants is a shakeout, where prices are manipulated to briefly dip below a key level before rebounding. For Kusama, this key level stands at $16, the lowest point in recent trading.
Pattern Recognition: Breaking Out of a Descending Wedge
Another positive development for Kusama is the formation of a descending wedge pattern. This pattern, characterized by narrowing price ranges, often leads to a breakout. In Kusama's case, the potential for an upside breakout is generating excitement among traders.
What to Expect: A Potential Bullish Surge
Based on these patterns and strategies, many traders are watching Kusama closely. A successful rebound from the shakeout point, combined with the descending wedge pattern, may serve as a springboard for a bullish surge.
Trading Strategy: Preparing for Opportunities
For traders, Kusama's current situation offers the chance to prepare for possible trading opportunities. Whether you're a seasoned trader or new to the game, risk management is crucial in such scenarios.
Conclusion: The Potential for a Kusama Surge
While Kusama's recent market activity has included a shakeout strategy, there is reason for optimism. The descending wedge pattern suggests the potential for a bullish breakout, and for traders, this translates into the chance for profitable trades.
🚀 Crypto Insights | 💡 Trading Strategies | 💰 Market Analysis
❗See related ideas below❗
Please share your thoughts and insights on Kusama's price action. 💚🚀💚
KSM/USDT Break the key area. Upward Momentum for KSM ???💎 KSM has certainly captured the market's attention. As of now, KSM has successfully breached the supply zone and is in the midst of a retest, with the previous supply now acting as a demand zone. For KSM to sustain its bullish momentum, it needs to find support in this demand area and Probability aims for the next supply targets.
💎 However, if KSM struggles to hold above this demand zone and breaks below, it could signal a bearish shift. In such a scenario, KSM might target the subsequent demand level at $18.34. This would be a critical juncture for KSM, where it either bounces back towards the $20.51 mark or risks a further decline towards its primary support zone.

Buy Ksm and holdno explanation just buy it
its trust me bro type analysis
be careful and do ur own analysis
BINANCE:KSMUSDT
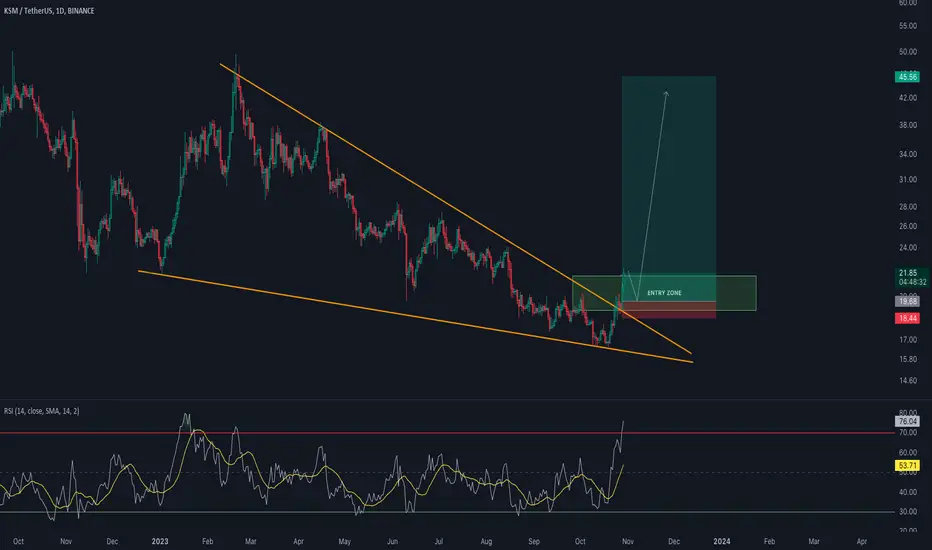
KSM BullishKSM bullish AF its broken out of a fallen wedge with confirmation i can see this runing to over 100 in the next few days.
KSMUSD: Double Bottom & Falling Wedge Breakout PotentialKSMUSD: Double Bottom Formation with Breakout Potential in Falling Wedge Pattern
Ksmusdt in dayl There are different tringle & I don't have good imagination this tringles because those are a kind unknown tringles for me, but by the way price 24 maybe will good to short.

🚨 Trade Alert: KSM/USDT (3-5x)🚨 New Trade Alert 🚨
✅ KSM/USDT (3-5x)
📉 LONG Entry Zone: 19 - 21.59
⛔️ SL: 18.44
🔒 Breakeven Move: When it moves close to TP2
🎯 Take Profit:
Short Term: 21.88 - 22 - 22.5 - 23 - 24
Mid Term: 25 - 27 - 30 - 35 - 40 - 45
📝 Ensure you set entry orders to balance the trade's entry and aim to secure 30% of profits within the first two targets. Once profits are gained, adjust the stop orders to match the entry points or break-even levels.
⚠️ Disclaimer: Historical earnings cannot assure future outcomes. Is there a potential for risk? Certainly. The entire financial market is susceptible to uncertainties; any underlying factor or abrupt shift in market sentiment could overturn the current market trends and lead to losses. Refrain from undertaking undue risks that might jeopardize your financial stability. You are under no obligation to engage in this trade; kindly avoid the trade if you disagree with the trade analysis.
GIS TRADING®
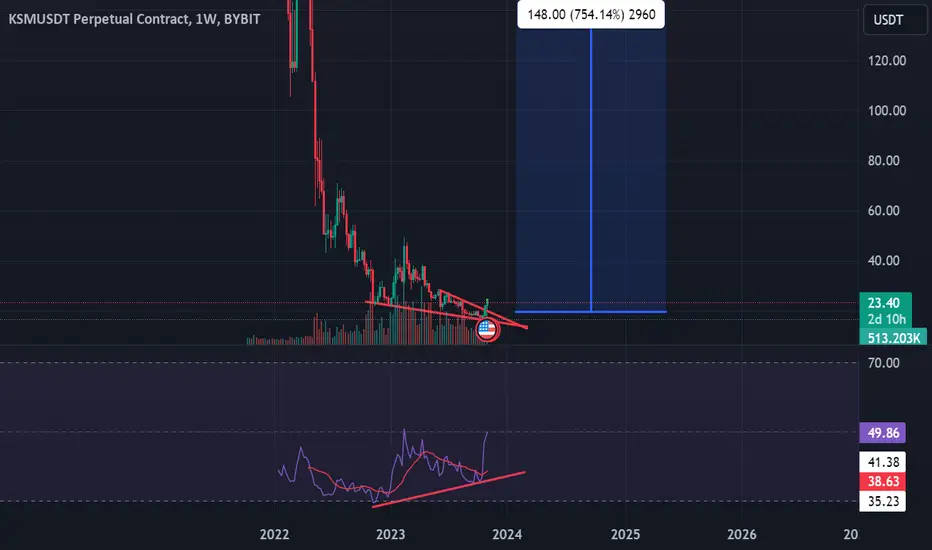
finally ksm looks ready for solid gains seems like ksm has already bottomed out and preparing for massive bullish rally
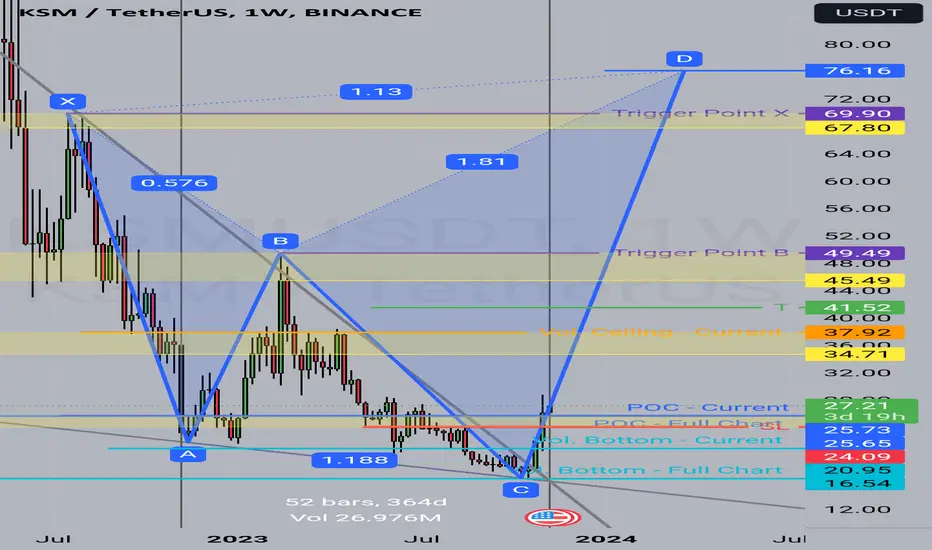
descending channel breakout has already confirmed so ksm reverses its trend expecting bullish rally towards 75 to 80$ in midterm keep eyes on for retest for perfect entries
KSM/USDT Bouncing on the Support Level, Ready to Upward ??💎 KSM has undoubtedly captured our attention. It's currently navigating within a Broadening Wedge formation. Historically, after touching the pattern's support trendline, KSM has shown a tendency to rebound and progressively approach key resistance levels.
💎 For this bullish scenario to play out, KSM must surpass the supply mark at $16.37 and sustain a close above it. Achieving this could pave the way for KSM to target the major resistance zone.
💎 Conversely, if KSM struggles to breach the $16.37 supply point, it might either pull back to a nearby support for another attempt or trend downwards towards a critical support level.

Bull Market about to startAltcoins are ripe for the picking. Showing bottoming signs. The end of the bear market is upon us.
Bullish Divergence on weekly, daily, as well as on lower timeframes
Not trading advice
Happy Trading
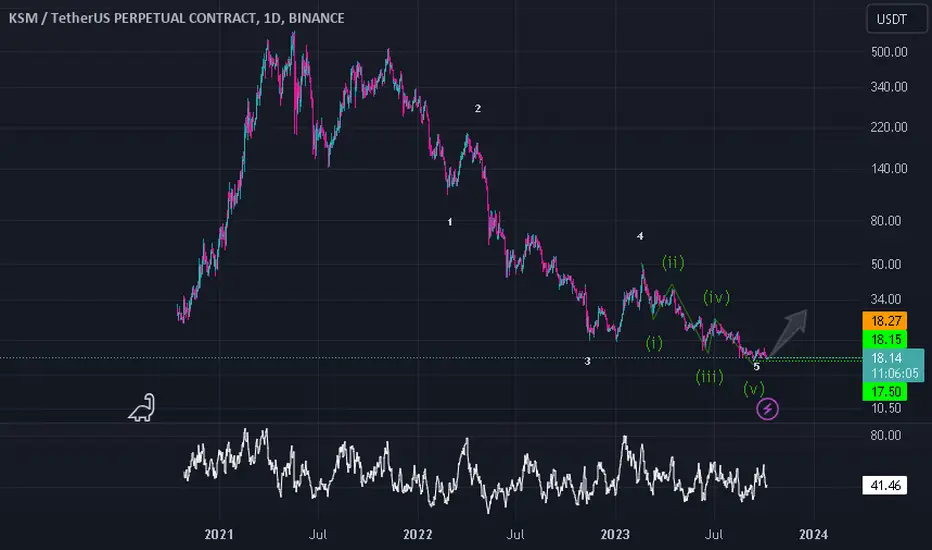
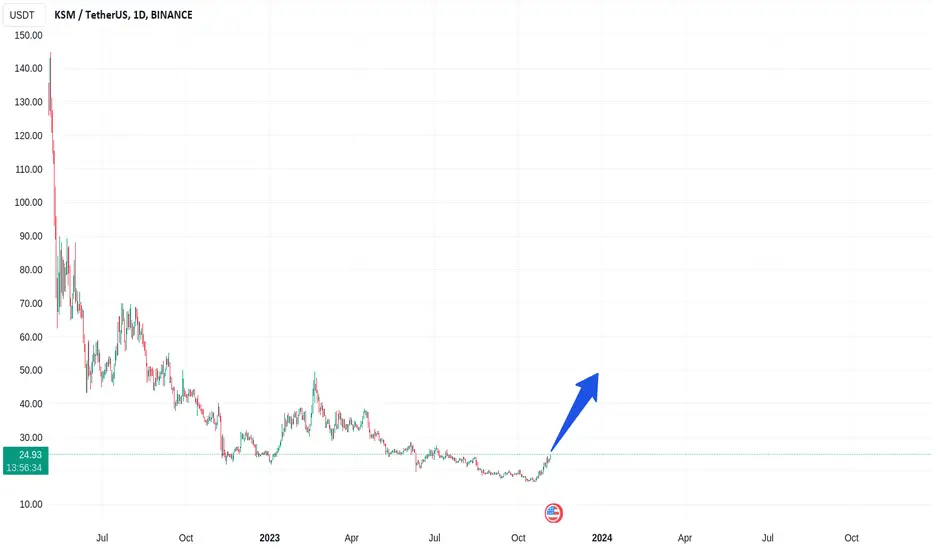
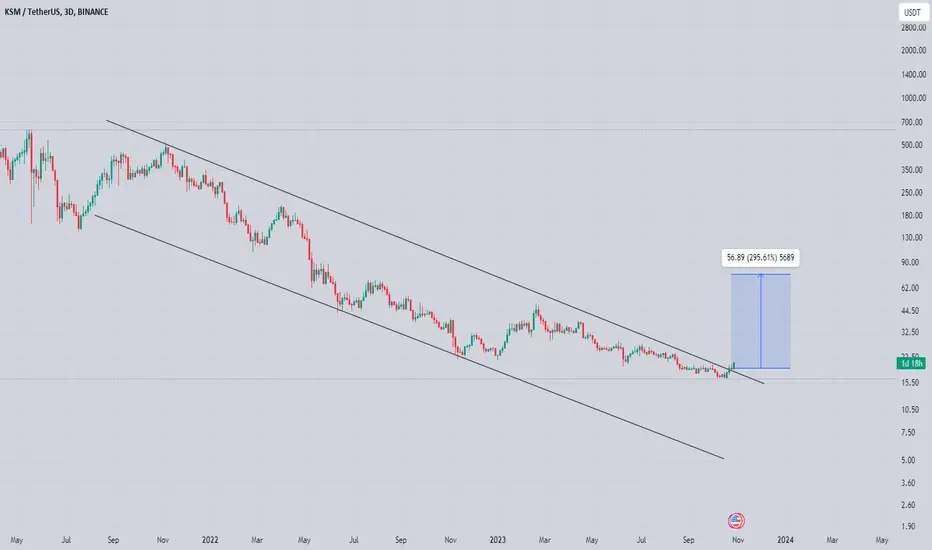
KSM, getting ready for hefty price growth!KSM has corrected significantly from its golden era where it peaked at its ath at 519, then have continued its massive trim downs till the 16 area.
Now on weekly data, an important weekly shift on price has been spotted. A trendline kiss is about to transpire signifying an important long term crossover of trend. Progressive hefty net buying has been registered at the current range -- cementing this low base for its incoming series of ascend.
Expect some weighty upside movement from the present levels.
Spotted at 18.0
RR ratio on this one looks too good to be missed at 30x base from its last peak.
The blackbird (from its logo) is about to take flight soon.
TAYOR.
Safeguard funds always.
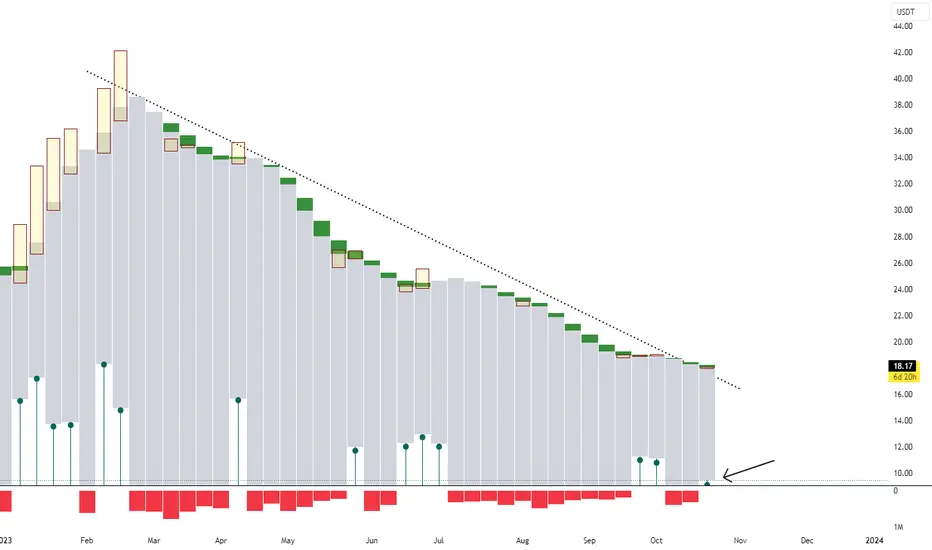
KSMUSDTKSMUSDT is trading under the declining in descending parallel channel and break through Support and closed below this zone. now the price perfectly retest of broken level
Will the sellers attack again and send the price to below 15 level?
What you guys think of this idea ?